On-chain data plots a path to $2,400.

Ethereum has surpassed the $2,100 level over the past day, and if on-chain data is anything to go by, a rise toward a yearly high could be “easy.”
Ethereum does not have significant on-chain resistance at higher levels.
analyst post on On-chain resistance and support levels are defined by the density of investors buying there.
The reason lies in the way investor psychology works. Cost basis is a critical level for any investor, so you may be tempted to pay special attention and make some moves whenever prices are retested.
Holders who suffered losses before the retest may lean towards selling for fear of the cryptocurrency falling below it again, so exiting at breakeven means they can at least avoid losses.
Likewise, investors may decide to accumulate more if they have previously made a profit. Because this level will be viewed as a profitable point of entry into the asset.
Now here is a chart showing what the Ethereum price range around the current price looks like in terms of the density of investors sharing the cost basis:
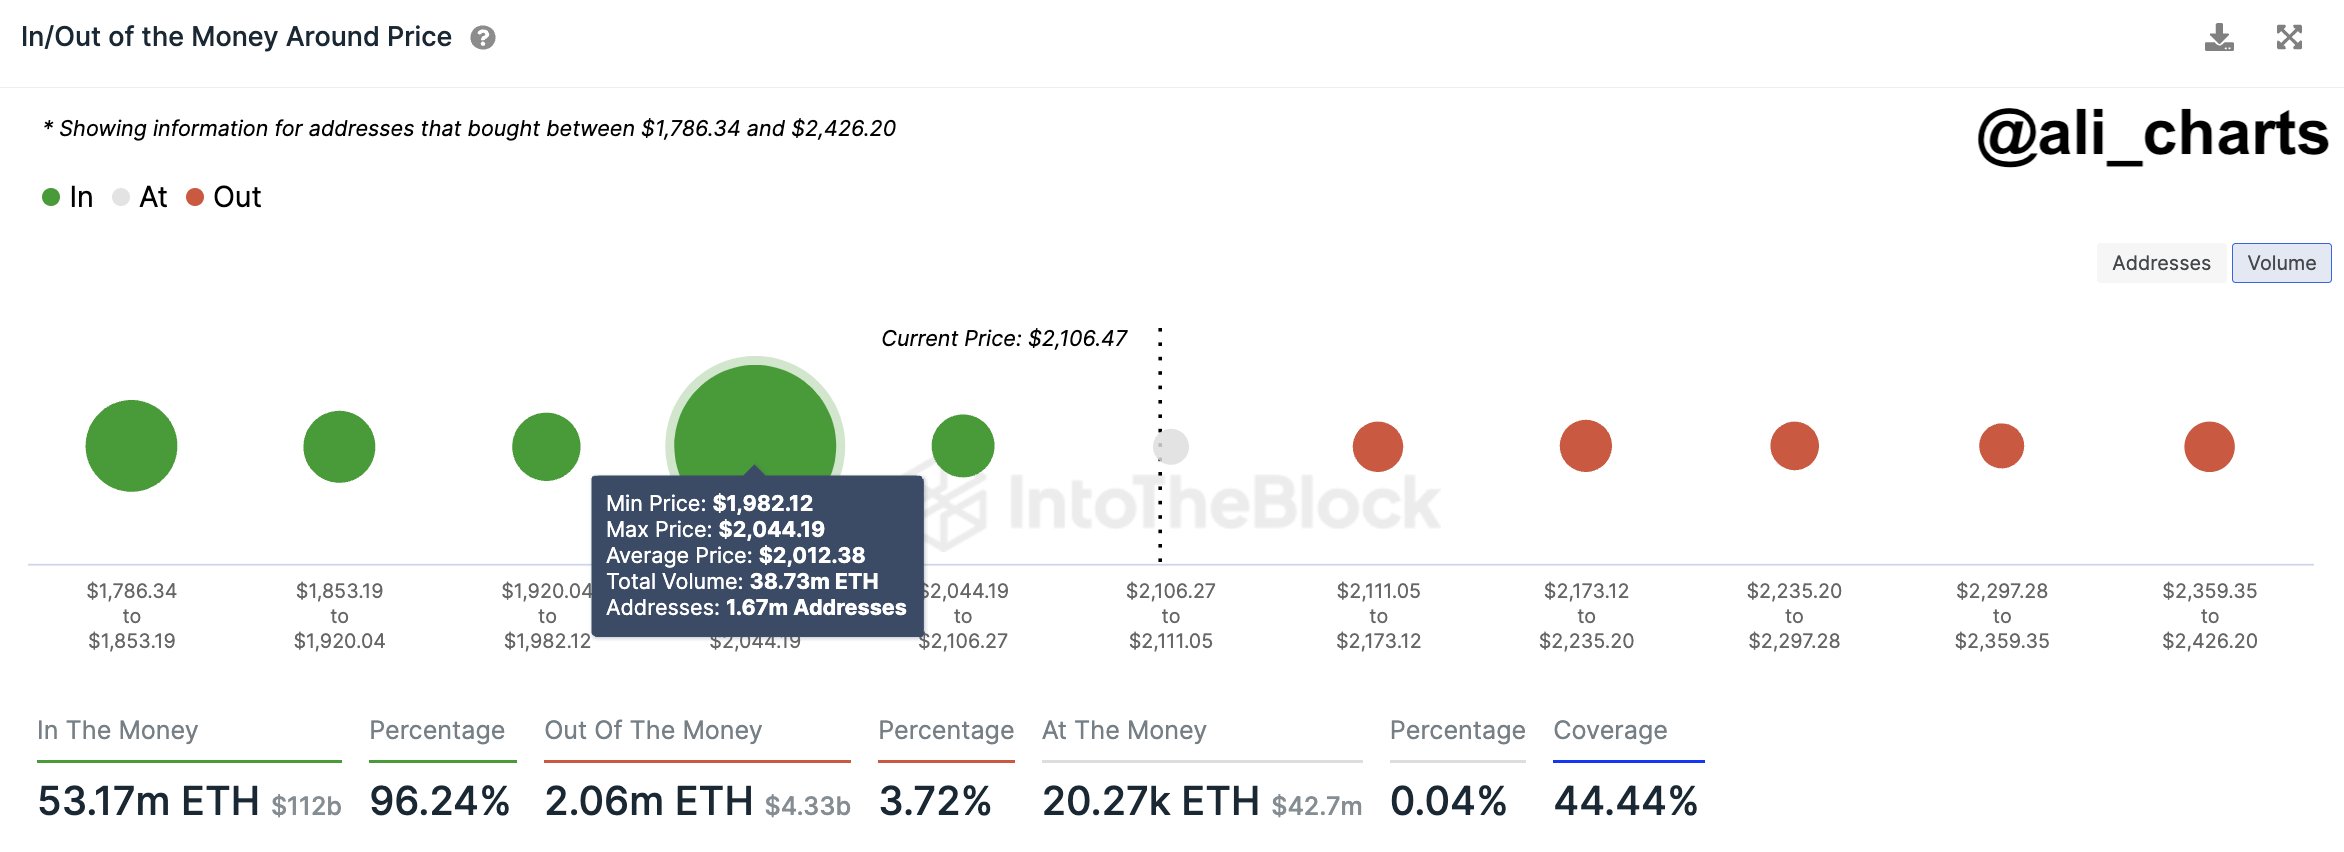
Looks like the levels above don't host the cost basis of that many investors | Source: @ali_charts on X
As shown in the graph above, the Ethereum price range between $1,982 and $2,044 hosts a cost basis of approximately 1.67 million addresses that have acquired 38.73 million ETH at this level.
Naturally, the more investors who share a cost basis within a certain range, the stronger the reaction that can be felt when the price is retested due to the buy/sell effect mentioned earlier.
Therefore, this range with many investors will be an important area for cryptocurrencies. Ethereum has already surpassed this area and has gained some distance with its recent breakout, so this range is likely to act as support now.
Ethereum has strong support areas while at the same time, as can be seen from the chart, there are no major resistance areas directly above it. This ideal setup theoretically means that ETH should not have much trouble rising towards the $2,426 level.
Other analyst It also pointed out how Ethereum has been observing negative exchange netflow since the beginning of the month. Here, Exchange Netflow is an indicator that tracks the net amount of ETH going out or coming into wallets on all centralized exchanges.
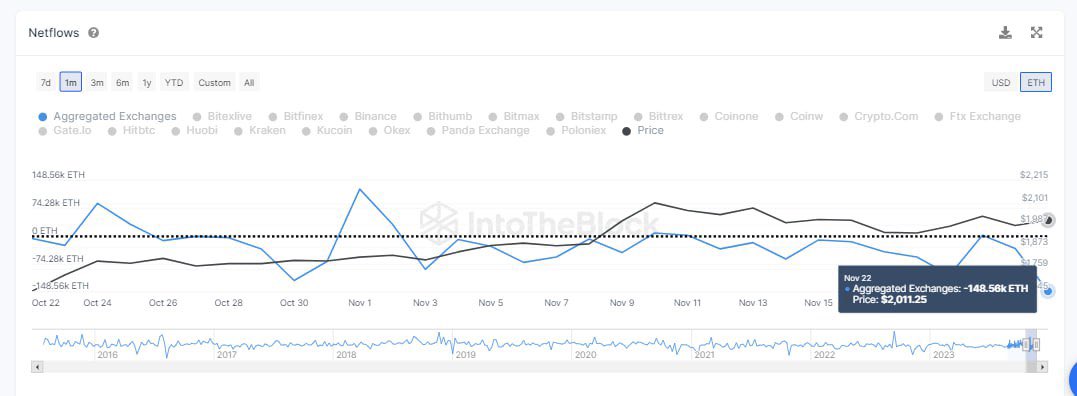
The indicator's value has been negative recently | Source: @C__thumbs on X
Net outflows during this period amounted to more than $1 billion, a potential sign of significant buying in the sector. This certainly adds weight to the idea that ETH could soon hit new annual highs.
ETH price
As of this writing, Ethereum is trading at around $2,100, up 9% over the past week.
ETH has been climbing in the last few days | Source: ETHUSD on TradingView
Featured image by Bastian Riccardi on Unsplash.com, chart by TradingView.com, IntoTheBlock.com


