Market Research and Analysis – Part 4: Trend Analysis Continued | dance with the trend

Index Analysis Summary
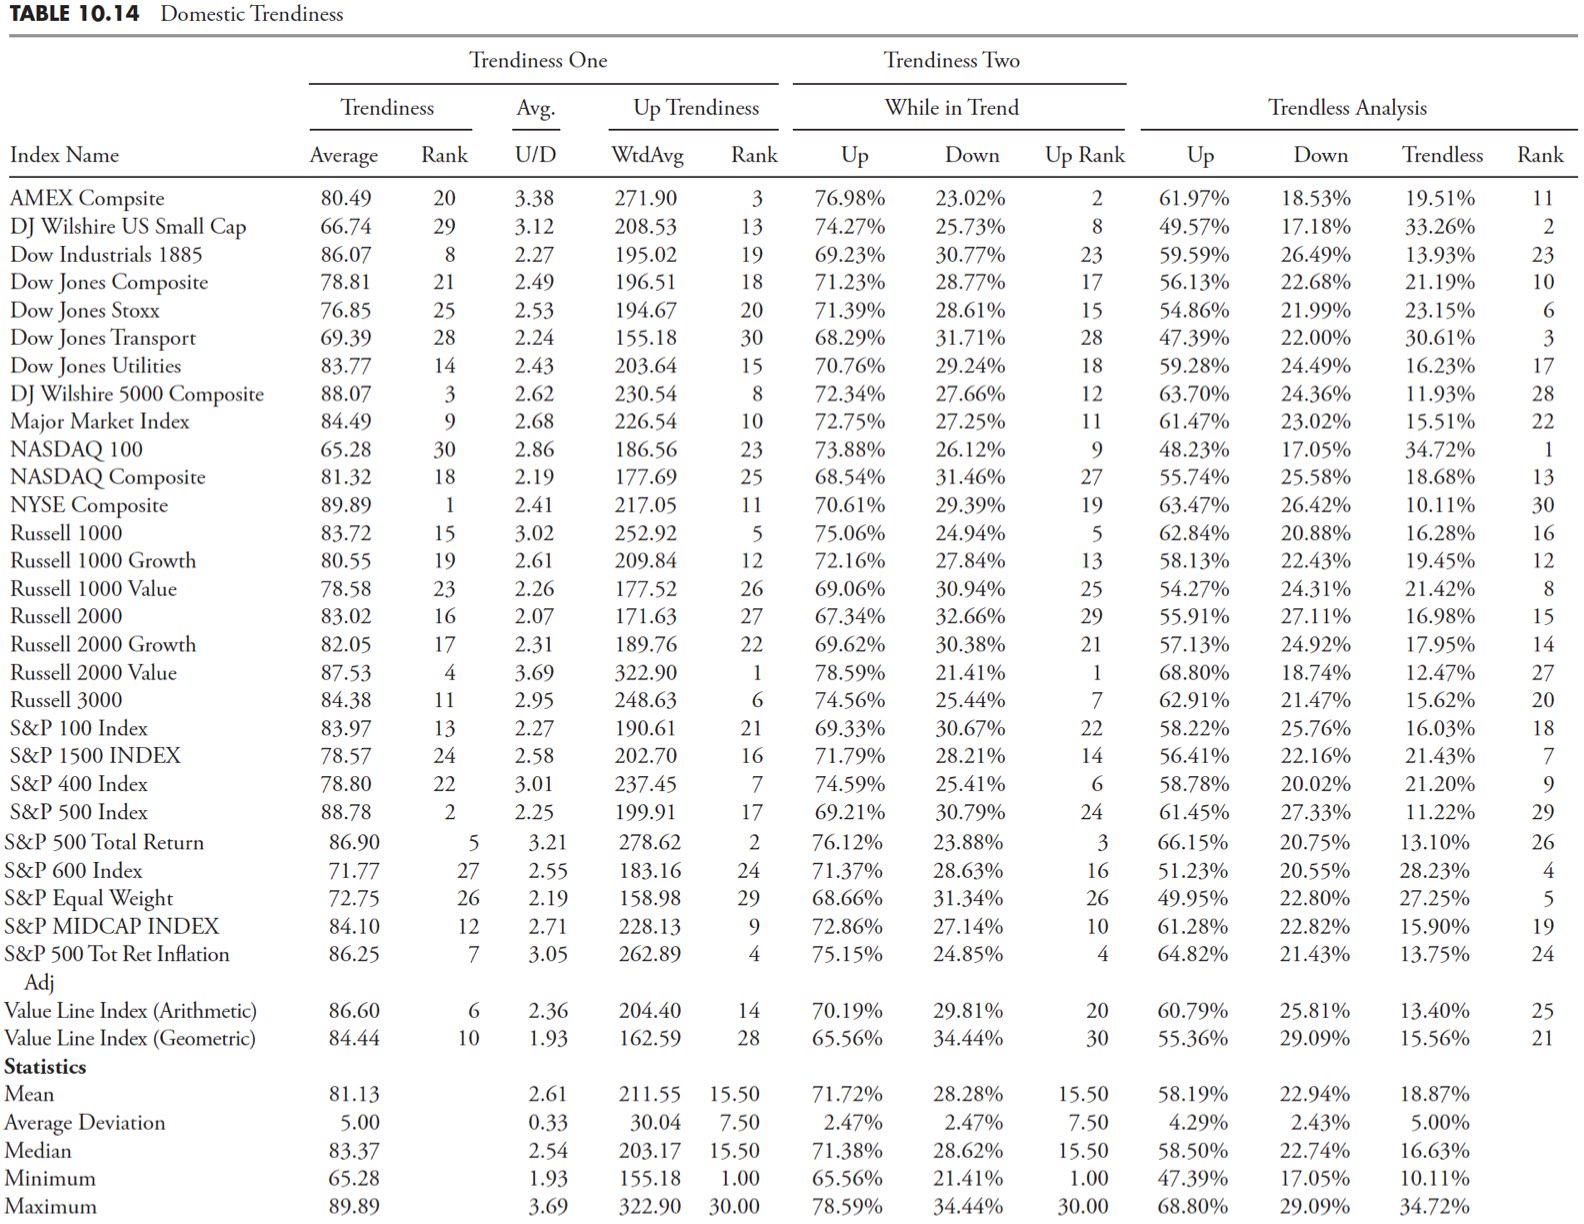
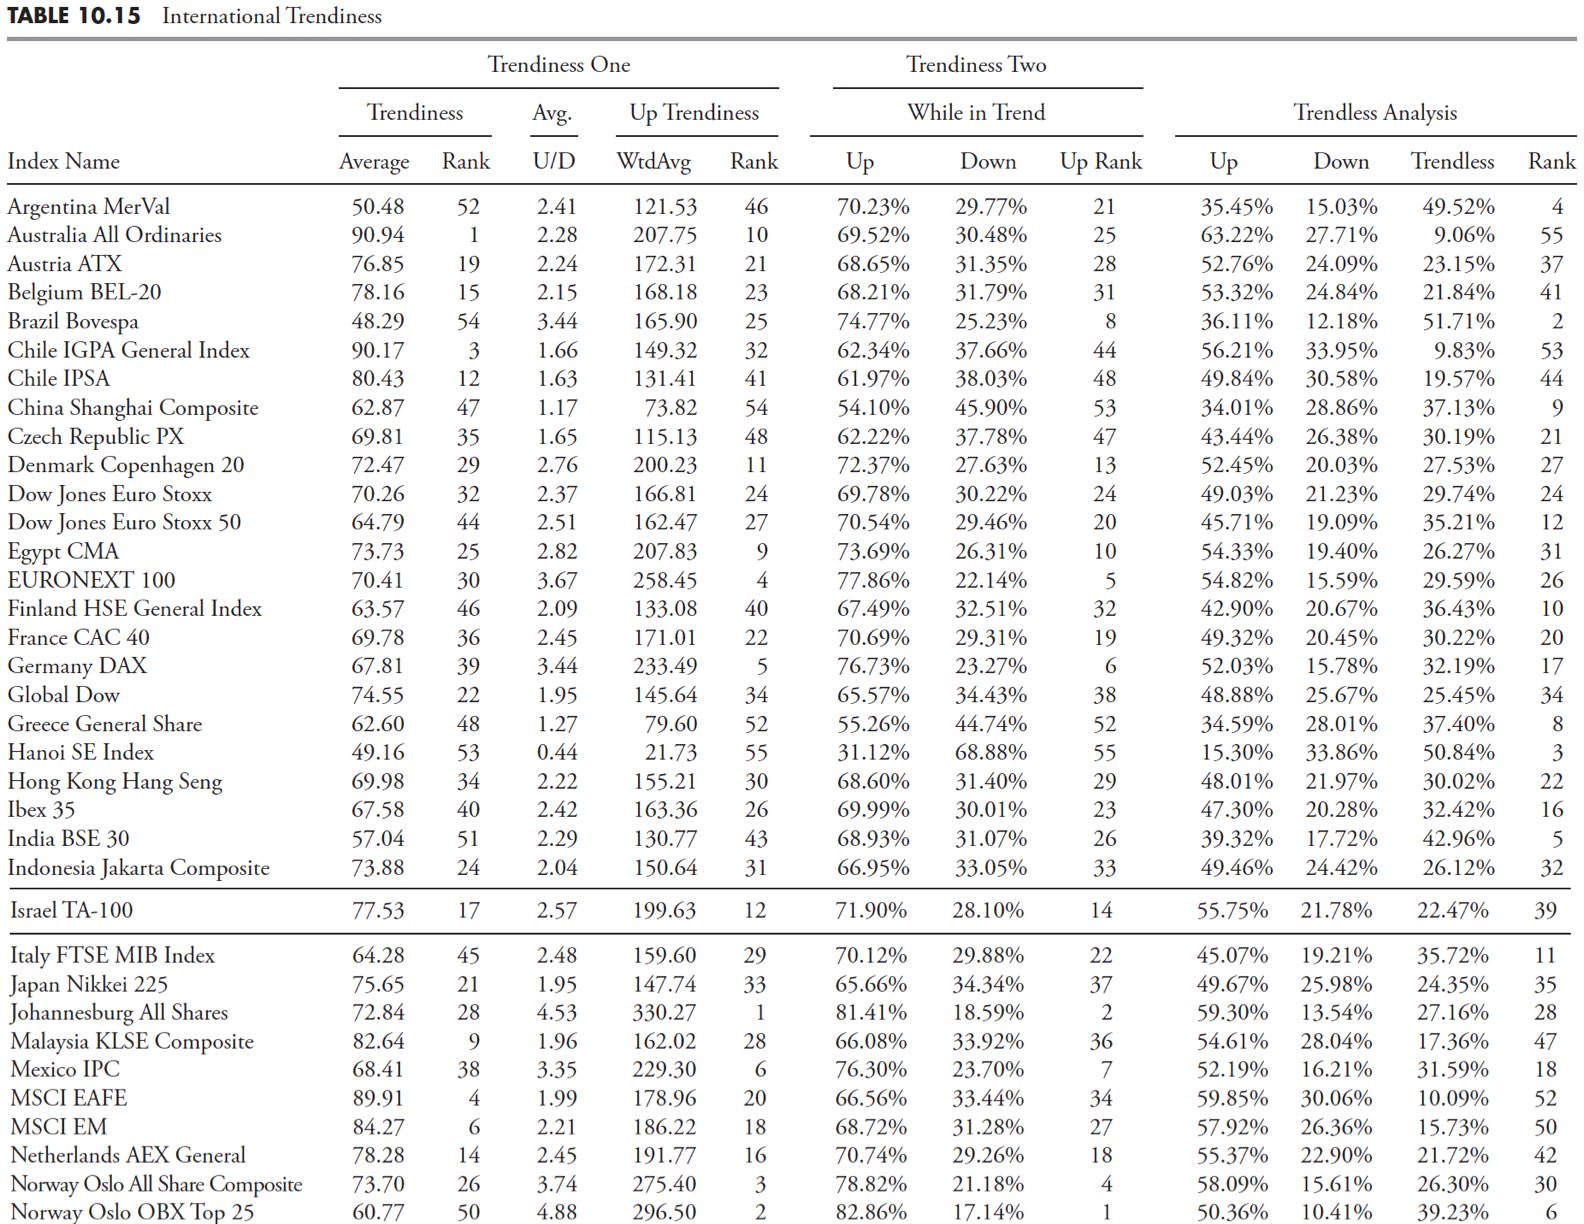
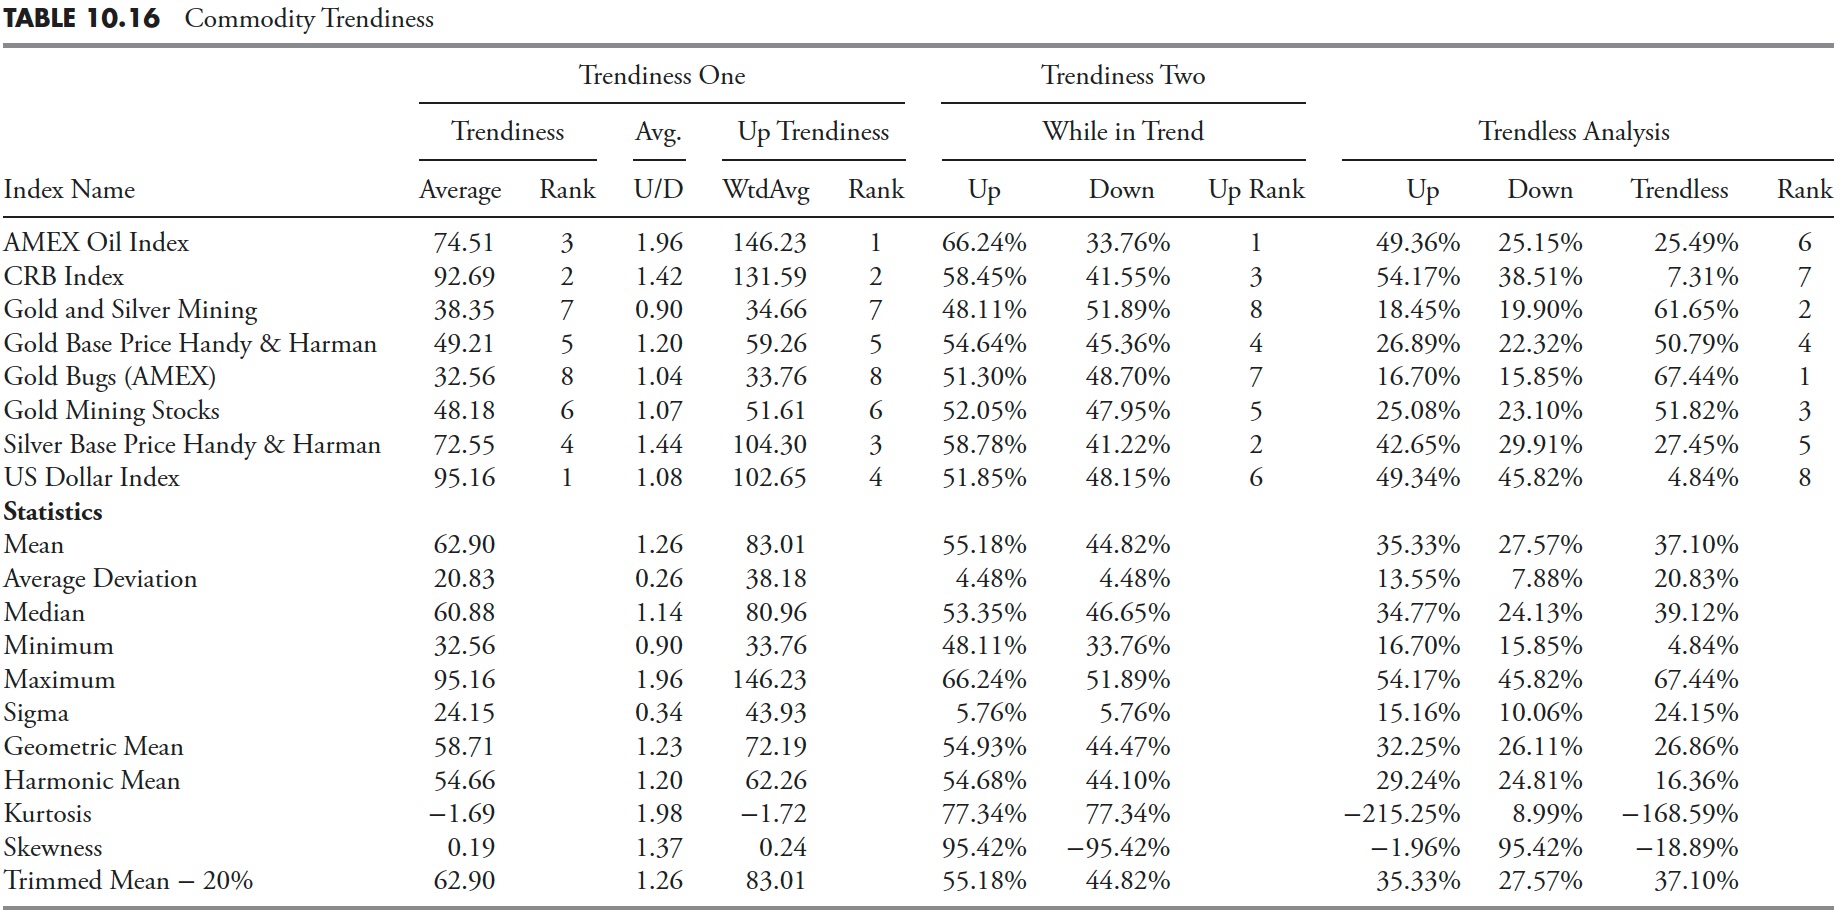
Continuing from the previous article, analyzing the various rankings for the index shows that the data in the table is robust and accurate. To summarize, there are two types of overall trend measurements: Trendiness One uses all data to determine the trend, while Trendless uses only trend data determined by filtered wave values and trend length. Of course, Trendiness One is a complement to Trendless analysis. They are still measuring prevalence in two different areas. There are also two Up Trendiness measures that use the same concept.
This may be a downward trend ranking, but I think upward trends are more prevalent in most markets.
Appendix B contains several tables showing the rankings sorted by rank, making it easier to find the rank you are looking for. The following table shows the various subsets of the All table we just analyzed.
domestic trend
Table 10.14 includes only domestic issues.
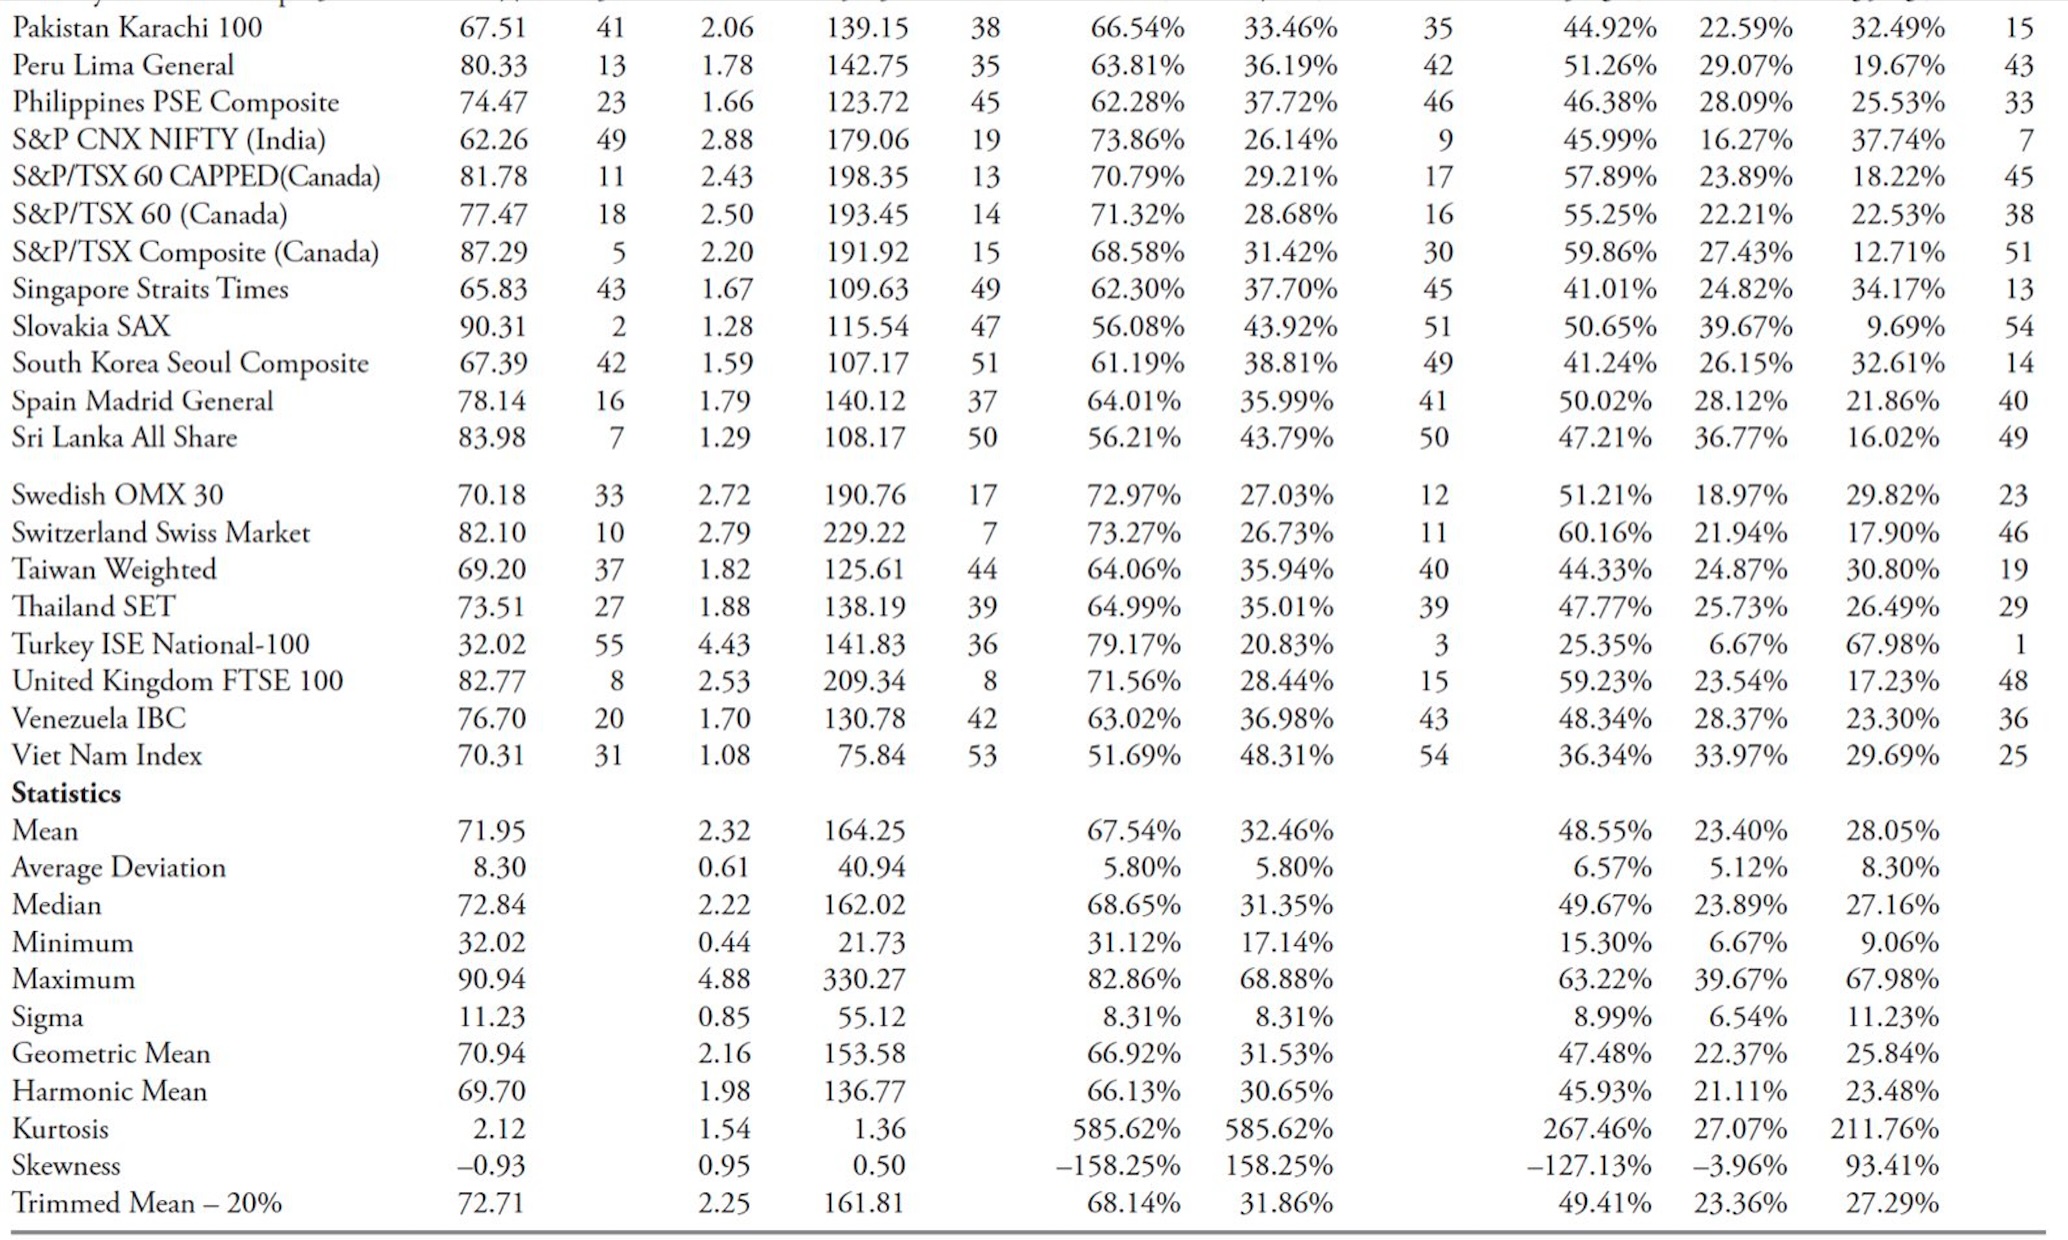
international trends
Table 10.15 includes only international issues.
product trends
Table 10.16 includes only commodity-based problems.
Industry trends
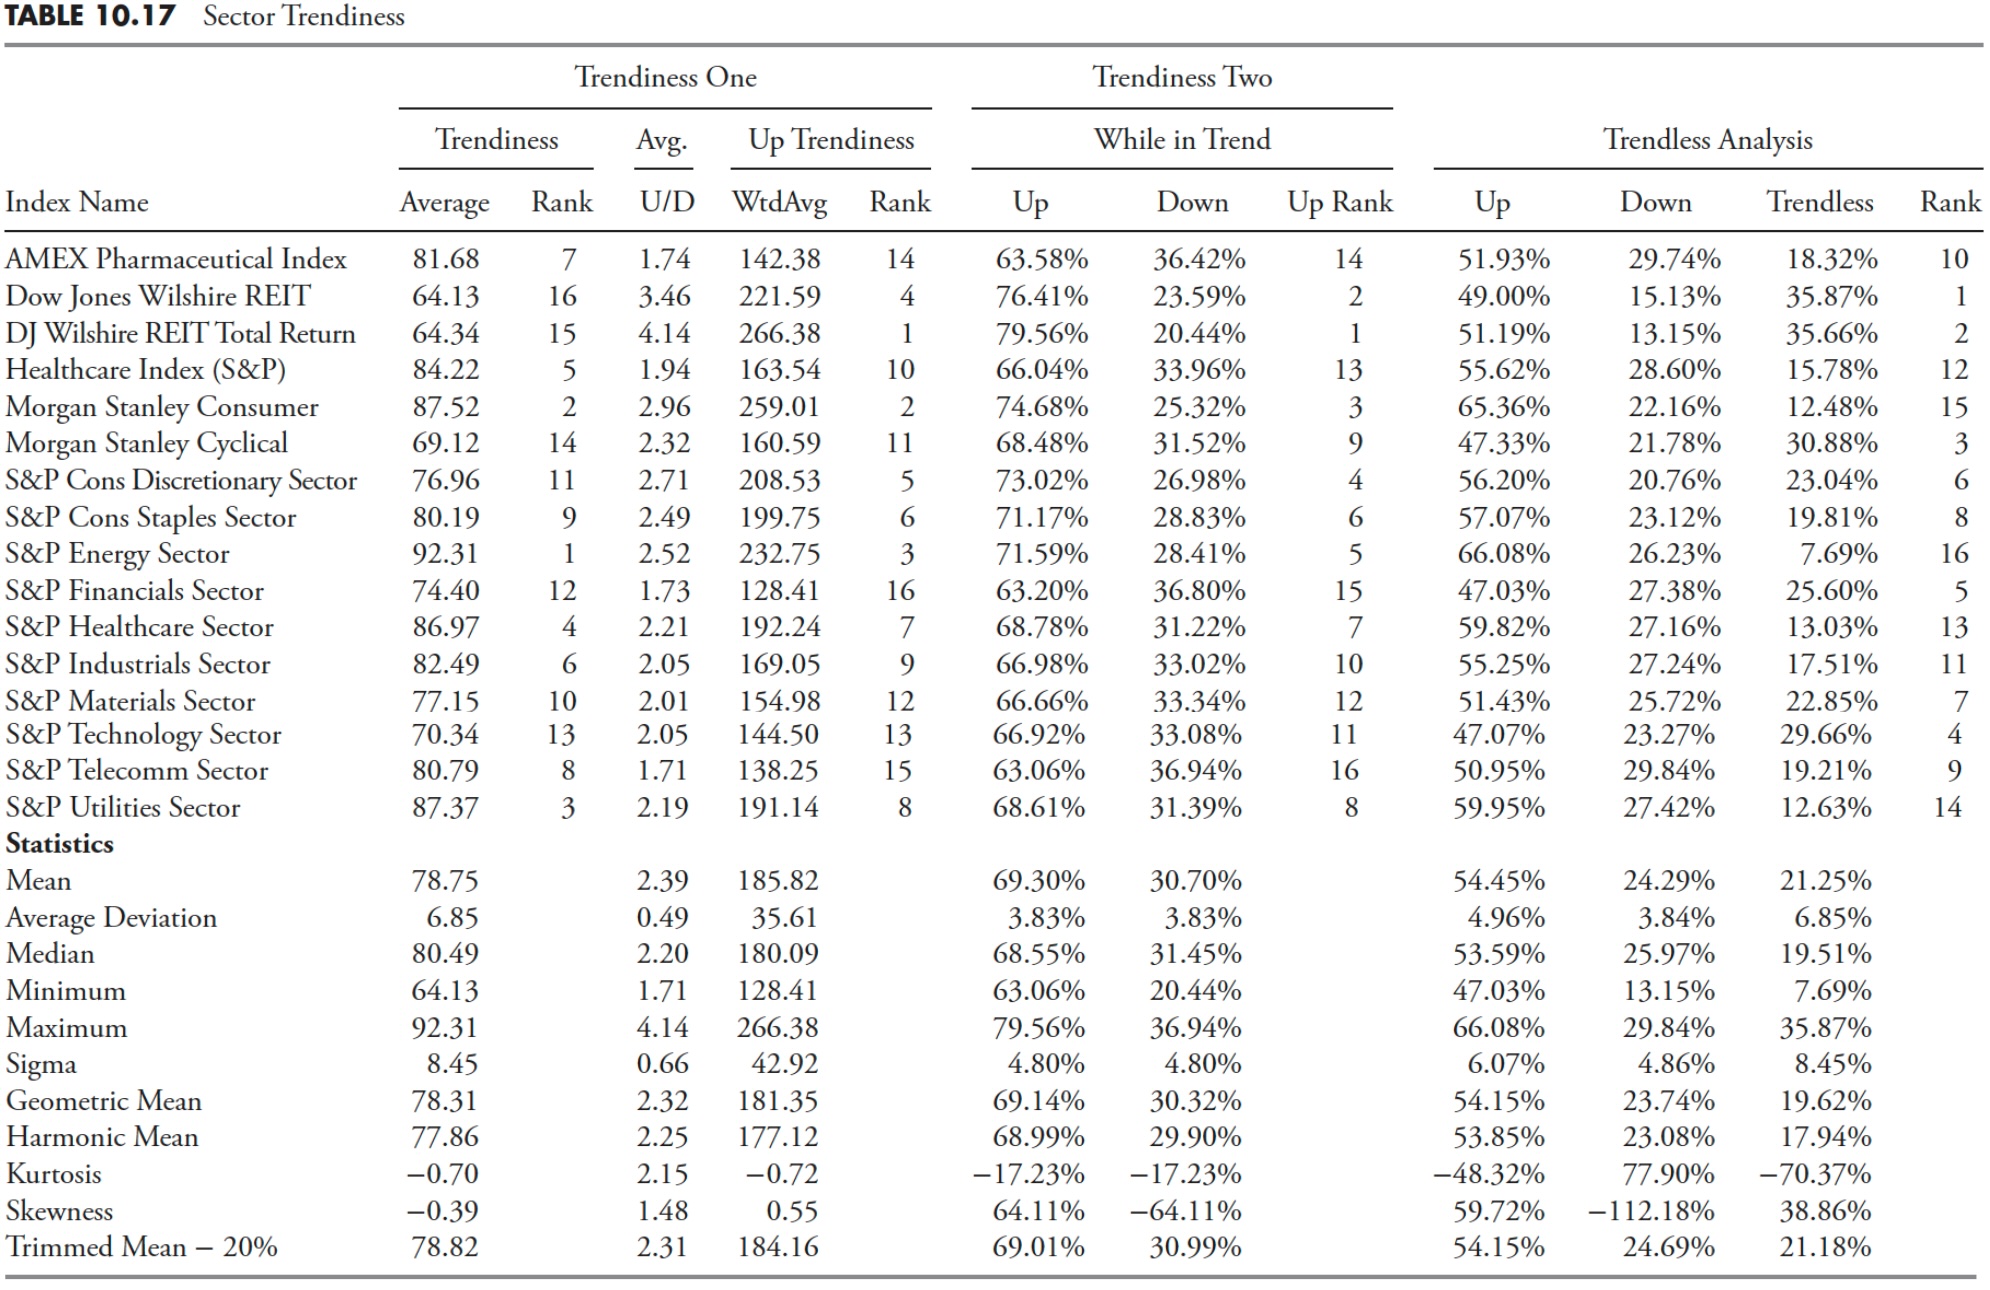
Table 10.17 includes only sector-related issues.
Data with history prior to 2000
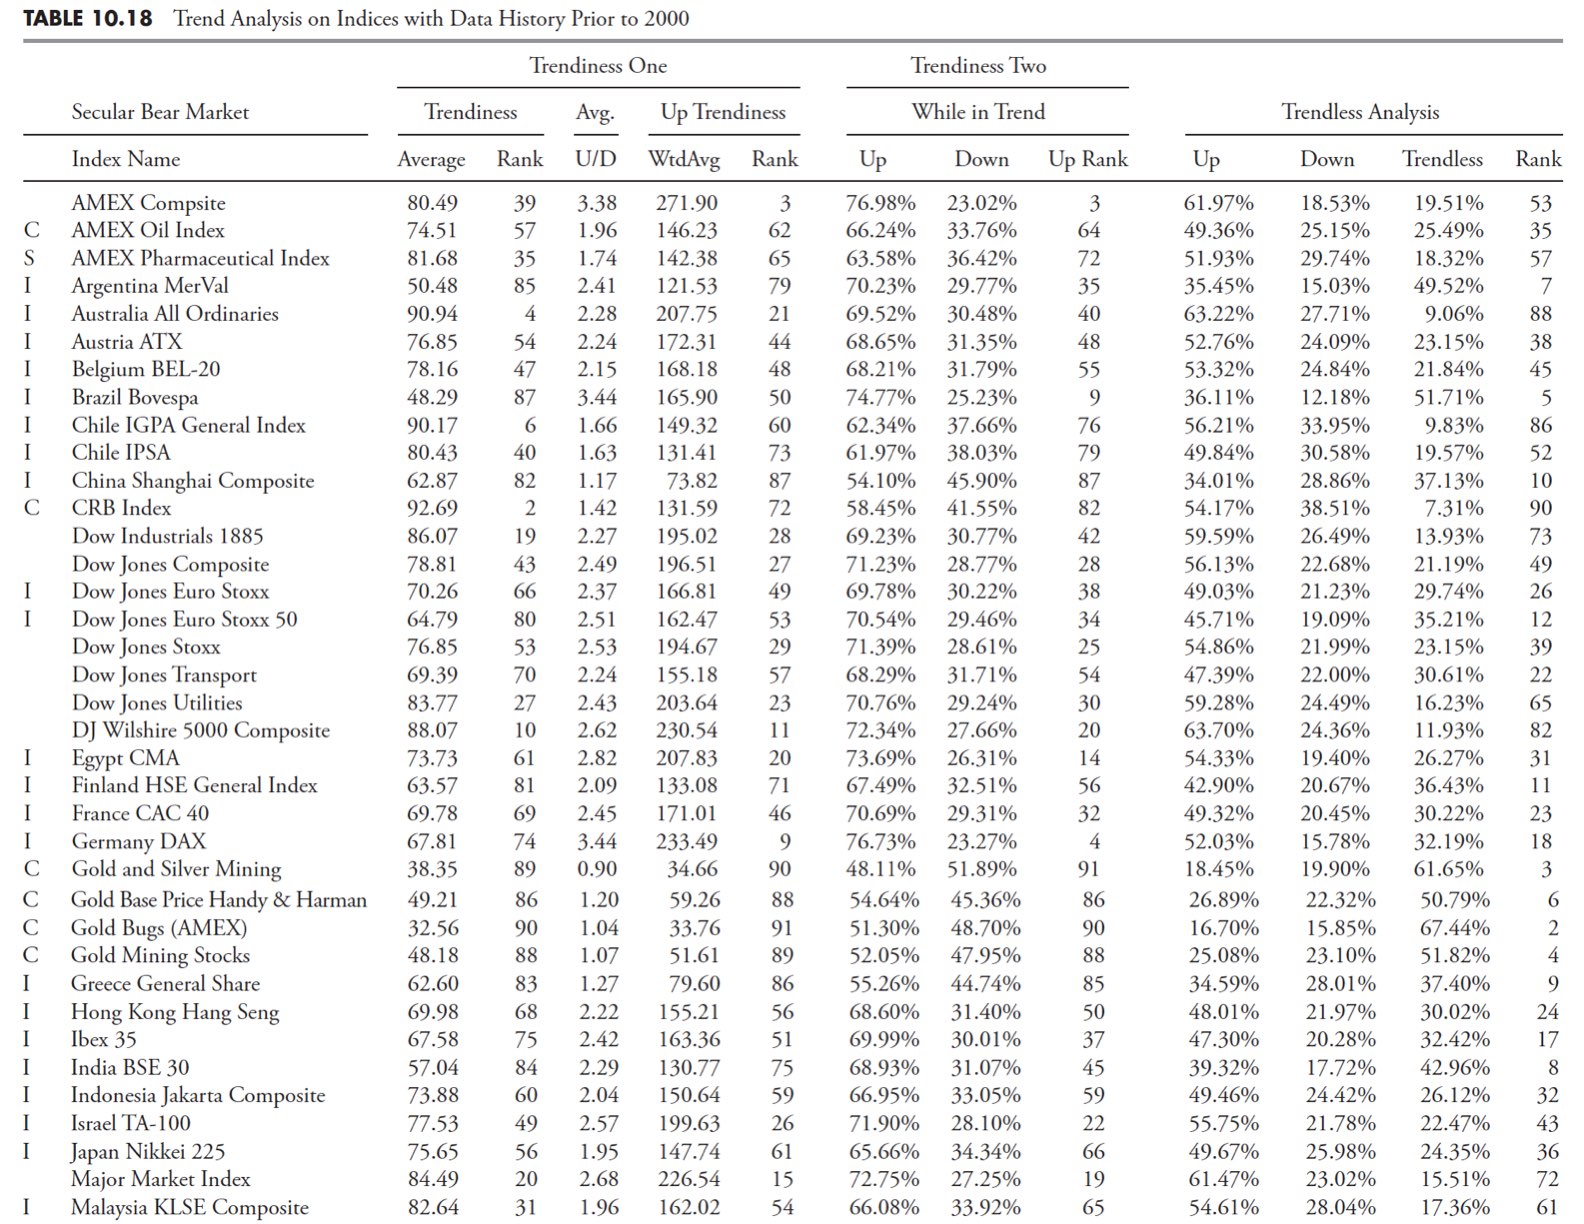
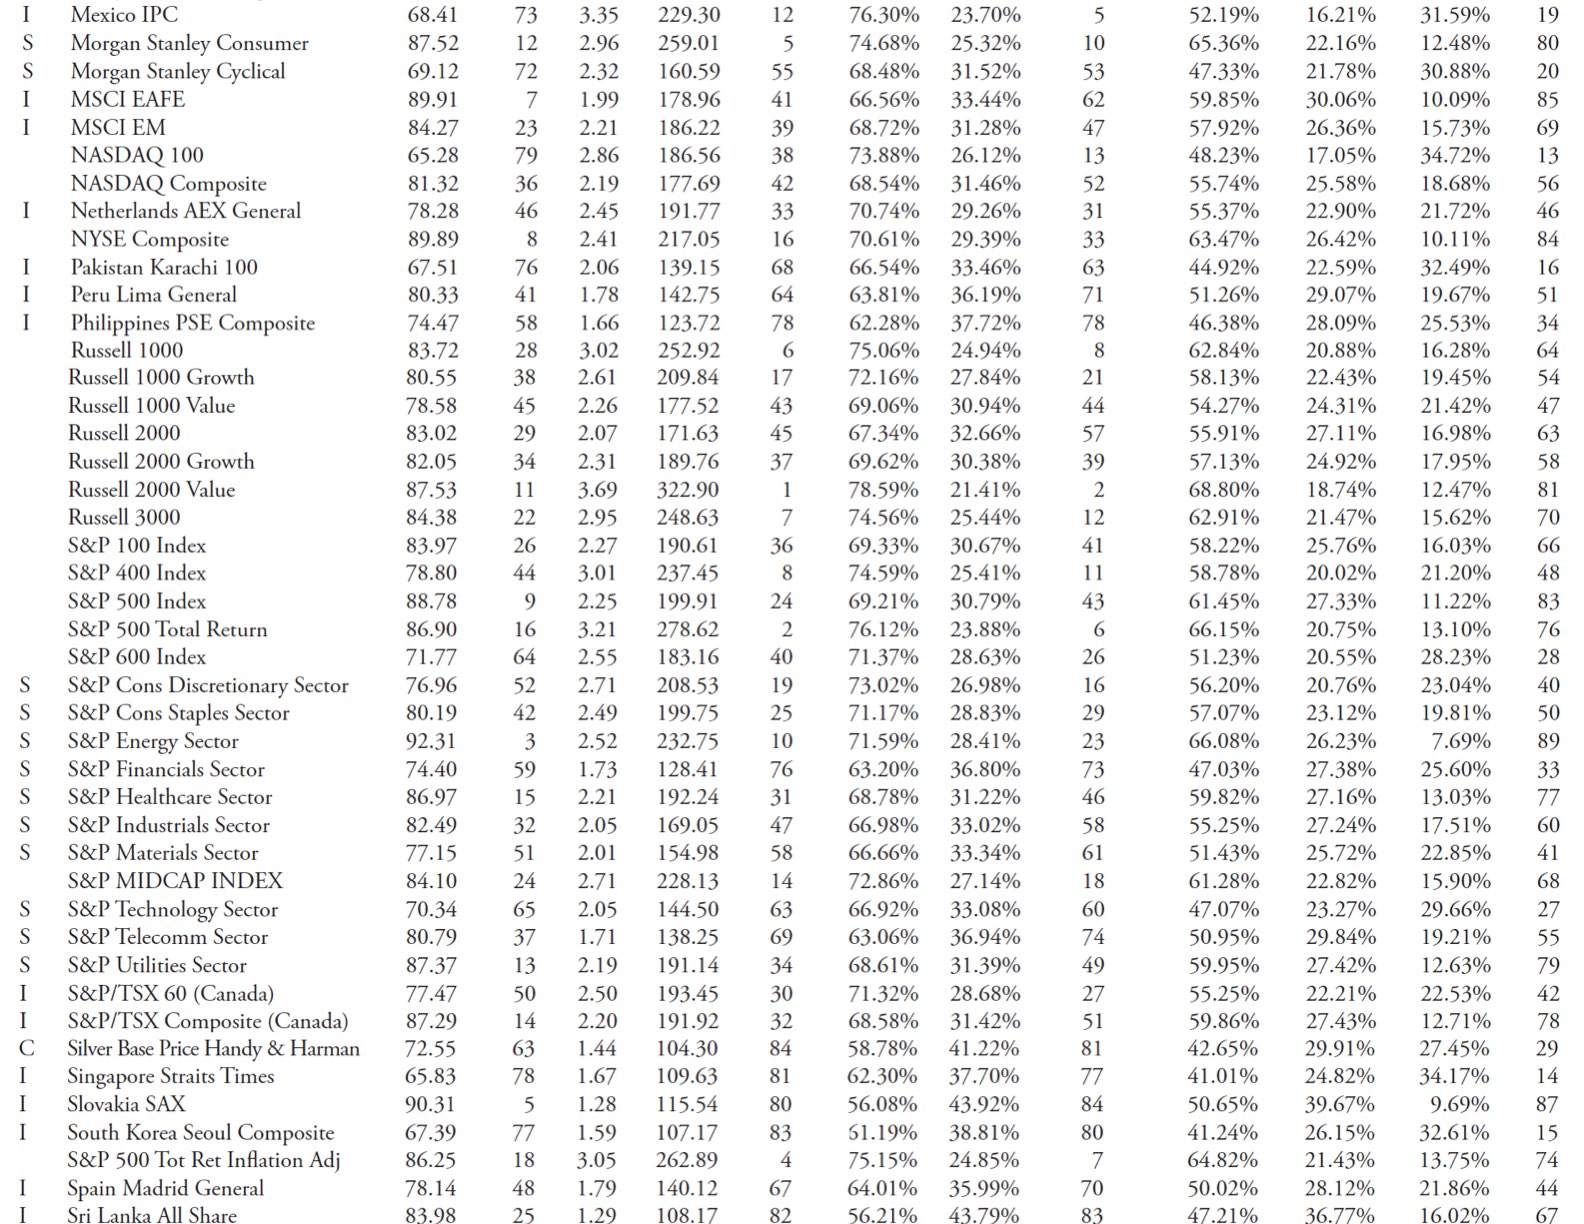
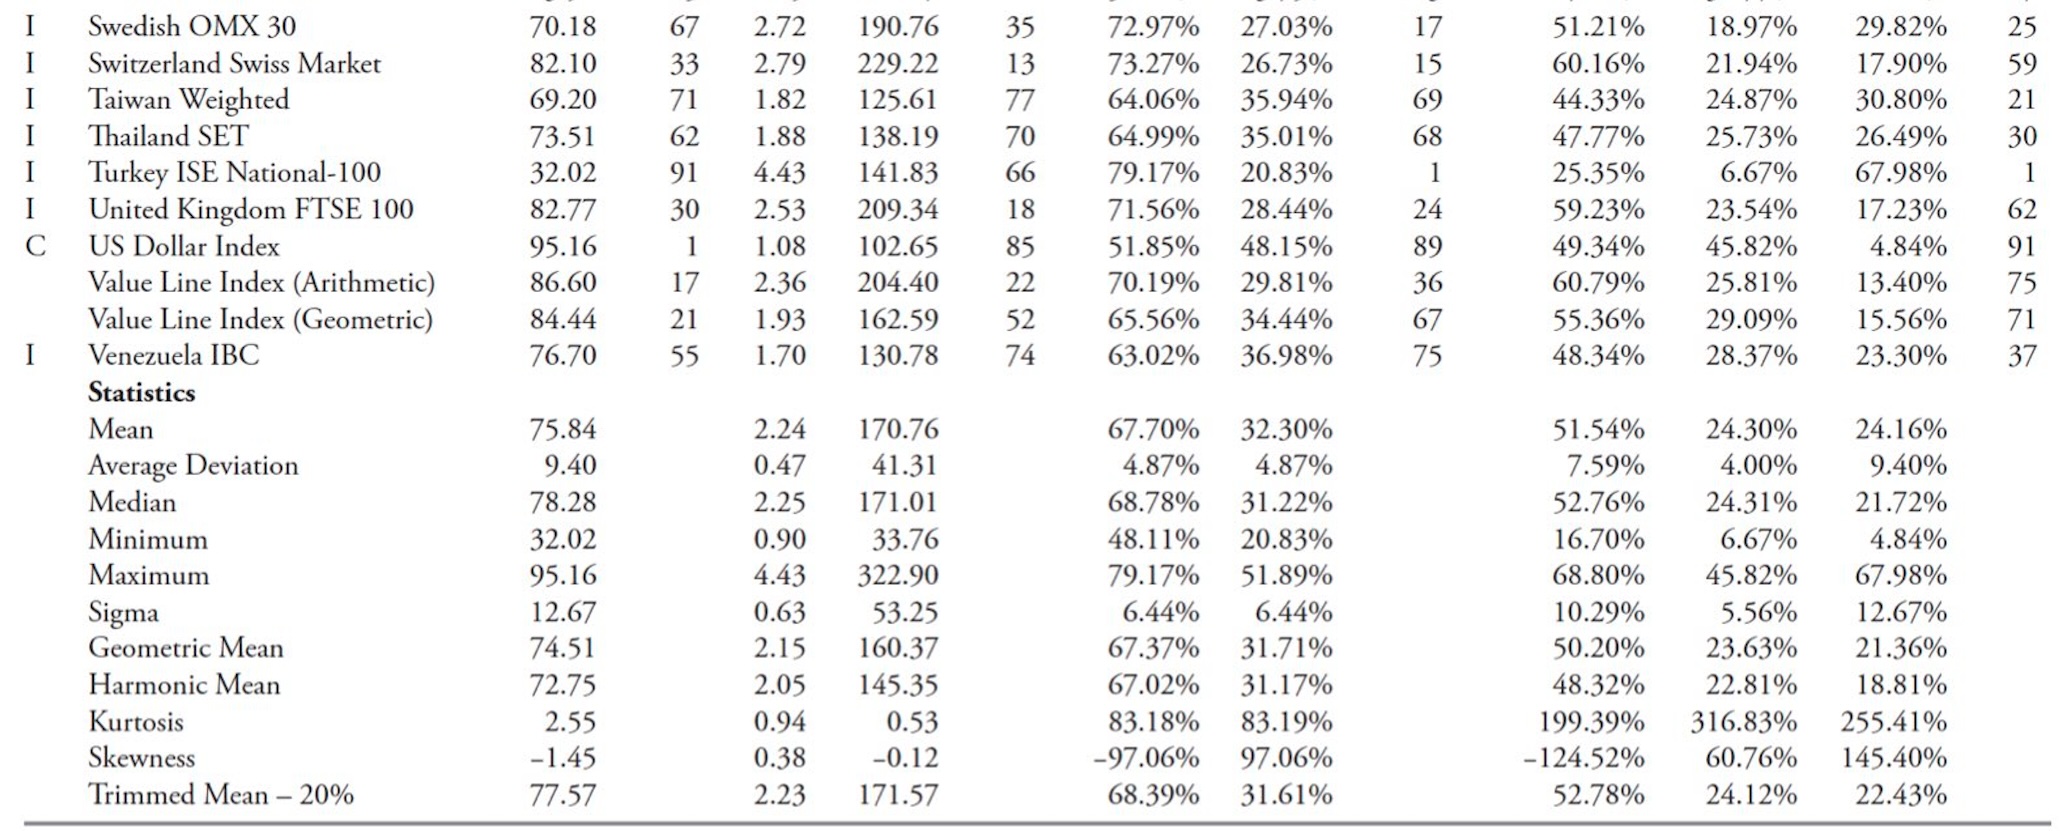
Table 10.18 includes all issues with data starting before 2000. This table contains more issues than the next two tables. Each table uses an earlier start date to increase the amount of data, reducing the number of issues.
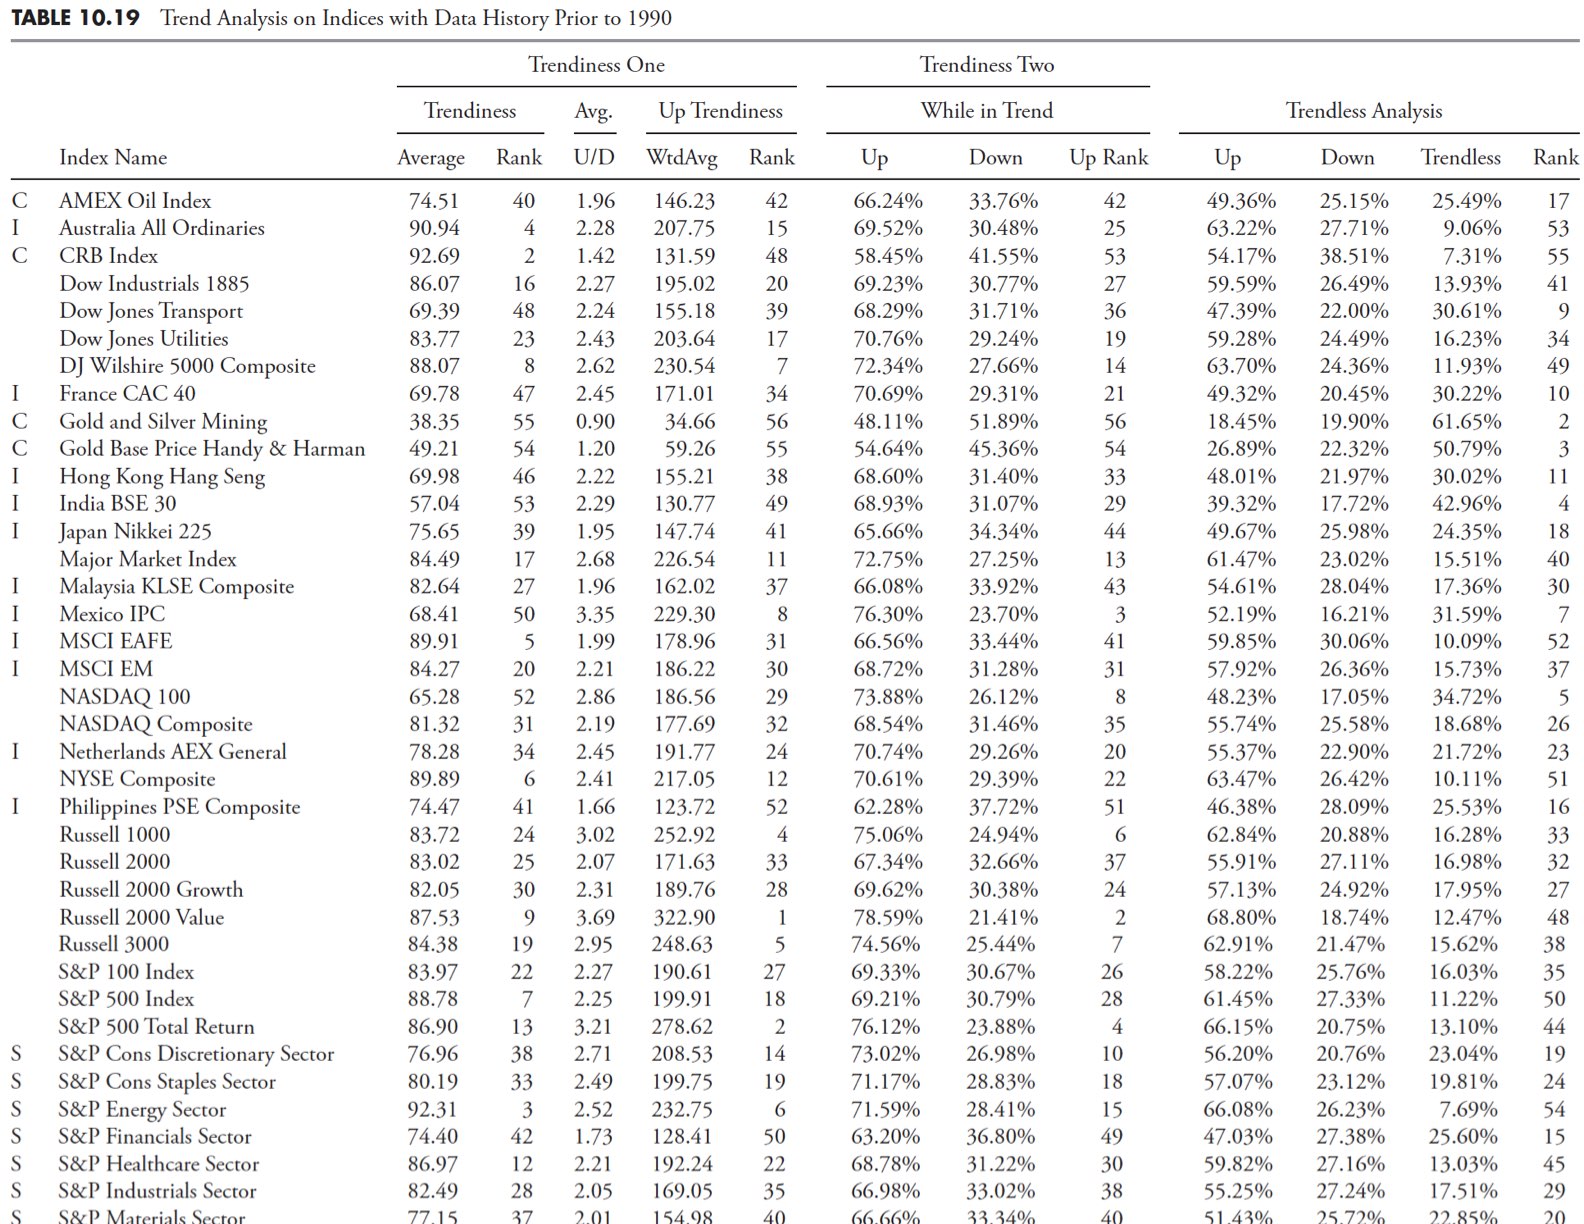
Data with history prior to 1990
Table 10.19 includes all issues for which we have data beginning before 1990.

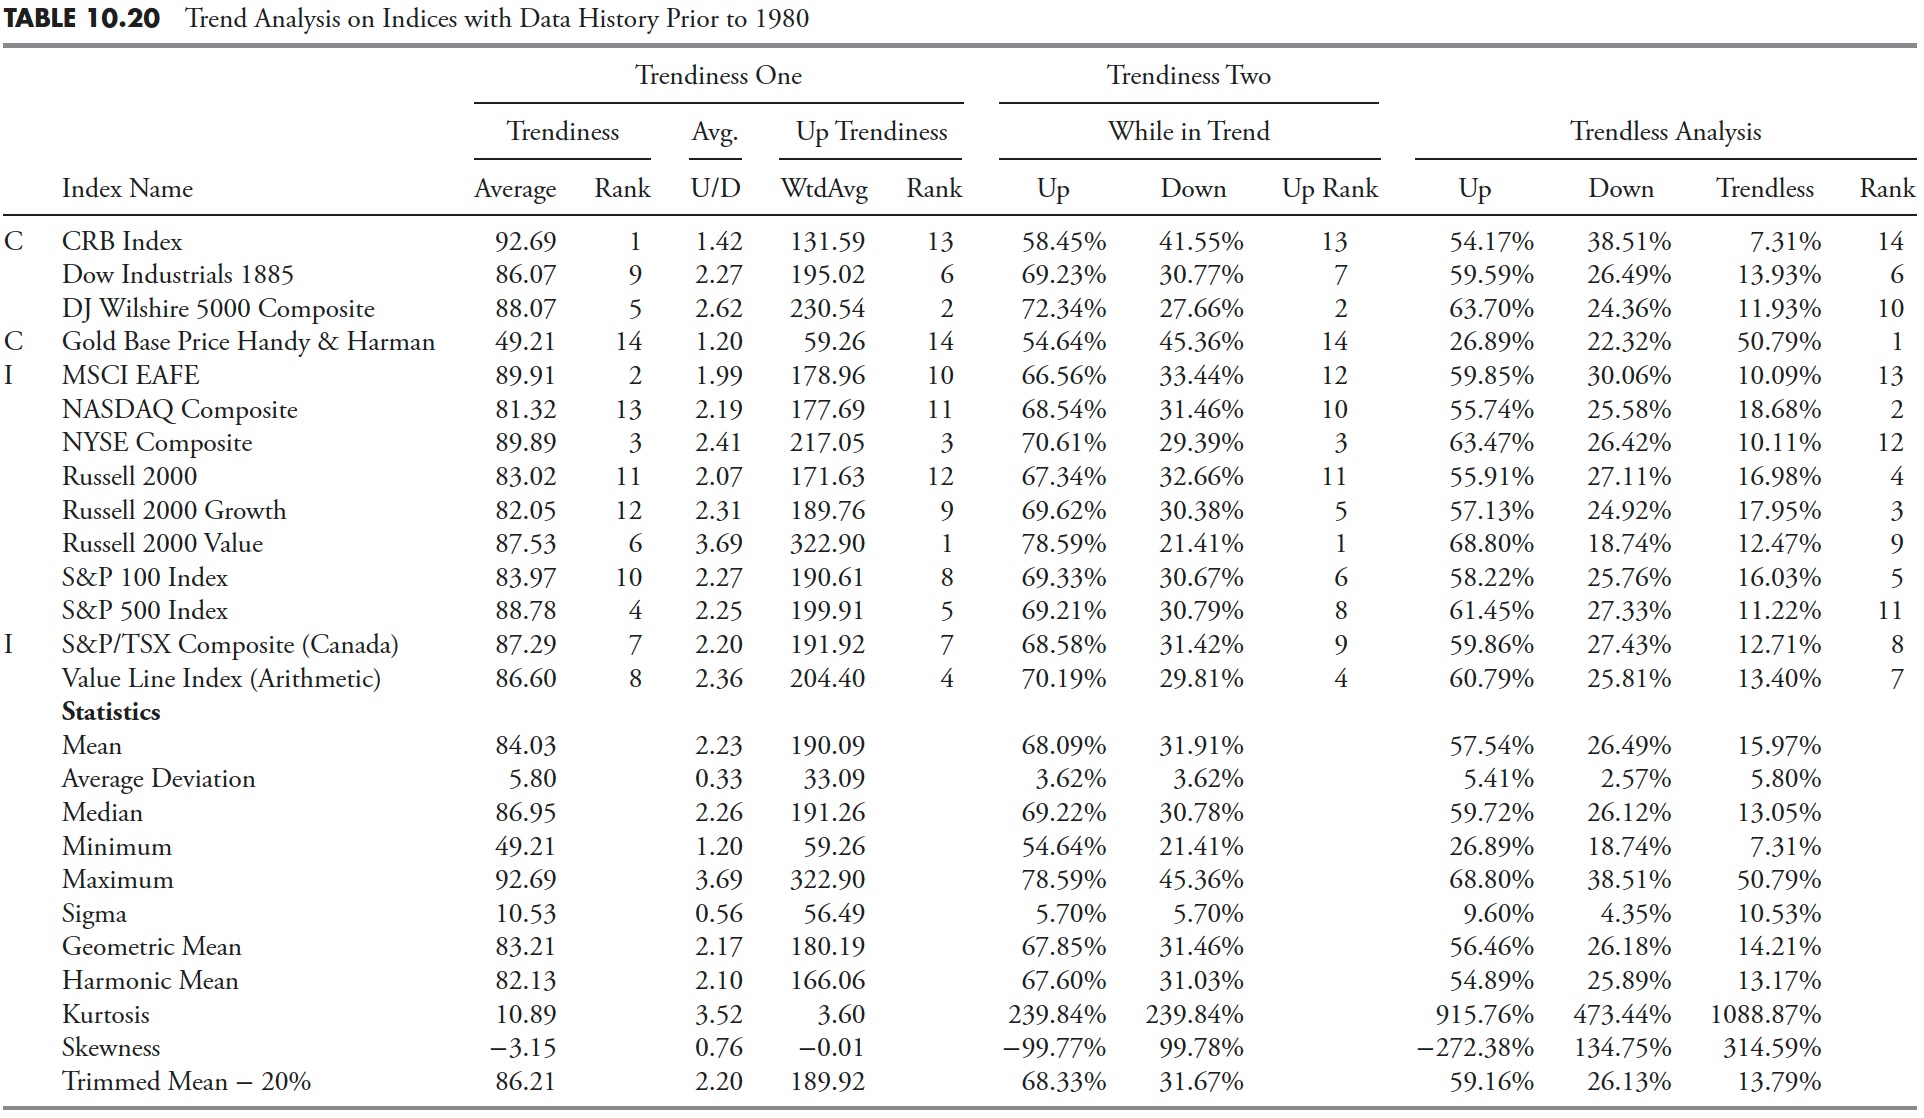
Data with history prior to 1980
Table 10.20 includes all issues with data beginning before 1980. This is the table with the longest data set and therefore has the fewest issues.
Trend analysis of S&P GICS data
Next, we will conduct a similar study on 95 S&P GICS sectors, industry groups, and industries. This is a different study in that the parameters that determine a trending market have been significantly expanded. The number of days for trend determination is tabulated from 15 to 65 days. The percentage of filtered waves was also expanded from 5% to 11%. All analyzes included in the previous sections were conducted for these 95 sectors and industry groups.
The Global Industry Classification Standard (GICS) is an industry classification developed by MSCI and Standard & Poor’s (S&P) for use by the global financial community. The GICS structure consists of 10 sectors, 24 industry groups, 68 industries, and 154 sub-industries into which S&P classifies all major public companies. This system is similar to the Industry Classification Benchmark (ICB), a classification structure maintained by Dow Jones Indexes and the FTSE Group.
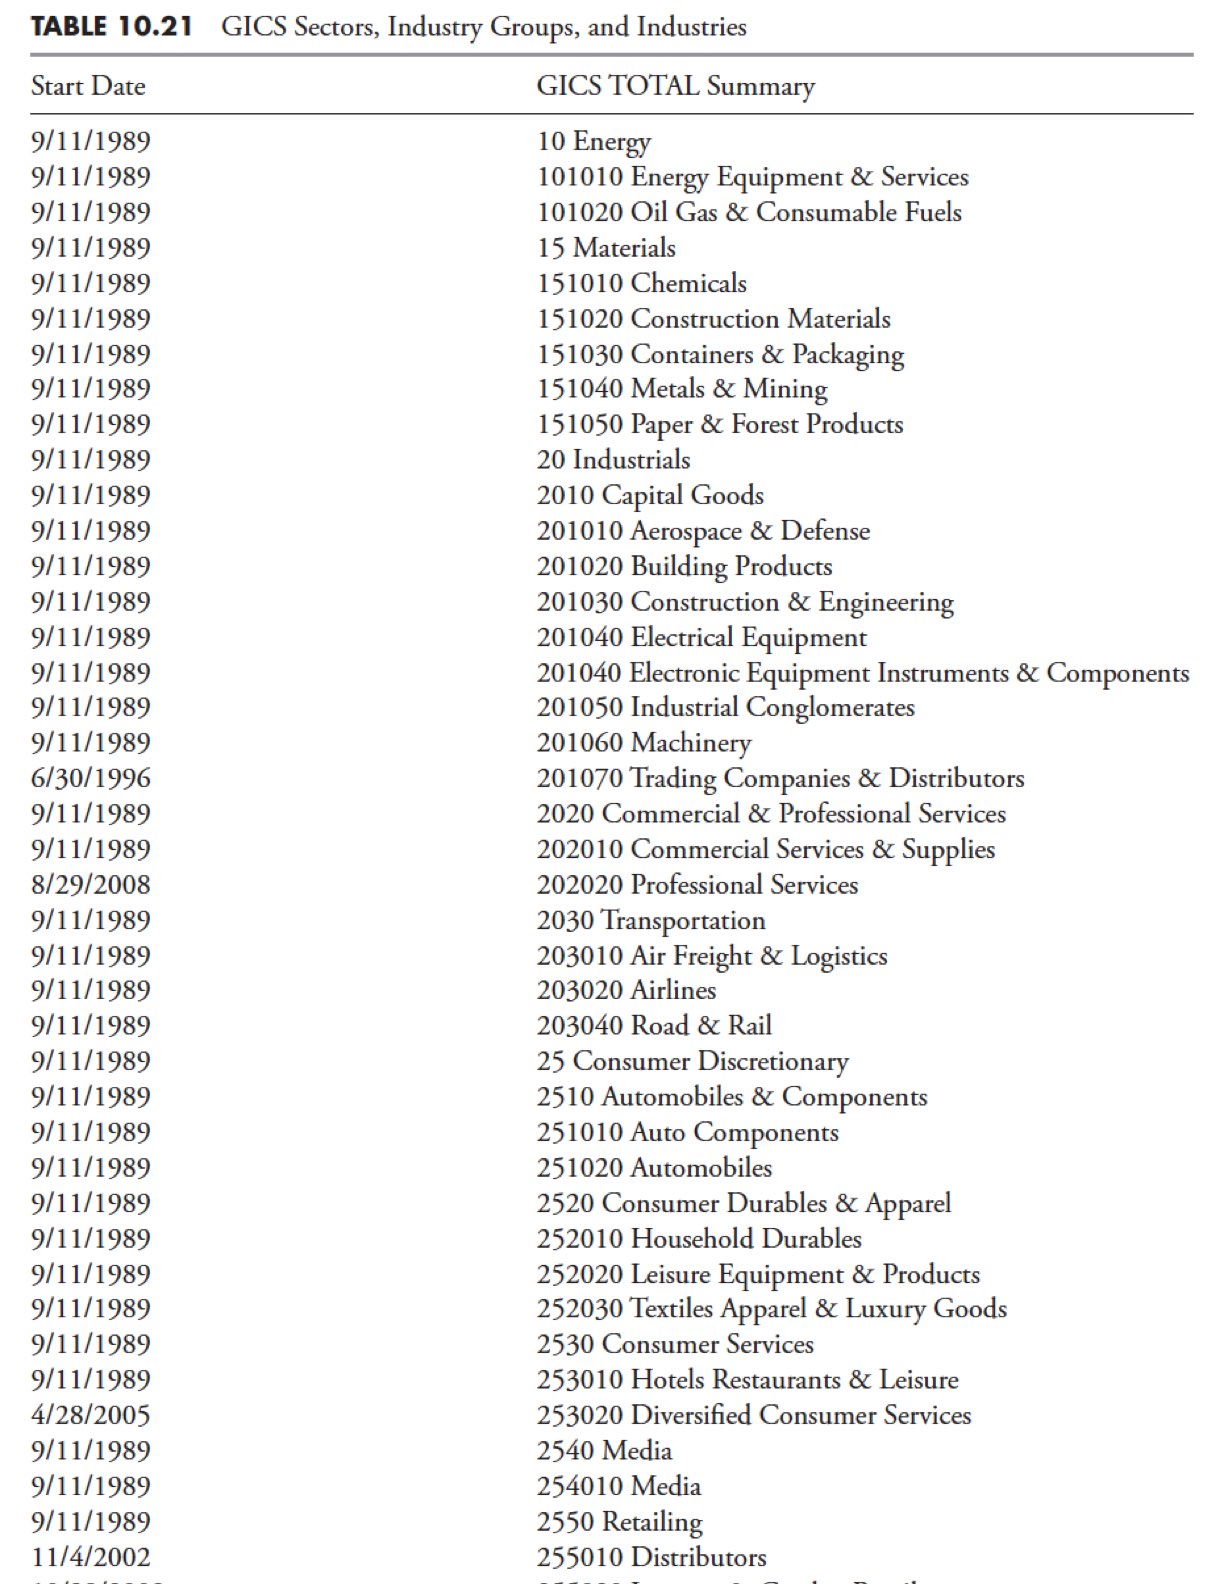
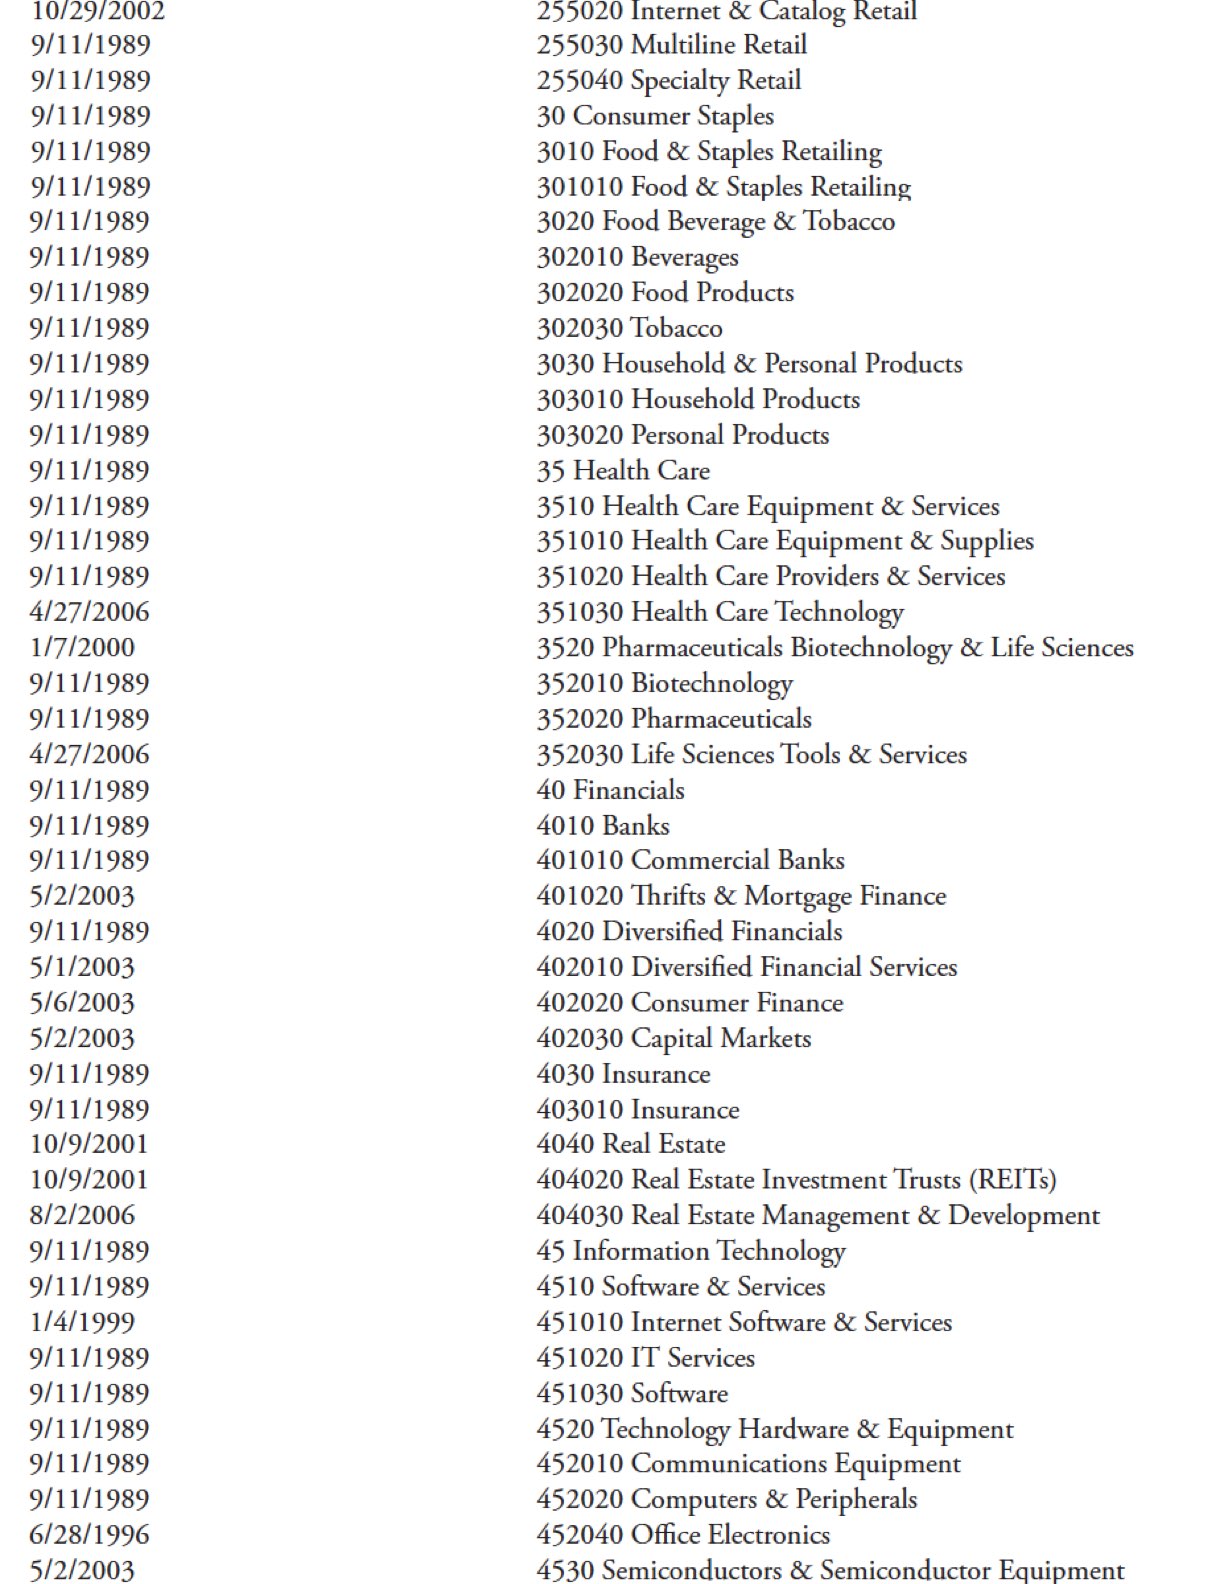
S&P Sectors, Industry Groups, Industries
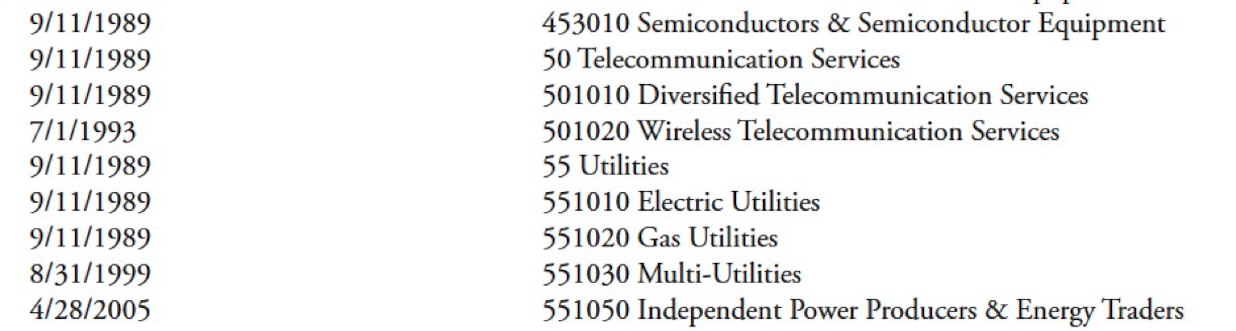
The numeric identification is exactly the same as what Standard & Poor’s uses in its GICS classification method. Most, but not all, GICS databases date from 1989. In fact, there were only 21 series that didn’t start in 1989. When looking at the following analysis, if the trend for a particular sector or industry is outside the average, you can cross-reference this table and then check the starting date. There is not enough data for good analysis. Table 10.21 shows all GICS data and their respective start dates.
GICS Executive Summary
Table 10.22 demonstrates the robustness of the analysis. There is too much data to fit into a table in a book, but it is presented here only as evidence (only some data is shown). For the remainder of this analysis, the raw data is removed and only the average rank and relative rank are presented. A table showing the overall trend (up and down) for all raw data used in the analysis, with filtered waves ranging from 5% to 11% and trend lengths of 15 to 65 days. This table is presented to give you an idea of how much analysis is included here. This is followed by a summary table that is much easier to view.
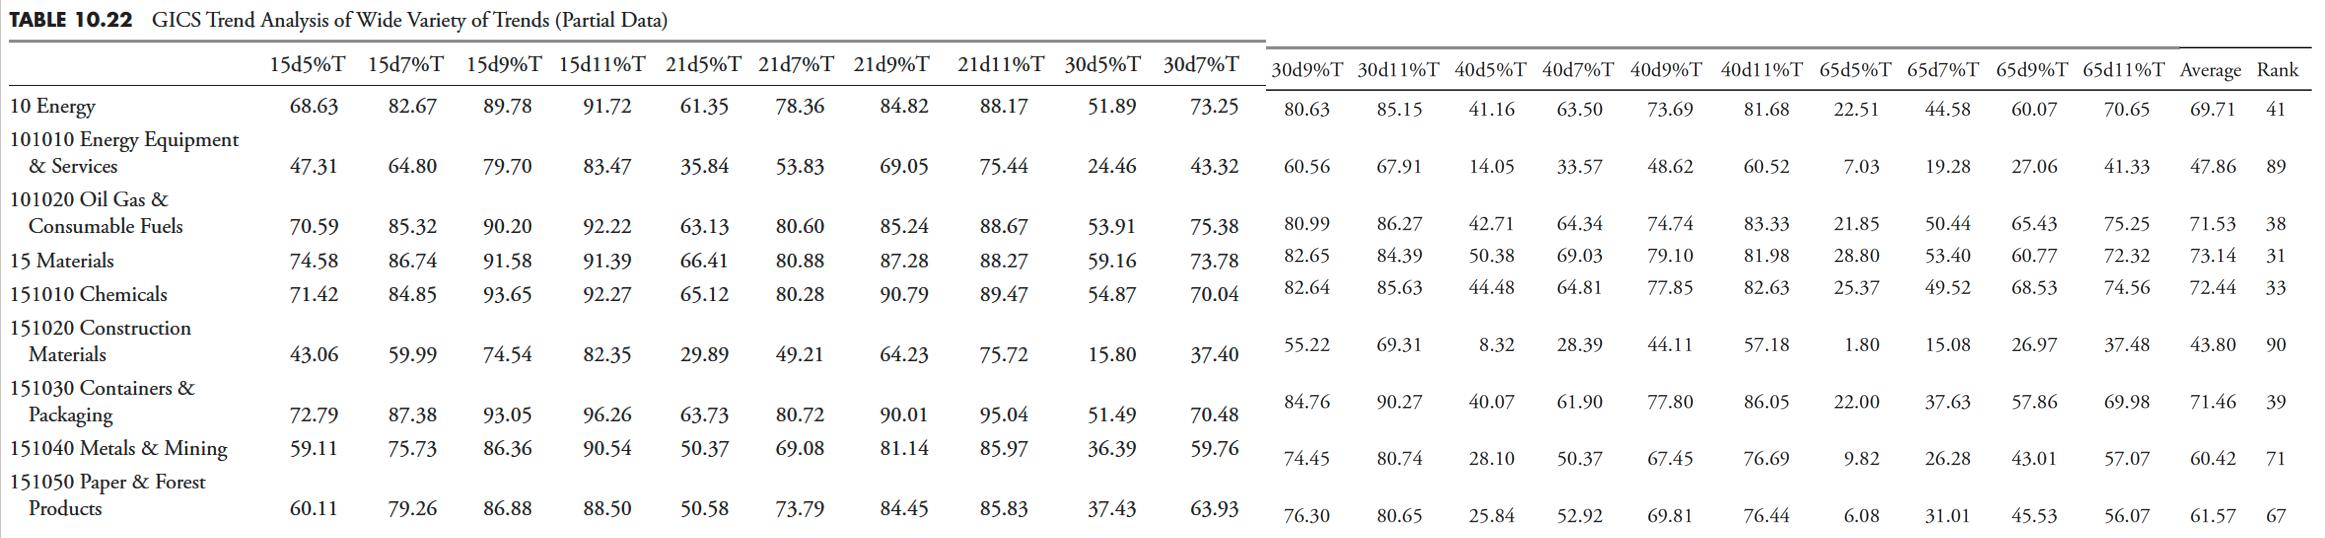
The GICS summary table is shown below, but without the massive amount of raw data. There is only the classification name, the average of all raw calculations, and their respective relative ranks. The following table uses the same analysis performed previously for the 109 indices.
GICS Summary
Table 10.23 contains all the averages from the various filtered waves and trend day analyzes categorized by overall trend, uptrend, downtrend, and maximum downtrend percentage. You will notice that there is missing data in the U/D Ratio column. This is due to a few different things.
- There were several series where the data records were not long enough.
- If you mix filtered small wave and long trend forecasts, you will notice that some series have an uptrend, a downtrend, or neither. Division will not work properly if you use 0 in the numerator or denominator.
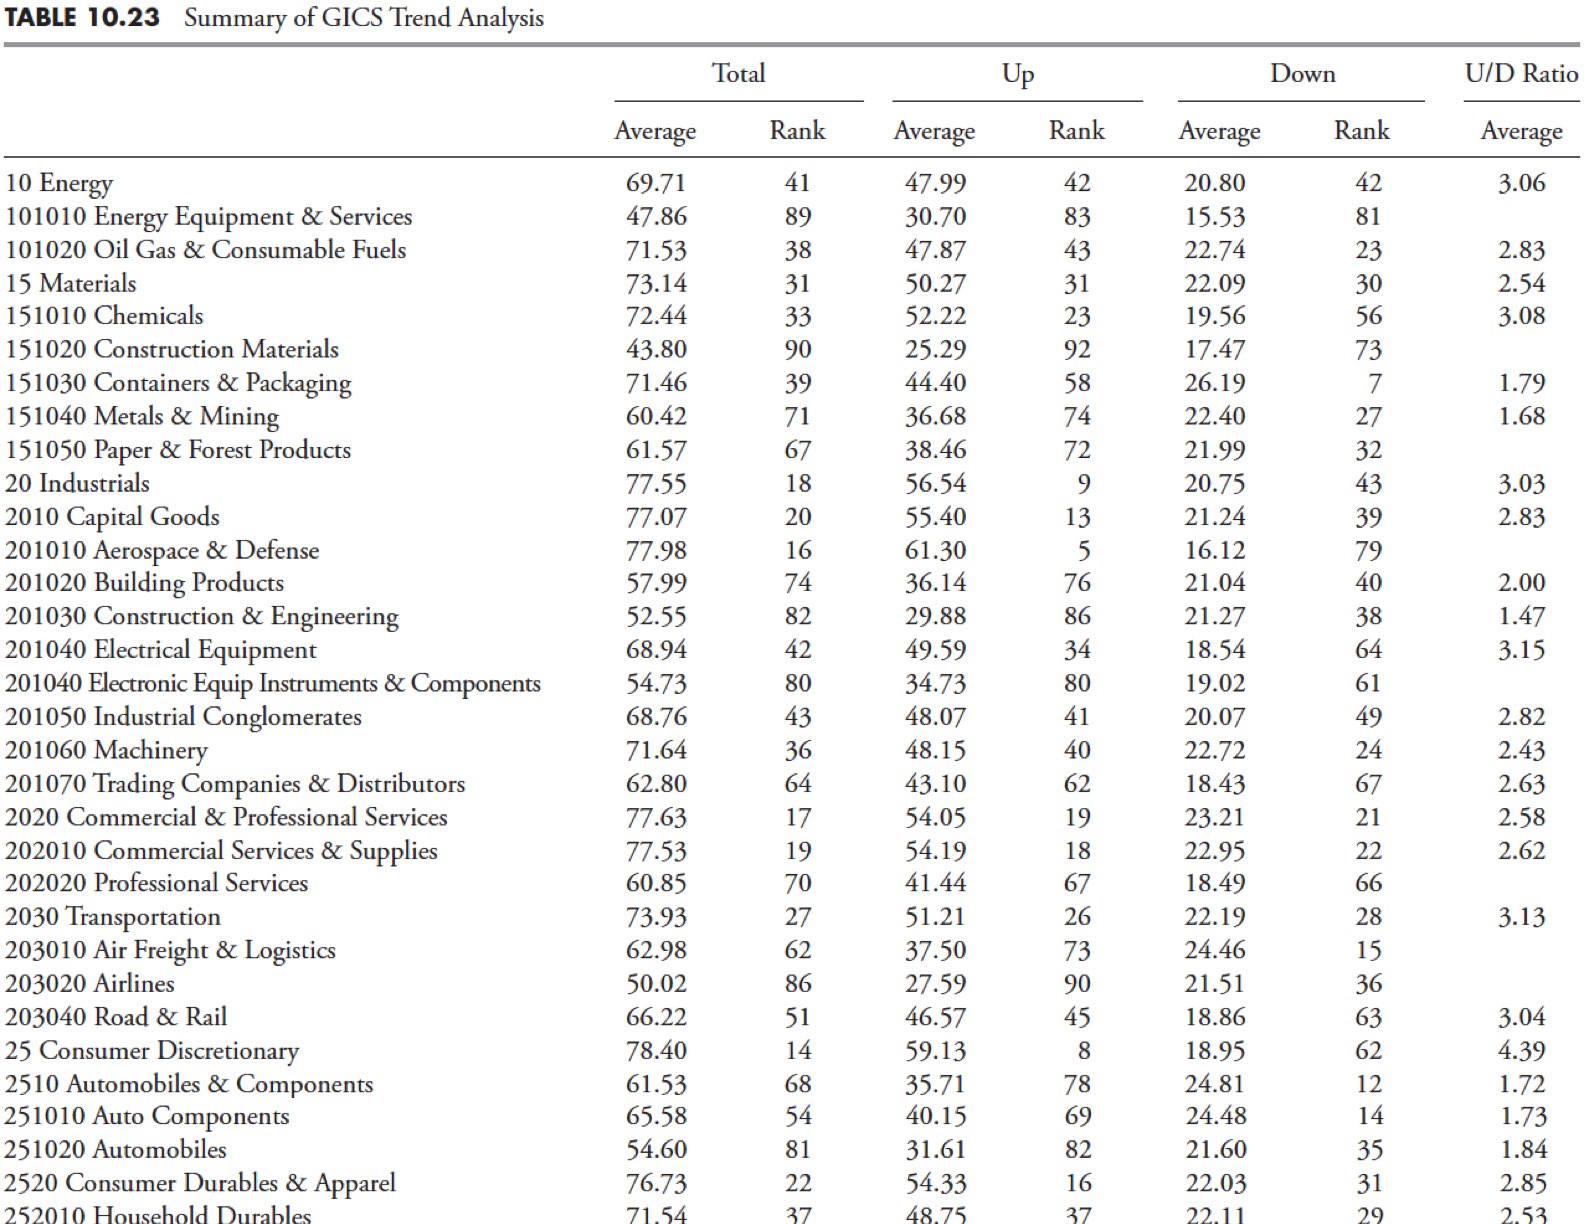
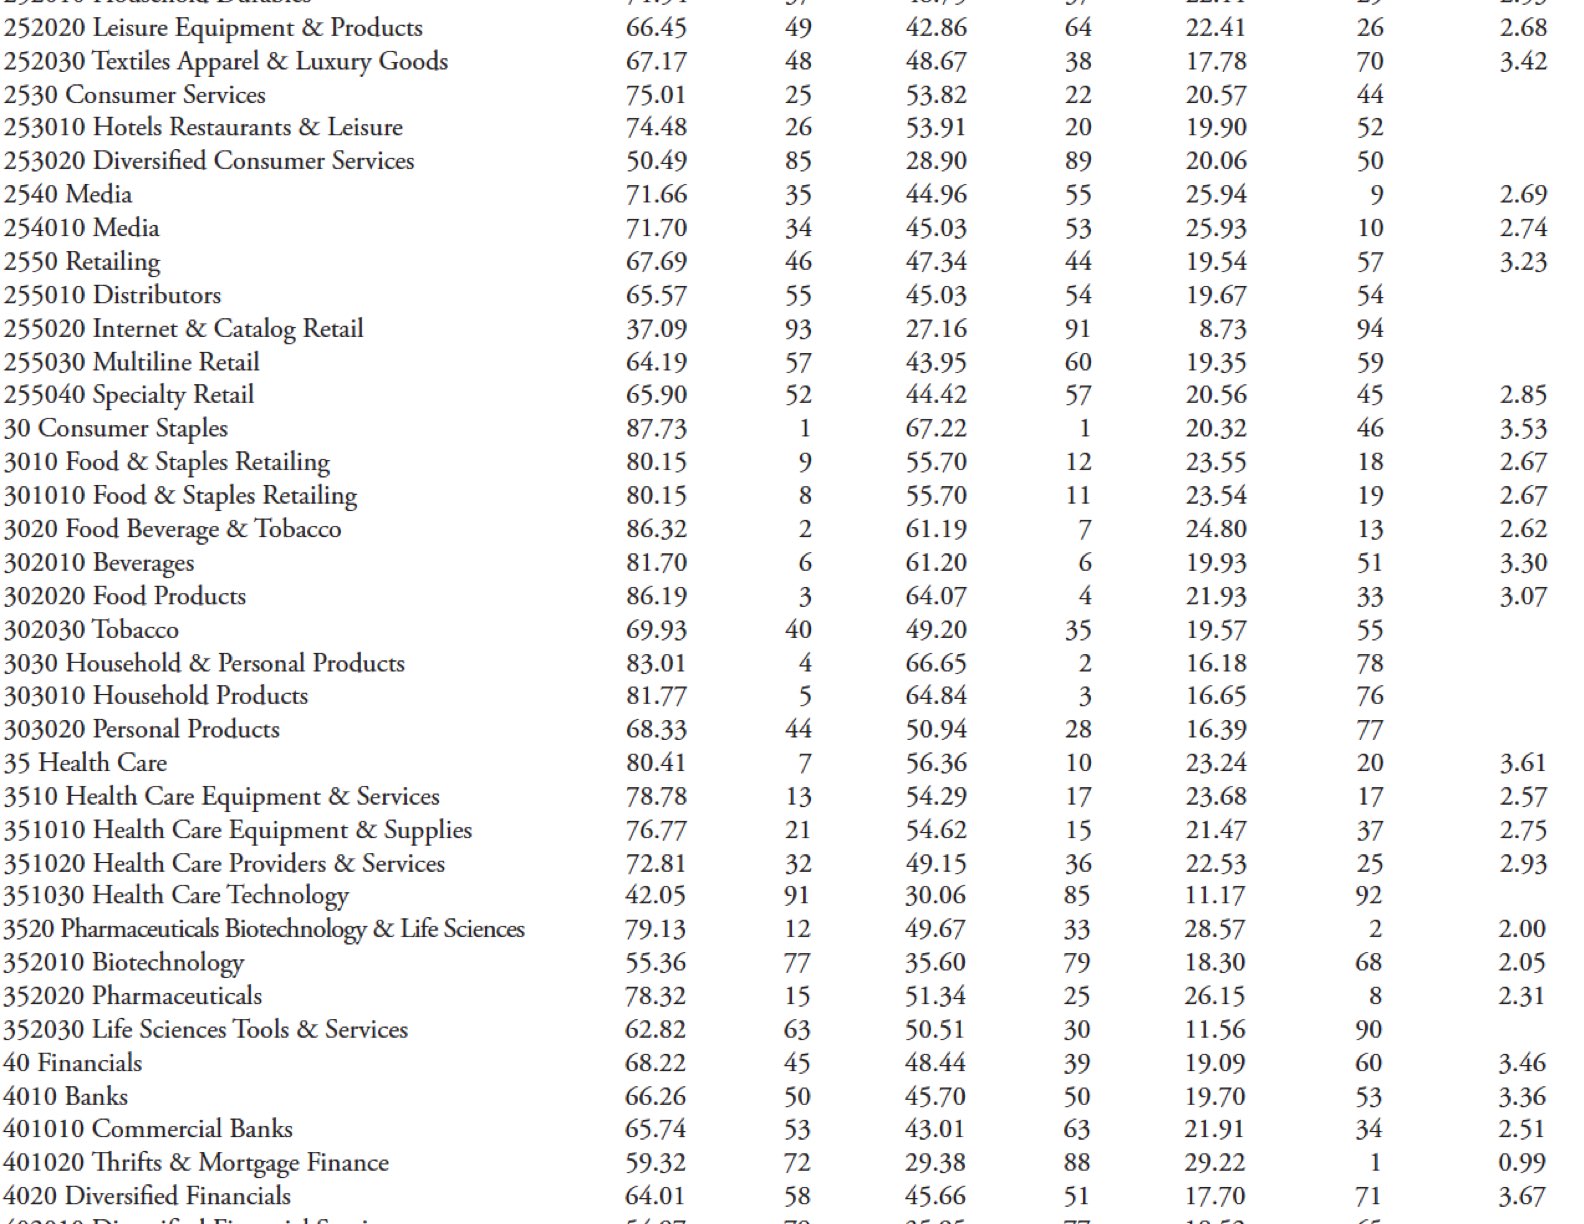
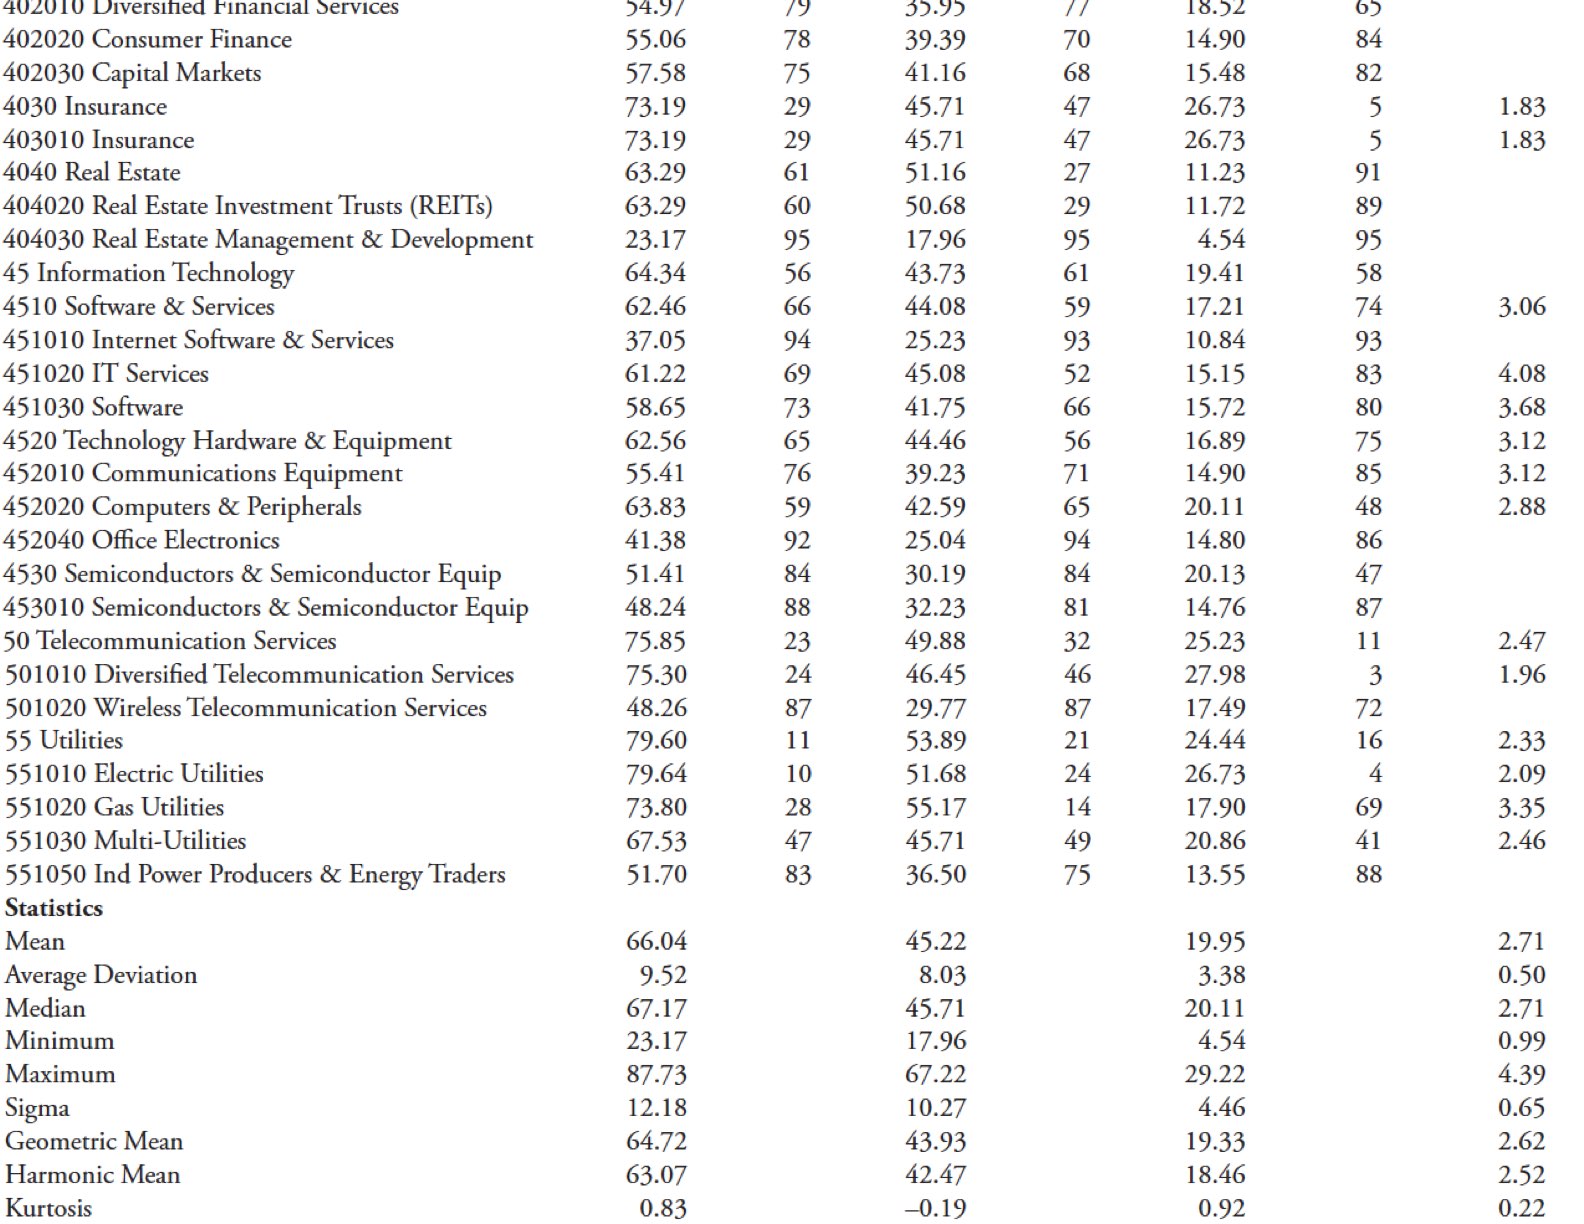

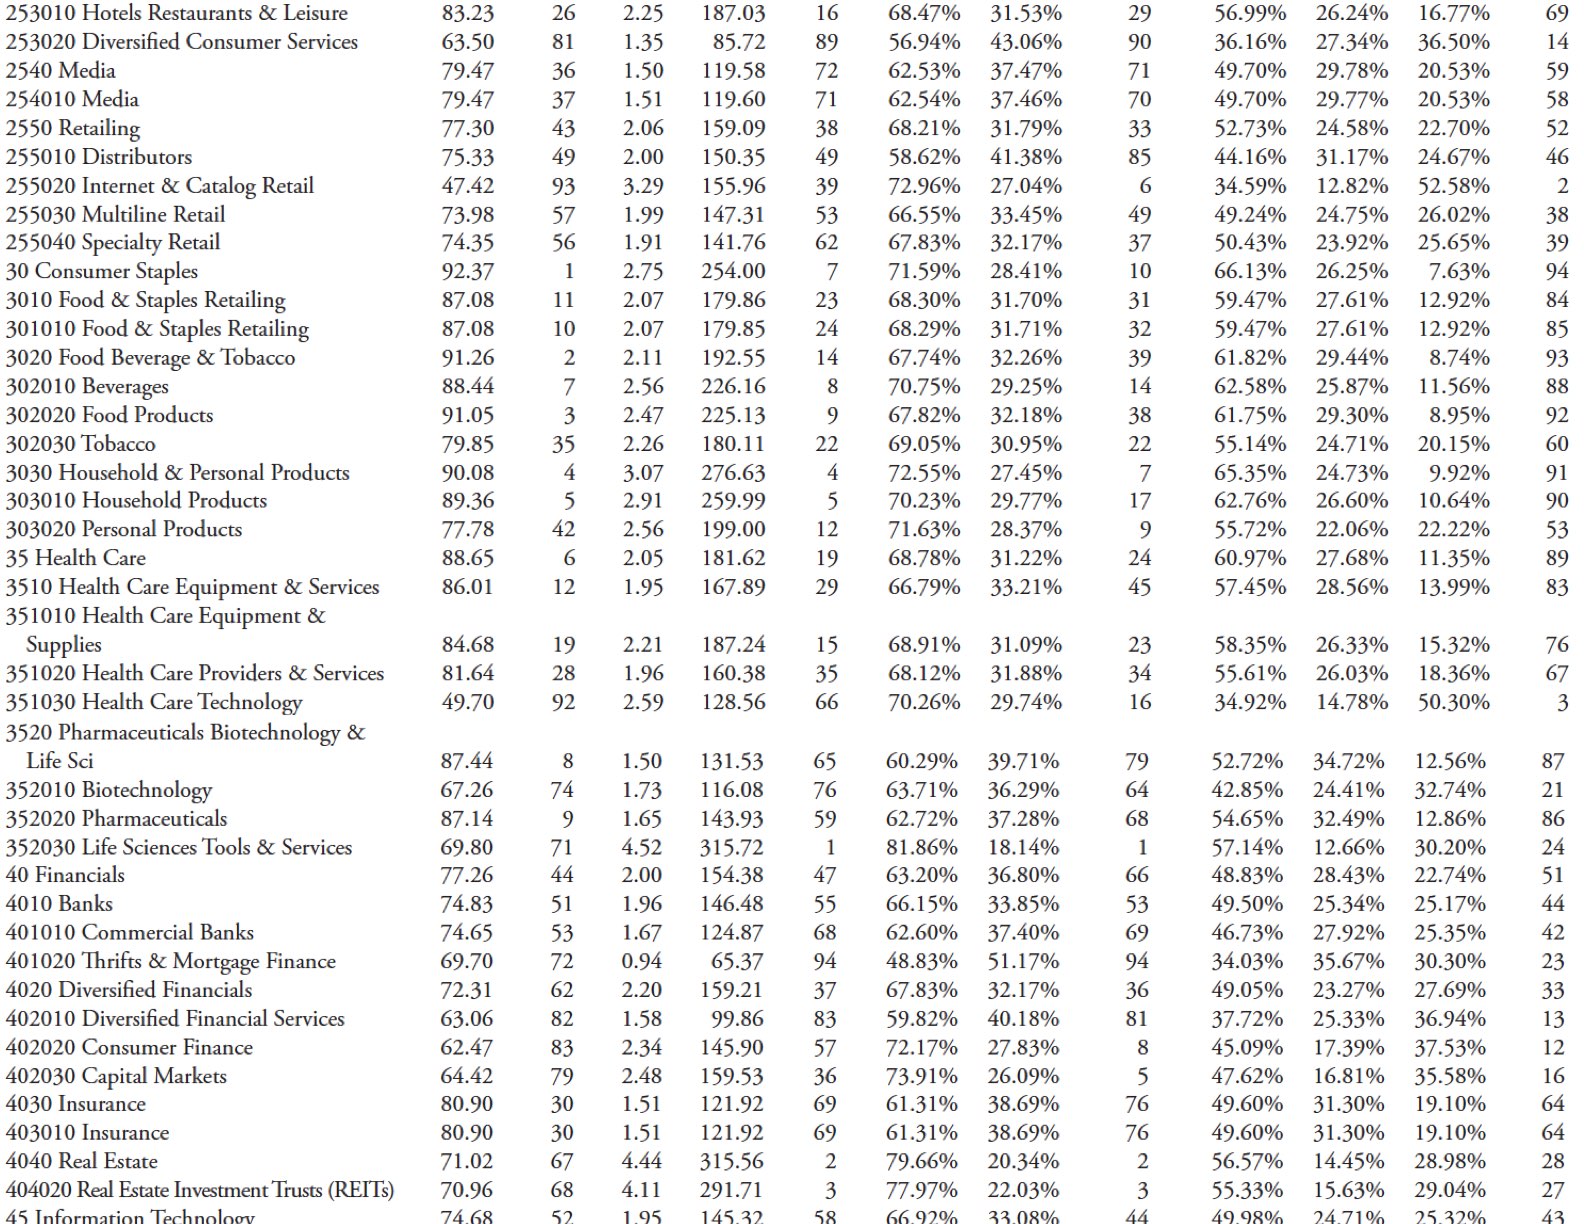
If you look at the full GICS issues table above, you can see that issues with numeric codes starting with the number 3 all rank highly in the overall trends. I think this is a poor analysis, but let’s see what’s out there.
Ah, yes. They are all part of essential consumer goods or medical products. Both of these sectors are generally defensive in nature and are generally less volatile. Refer to the table at the beginning of this section where there are 109 market indices, which also include 16 sectors or industries. Consumer Staples ranked third in the table using Trendiness One, while Healthcare ranked 14th. Remember, this is a relative ranking. However, the results confirm that Staples and Healthcare are good trending issues.
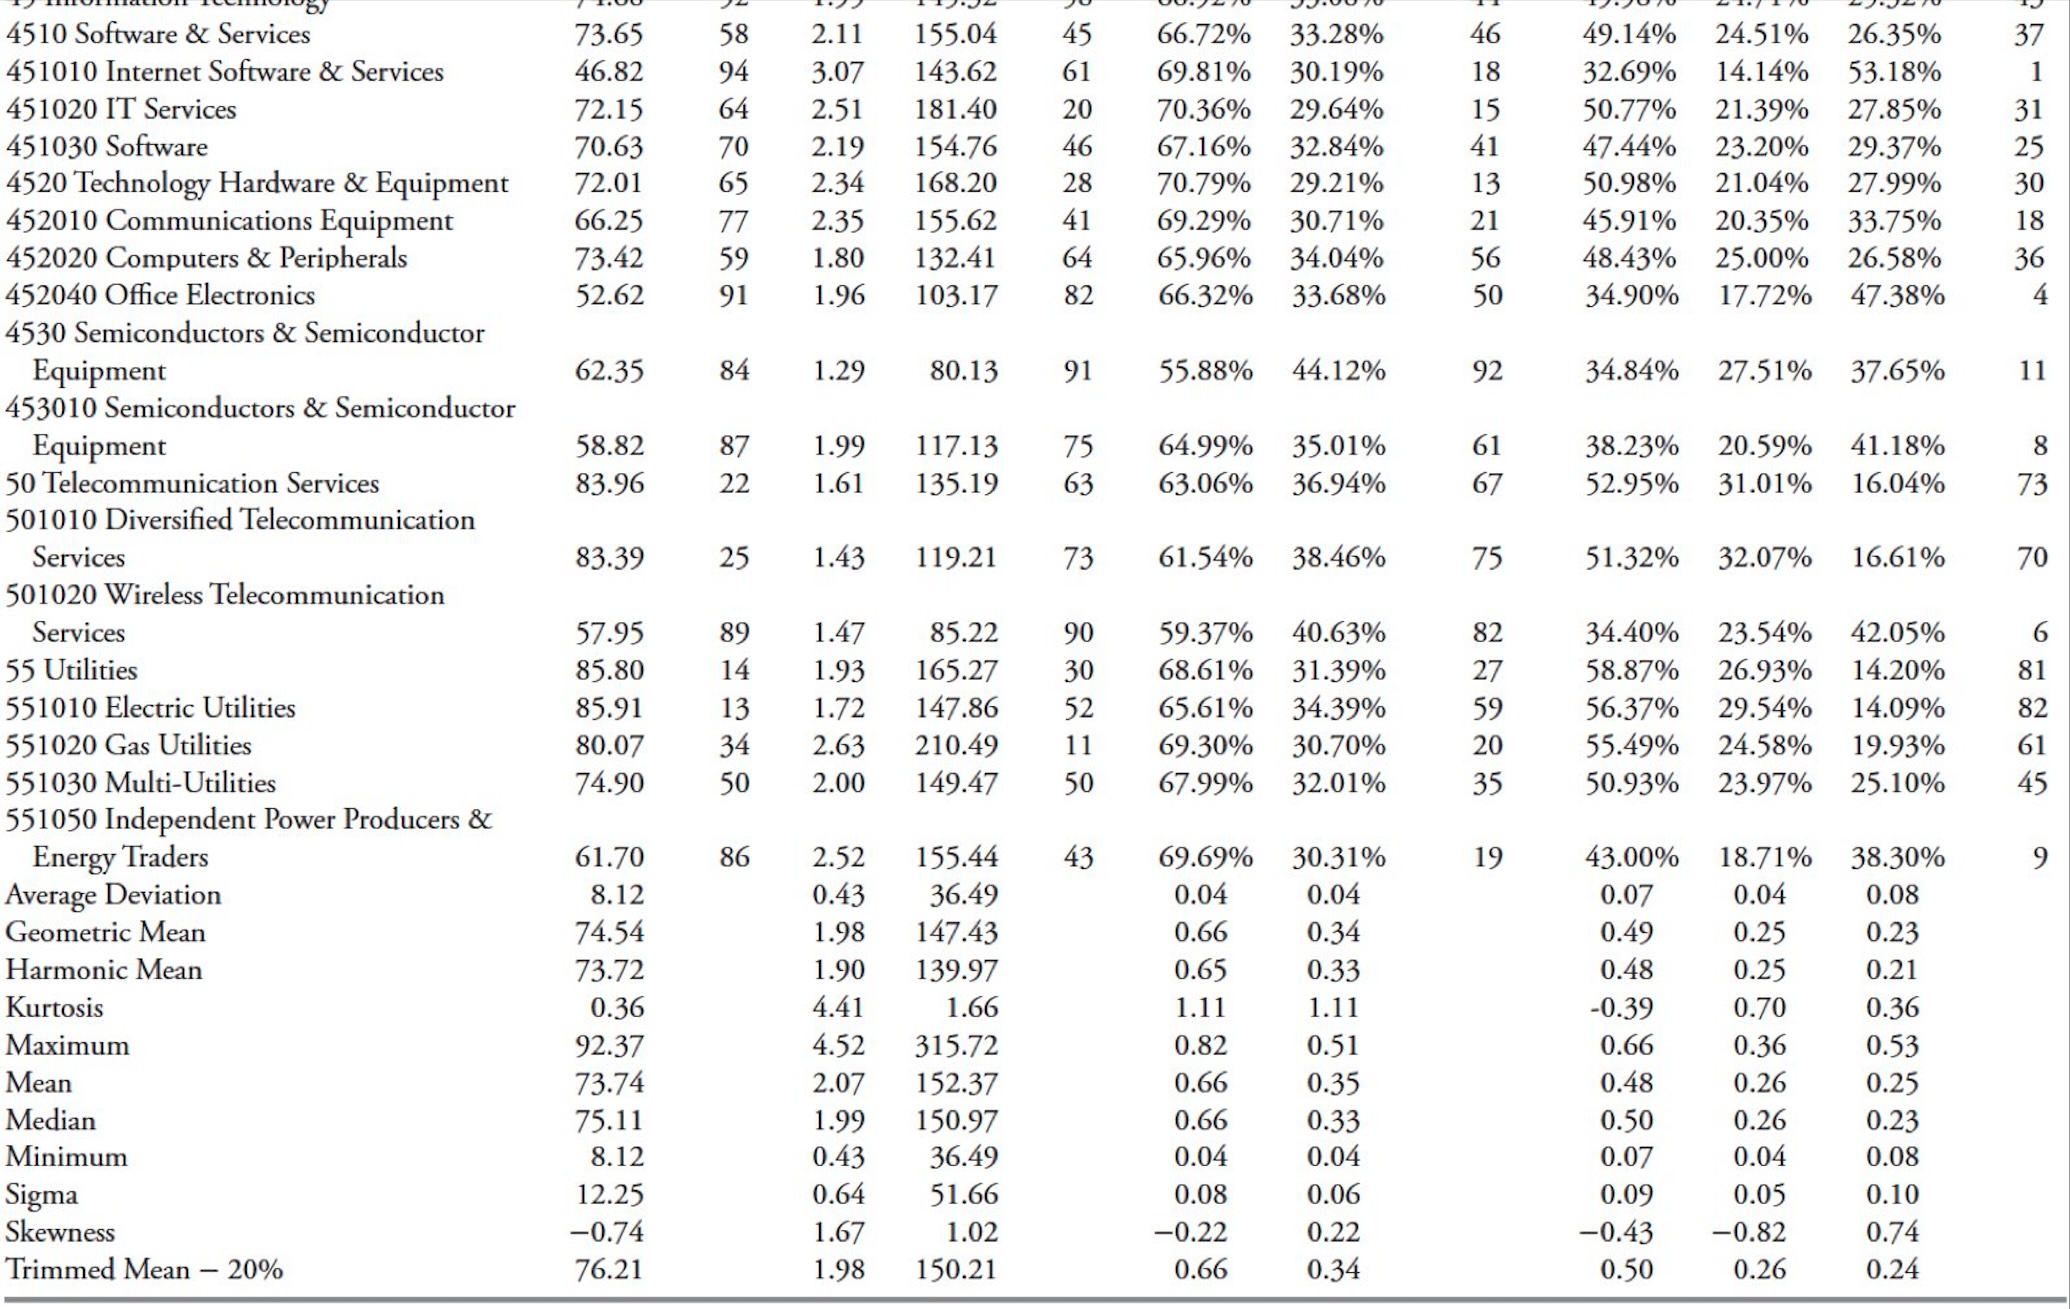
Does this also apply to other defense issues such as utilities and communications? The Utilities sector and Electric Utilities industry ranked 14th and 13th in overall trends. However, other utility industries do not rank as highly. The telecommunications sector ranks 23rd, the diversified telecommunications industry ranks 25th, and the wireless sector ranks 89th. It’s also important to note when doing this type of analysis that wireless data starts four years later than other sectors, but I digress.
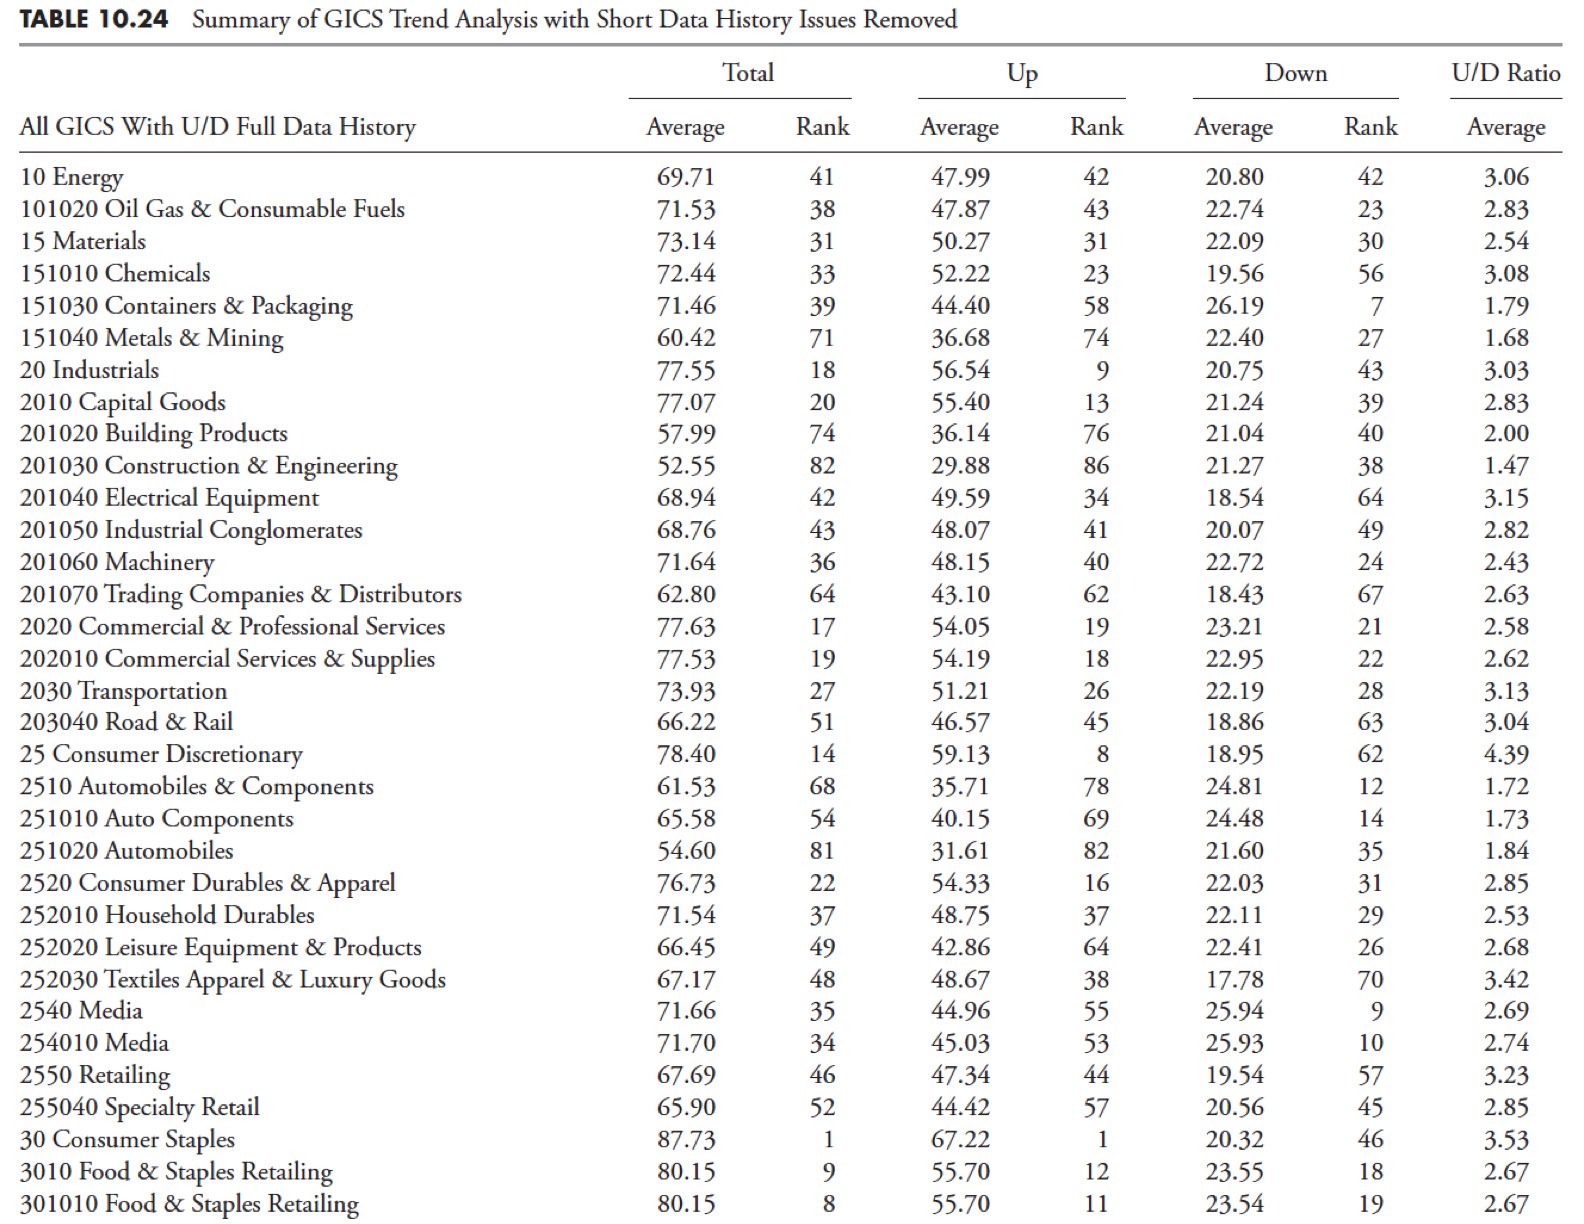
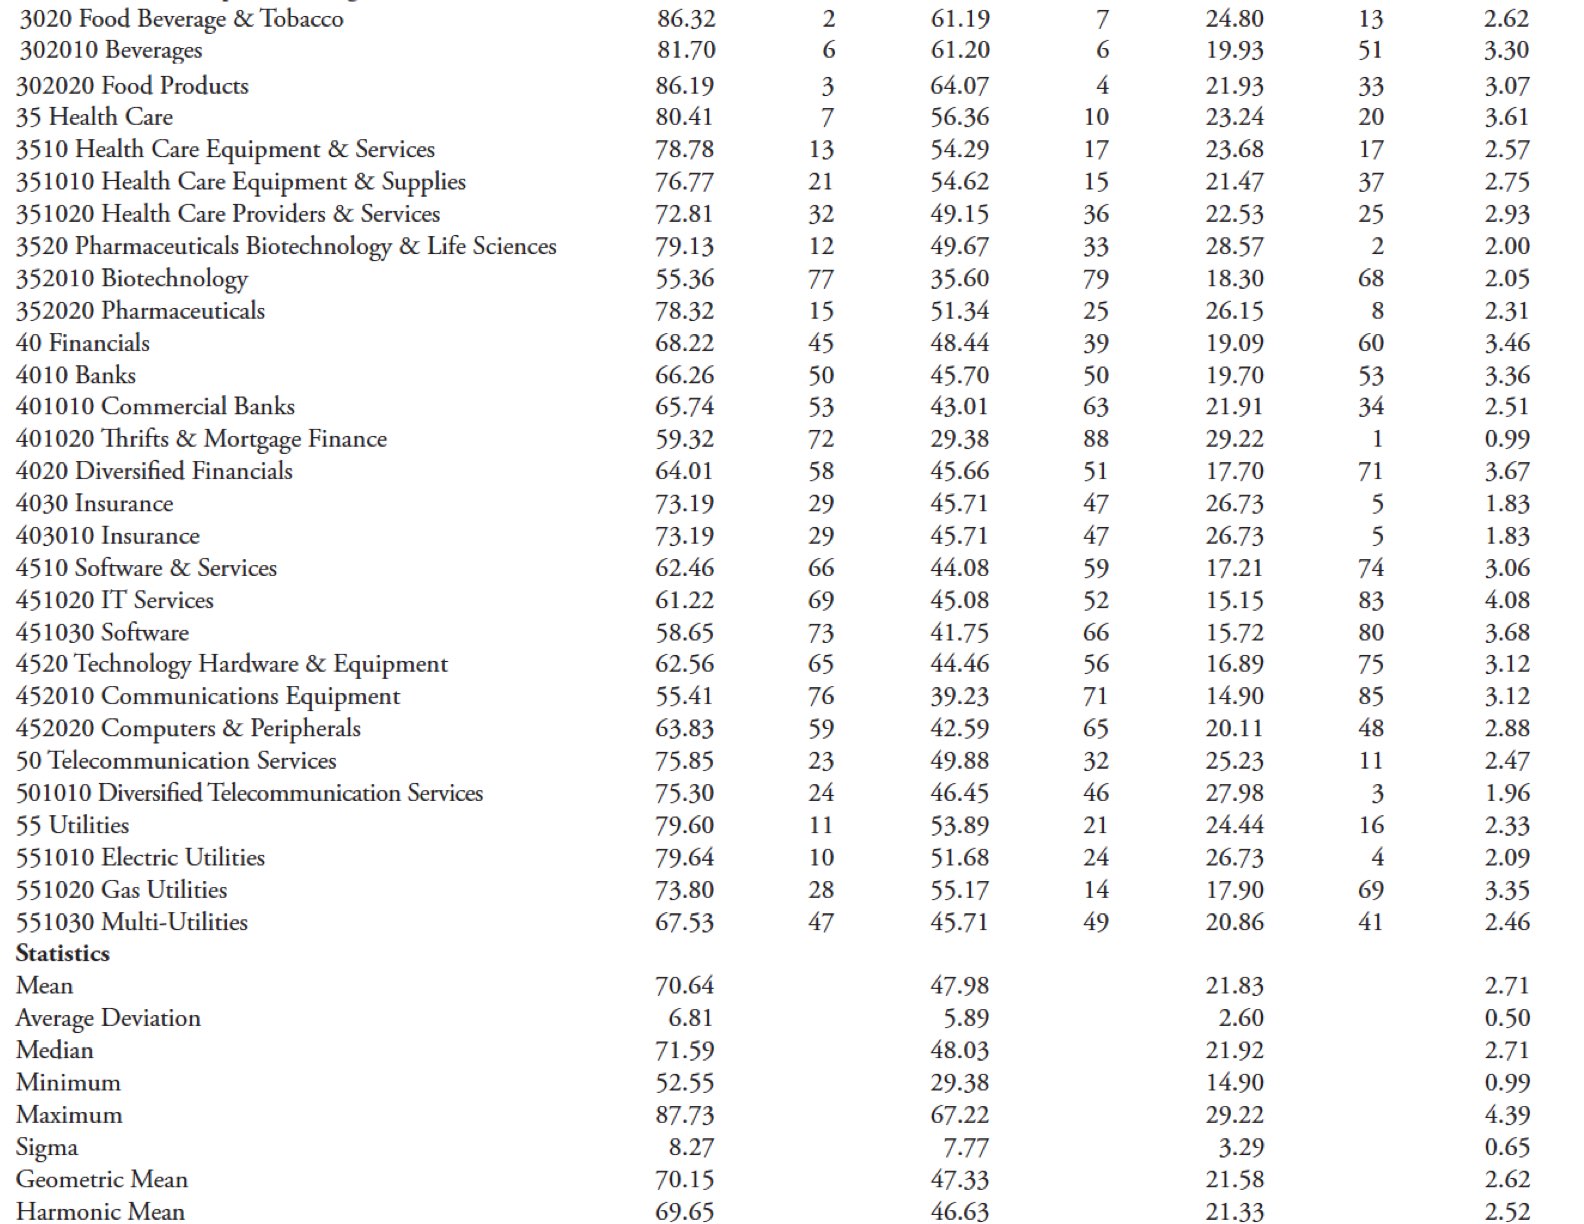
GICS Summary Table (inappropriate analysis periods removed)
Now let’s look at which GICS issues are unfavorable to the trend (Table 10.24). The top five are Internet Software & Services, Internet and Catalog Retail, Medical Technology, Office Electronics, and Building Materials. Since the industry is widely dispersed, let’s look at the data first. First, only 20 of the 95 GICS problems (21%) have less data than the majority, and they all date from 1989. Four of the sluggish trend issues fall into this category. Construction materials alone began in 1989. Because this analysis measures relative trends, you need to go to each individual issue and chart it as we did in the previous section.

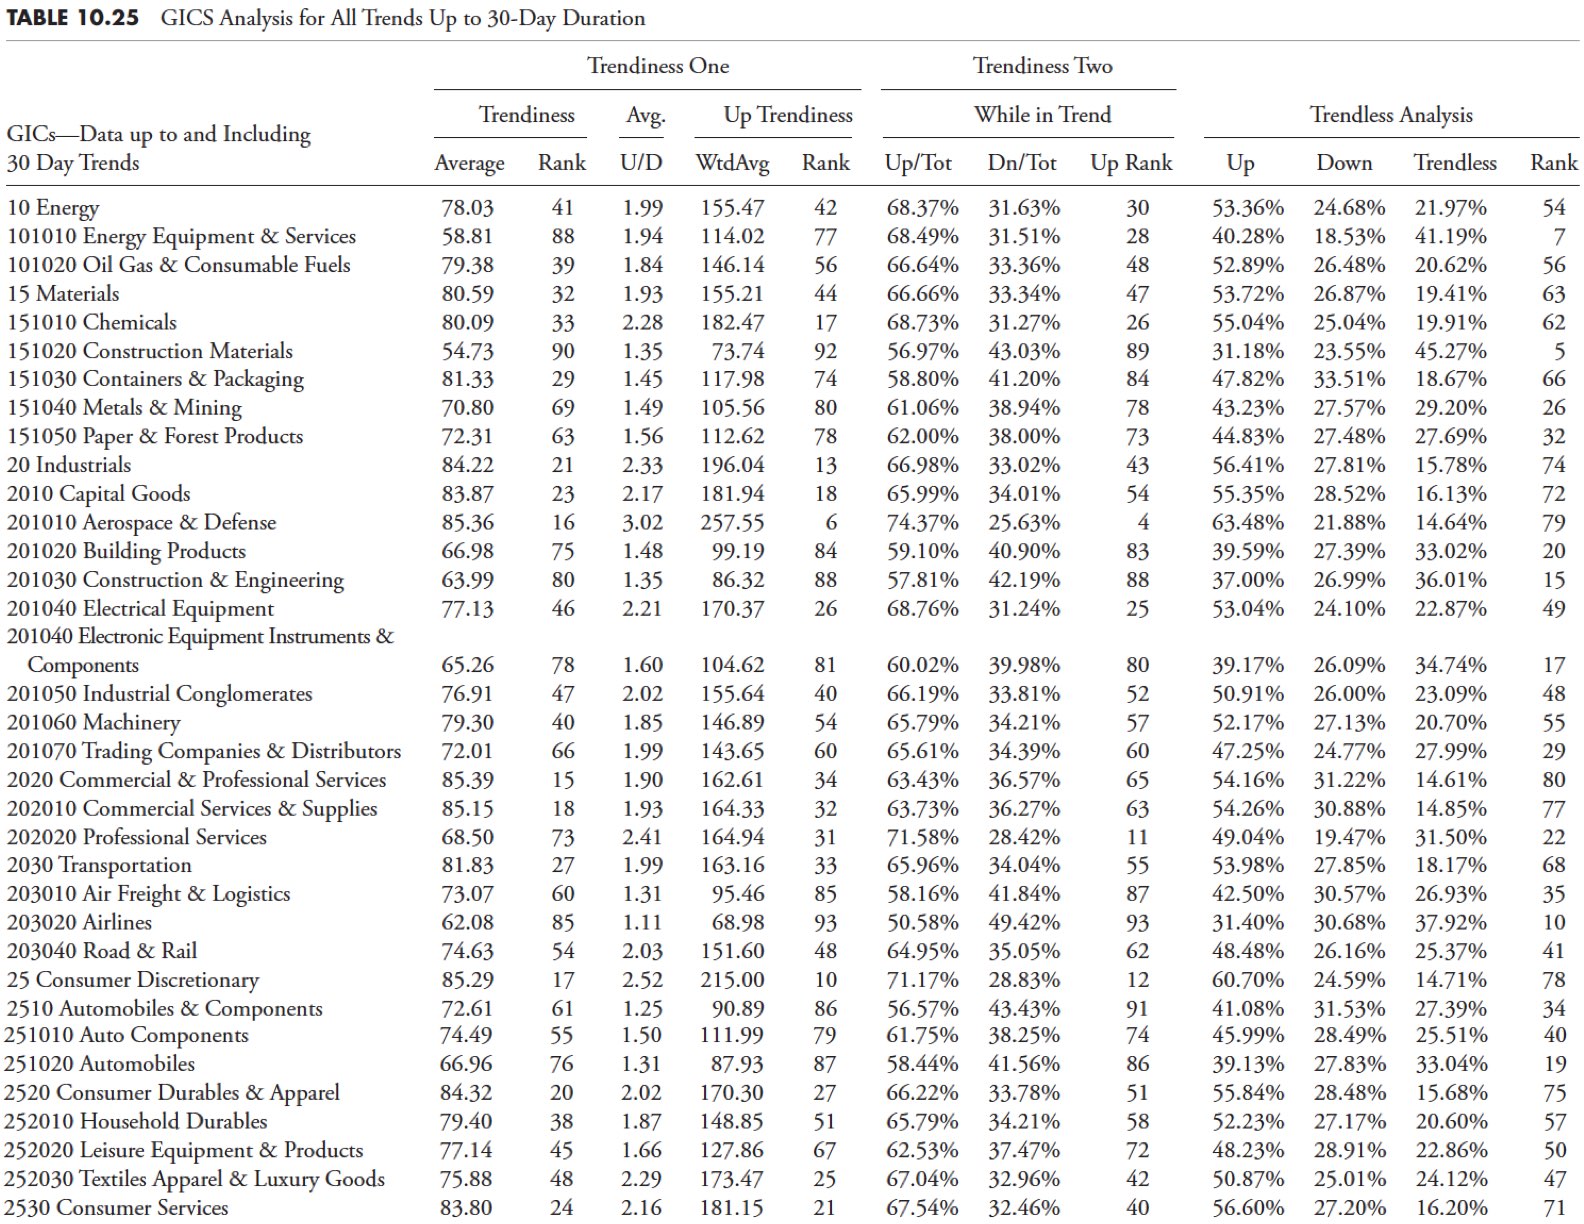
GICS table for all trends up to 30 days
Table 10.25 is the result of analyzing GICS data in the same way as the previous analysis of 109 market indices. You may find it helpful to review the details in that section.
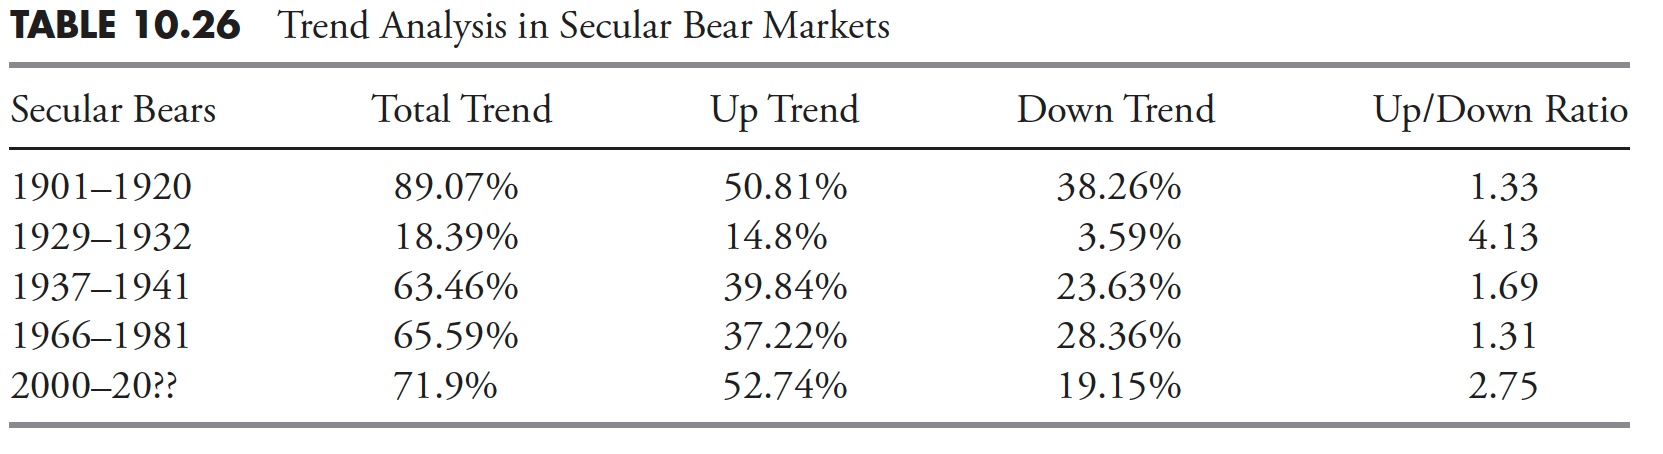
Long-term bear market trend analysis
Table 10.26 shows a trend analysis of the period during which the Dow Industrials was in a prolonged bear market. Although these results are not as robust as the research in this chapter and use a 21-day trend with no movement greater than 5% as a measure, the example illustrates the message. Without studying the markets, you can assume that a long-term bear market is primarily a bear market. I hope this table dispels that notion and shows that strong trend trends still exist even during prolonged bear markets.
If there’s one takeaway from all of this analysis of market trends, it’s market trends. Ranching creates a demand that is the opposite of economic supply and demand. The stock market is a demand event. While some issues tend to trend better when they are trending upwards rather than downwards, the opposite is true for some issues. The tables in this chapter and the appendices should help you identify which index, sector, or industry is better suited to the trend.


