Beneath The Skin Of CPI Inflation, March: Inflation Behaves Very Badly, Saga Far From Over

pcess609
Ugly inflation in services drives up the 3-month “core CPI” for 7th month, to 4.5% annualized, worst in a year, and the 3-month overall CPI to worst since Nov 2022.
So inflation behaved very badly again in March. January was terrible, but it was kind of written off as maybe one of those January blips. February was bad, and so the January-blip story began to fall apart. And the Consumer Price Index for March, released by the Bureau of Labor Statistics on Wednesday, was just as bad as in February.
It was driven by ugly inflation in “core services” which dominated consumer spending – even as prices of durable goods continued to decline, and as food prices remained relatively stable at very high levels. That energy prices started rising again, after their vertiginous plunge, didn’t help either.
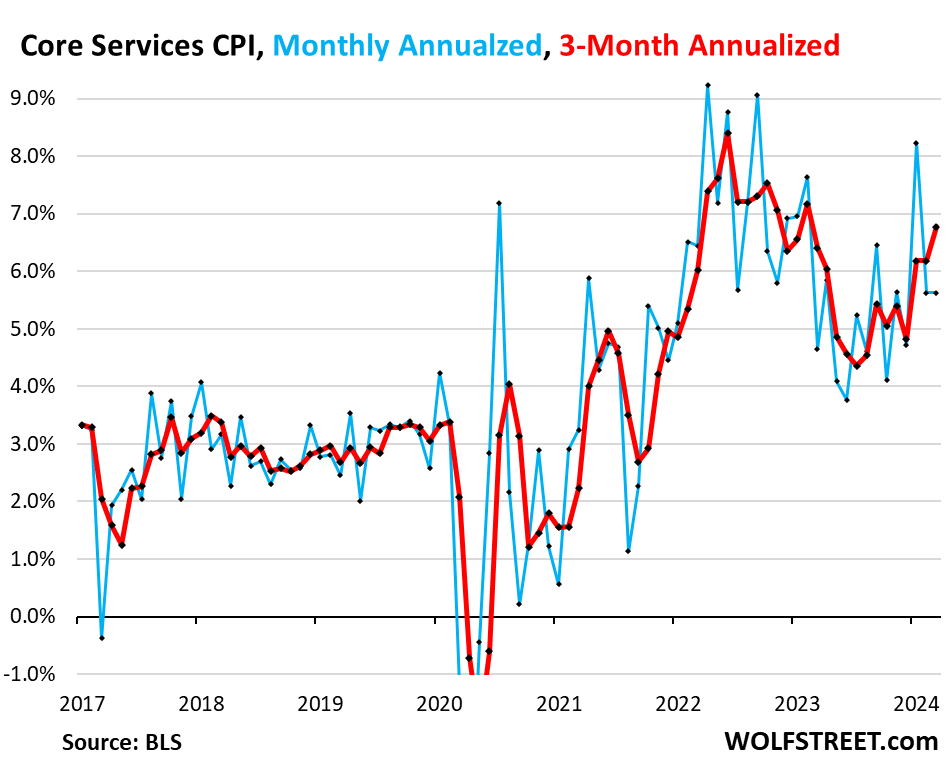
“Core services” CPI jumped by 5.6% annualized in March from February. On a three-month basis, core service CPI jumped by 6.8% annualized, the worst since February 2023. We here have been disconcerted since late last year about inflation in core services. After cooling a lot into mid-2023, it has been reheating. And we started suspecting that the cooling had been one of the head-fakes that inflation is infamous for.
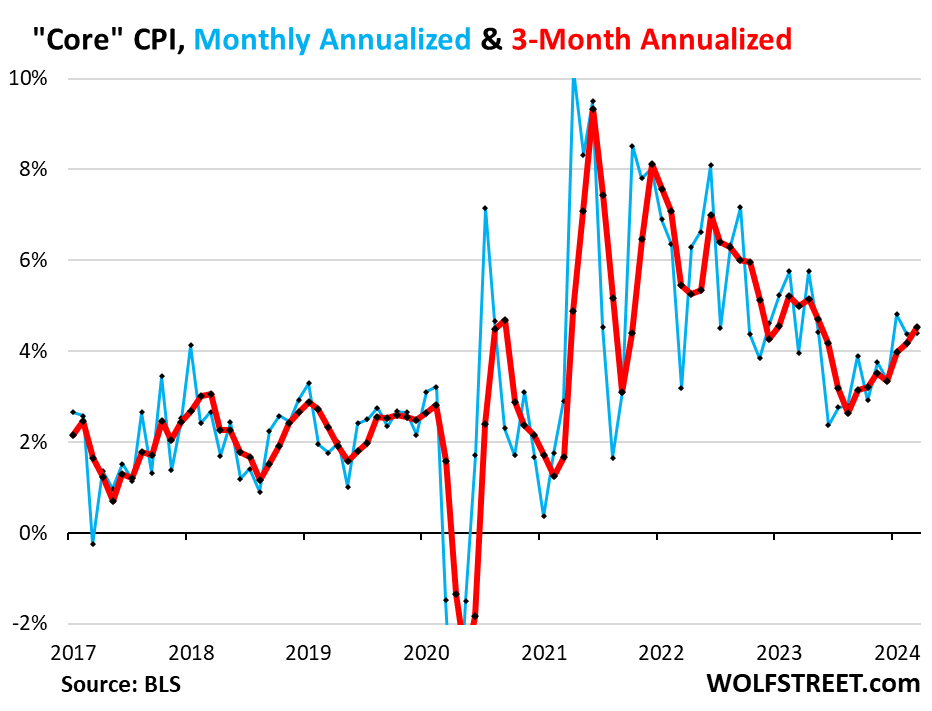
Core CPI, which excludes food and energy, rose by 4.4% annualized in March from February, the same increase as in February.
The three-month core CPI rose by 4.5%, the worst increase since May 2023. The drop in prices of durable goods (dominated by motor vehicles) still softened the impact of hot services inflation, but not enough. Inflation in services is just behaving really badly.
The Fed has been in desperate search of “confidence” that inflation would continue to cool after the Amazing Cooling through mid-2023. But that search has gotten tangled up in a nasty turnaround. The cooling process had ended in August. It was hard to see in the fall of 2023. But over the past five months, it has become clear: Inflation, thought to have been vanquished, has raised its ugly head again.
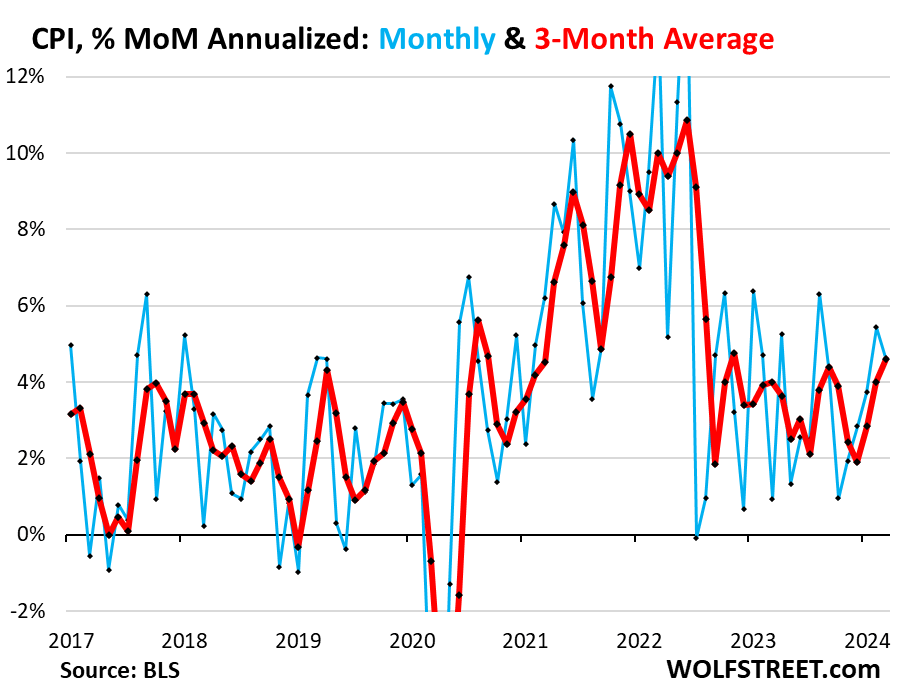
The overall CPI rose by 4.6% annualized in March from February (blue in the chart). The three-month reading, which irons out some of the month-to-month squiggles, also rose by 4.6% annualized, the worst increase since November 2022, and the third month of acceleration in a row (red).
Inflation in Services
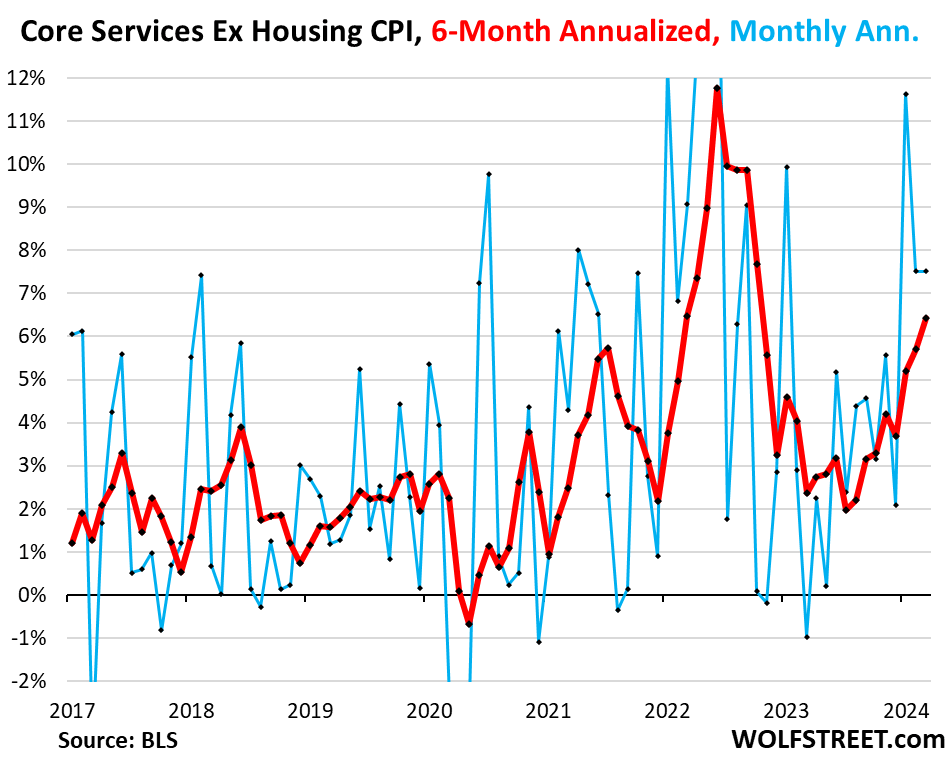
“Supercore CPI” is red hot. The “supercore services CPI – “core services” without housing – jumped by 7.5% annualized in March from February, the same red-hot increase as in the prior month, on top of the 11.6% spike in January. So it’s not just housing that drives services inflation.
The six-month reading – six months to iron out the very volatile month-to-month readings – jumped by 6.4%, the highest since October 2022. This is really ugly. And we’ll get to some of the drivers in a moment.
The Housing Components of Services CPI
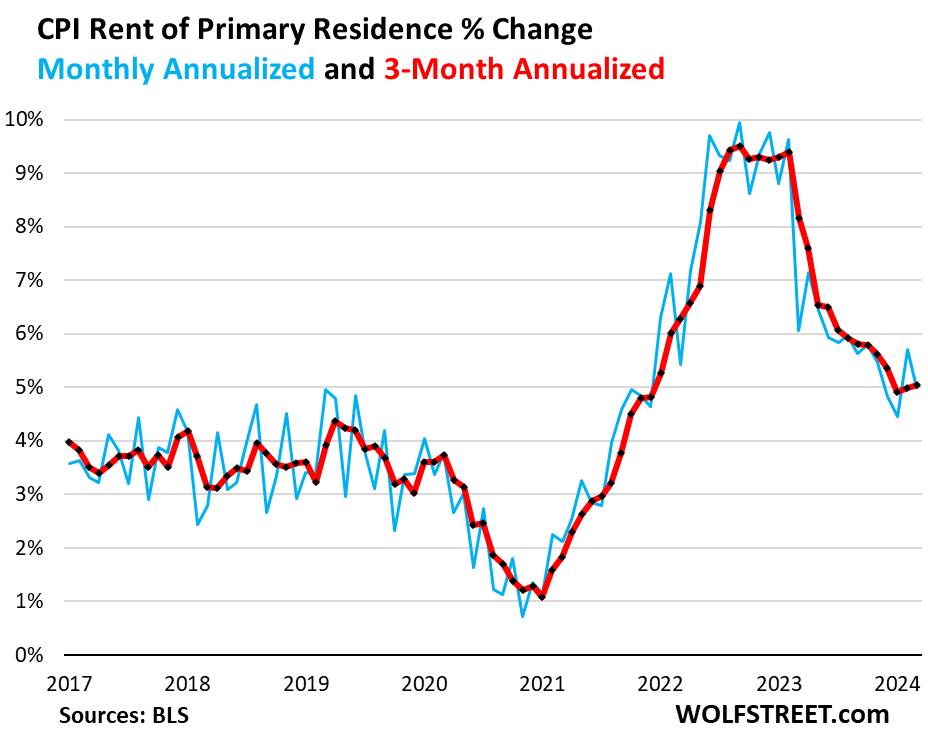
Rent of Primary Residence CPI jumped by 5.0% annualized in March from February after the 5.7% jump in February, and the 4.4% jump in January (blue).
The three-month reading edged up to 5.04%, from 4.99% in the prior month, and from 4.91% in January (red). This was the second month in a row that the three-month reading didn’t drop, something we haven’t seen since peak rent inflation in February 2022.
The Rent CPI accounts for 7.6% of overall CPI. It is based on rents that tenants actually paid, not on asking rents of advertised units for rent. The survey follows the same large group of rental houses and apartments over time and tracks the rents that the current tenants actually paid in these units.
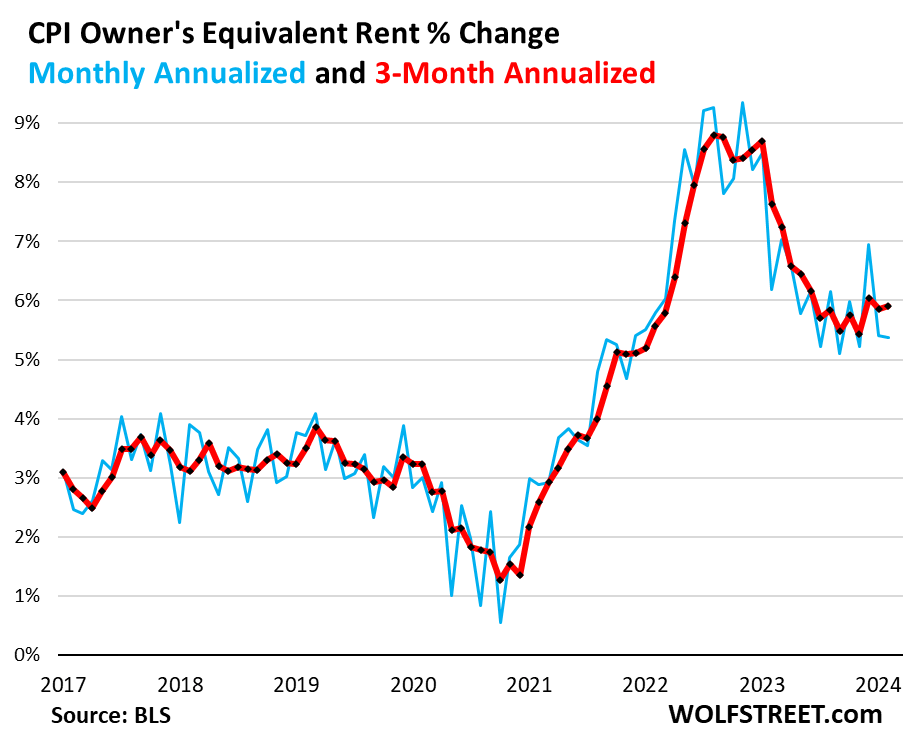
The Owners’ Equivalent of Rent CPI jumped by 5.4% annualized in March from February, roughly the same as in the prior month, after the 6.9% spike in January.
The three-month OER CPI jumped by 5.9% annualized in March from February, the third month in a row near 6%, and above the 5.5% range that had prevailed in the second half of last year. The long-awaited further cooling remains long-awaited.
The OER index accounts for 26.7% of overall CPI. It is designed to estimate inflation of “shelter” as a service for homeowners and is based on what a large group of homeowners estimates their home would rent for.
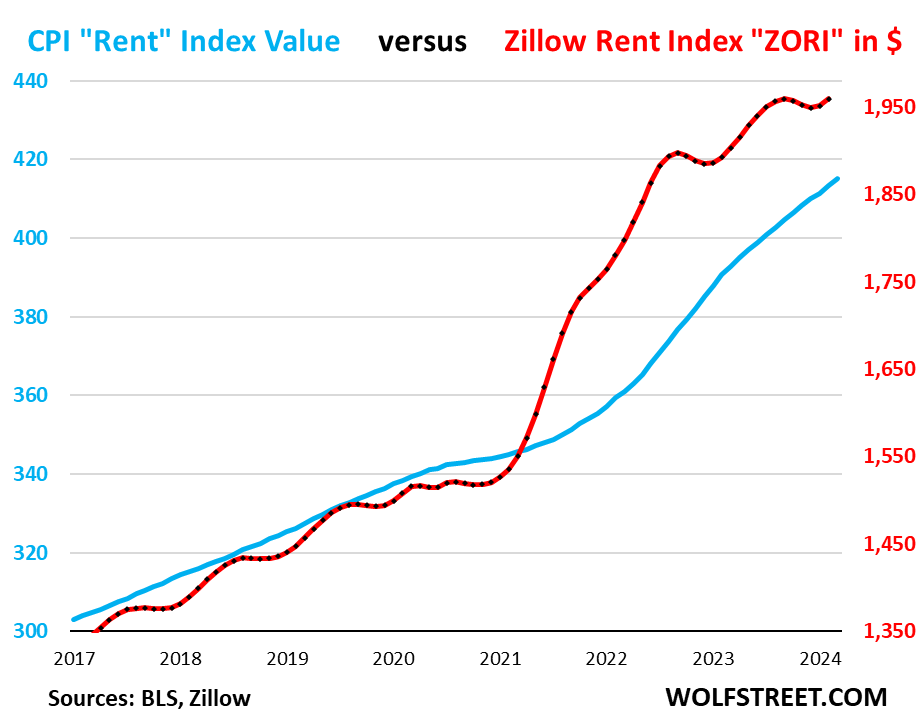
“Asking rents…” The Zillow Observed Rent Index (ZORI) and other private-sector rent indices track “asking rents,” which are advertised rents of vacant units on the market. Because rentals don’t turn over that much, the ZORI’s spike in 2021 through mid-2022 never fully translated into the CPI indices because not many people actually ended up paying those asking rents.
The chart shows the CPI Rent of Primary Residence (blue, left scale) as index value, not percentage change, and the ZORI in dollars (red, right scale). Zillow has not released the ZORI for March yet. The left and right axes are set so that they both increase each by 50% from January 2017, with the ZORI up by 48% and the CPI Rent up by 37% over the period.
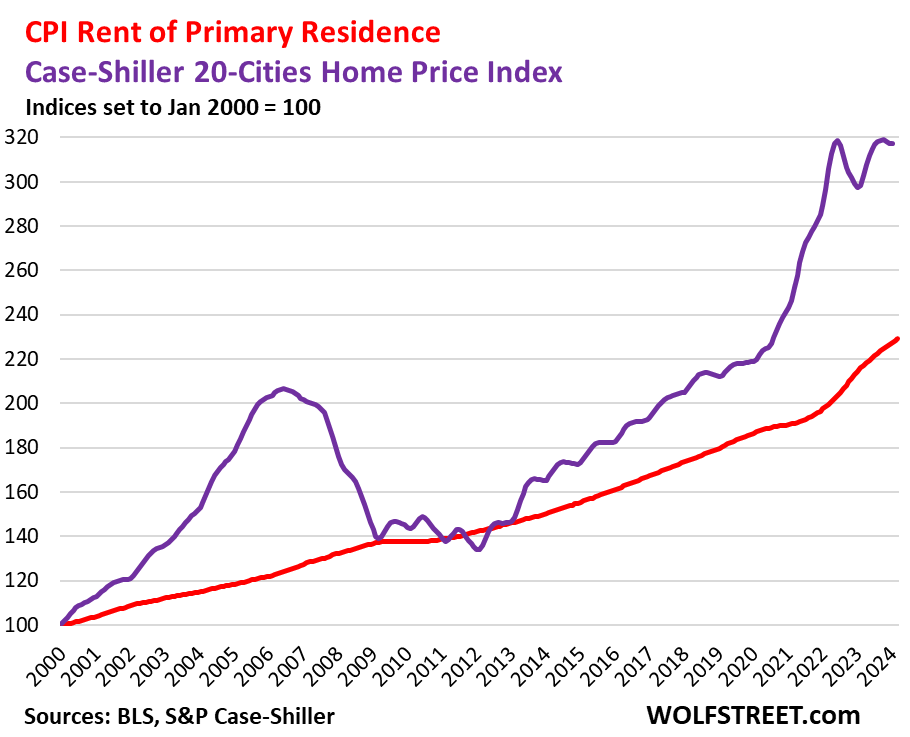
Rent inflation vs. home-price inflation: The red line in the chart below represents the CPI for Rent of Primary Residence (tracking actual rents) as index value, not percentage change. The purple line represents the Case-Shiller 20-Cities Home Price Index (see our “Most Splendid Housing Bubbles in America”). Both indexes are set to 100 for January 2000:
| Major Core Services ex. Energy Services | Weight in CPI | MoM | YoY |
| Major core services | 59% | 0.5% | 5.4% |
| Owner’s equivalent of rent | 26.7% | 0.4% | 5.9% |
| Rent of primary residence | 7.6% | 0.4% | 5.7% |
| Medical care services & insurance | 6.5% | 0.6% | 2.1% |
| Education and communication services | 5.0% | 0.2% | 1.4% |
| Motor vehicle insurance | 2.9% | 2.6% | 22.2% |
| Admission, movies, concerts, sports events, club memberships | 1.9% | -0.8% | 4.4% |
| Other personal services (dry-cleaning, haircuts, legal services…) | 1.5% | 0.8% | 5.4% |
| Motor vehicle maintenance & repair | 1.2% | 1.7% | 8.2% |
| Water, sewer, trash collection services | 1.1% | 0.3% | 5.3% |
| Video and audio services, cable, streaming | 0.9% | 1.0% | 4.4% |
| Lodging away from home, incl Hotels, motels | 1.4% | 0.1% | -1.9% |
| Pet services, including veterinary | 0.4% | 1.9% | 7.3% |
| Public transportation (airline fares, etc.) | 1.1% | -1.0% | -5.6% |
| Tenants’ & Household insurance | 0.4% | 0.5% | 4.6% |
| Car and truck rental | 0.1% | -0.8% | -8.8% |
| Postage & delivery services | 0.1% | 0.4% | 3.5% |
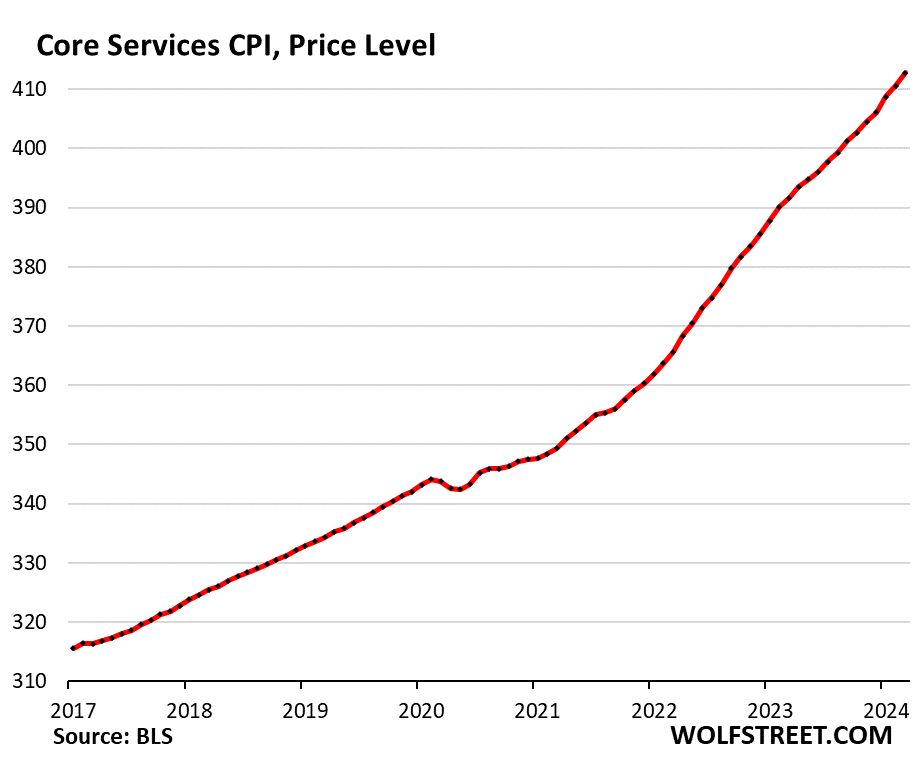
Core services price level. Since March 2020, the core services CPI has increased by 19.4%. This chart shows the core services CPI as index value, not as percentage change of that index value. Note how the curve of price levels has become steeper in recent months.
Durable Goods CPI
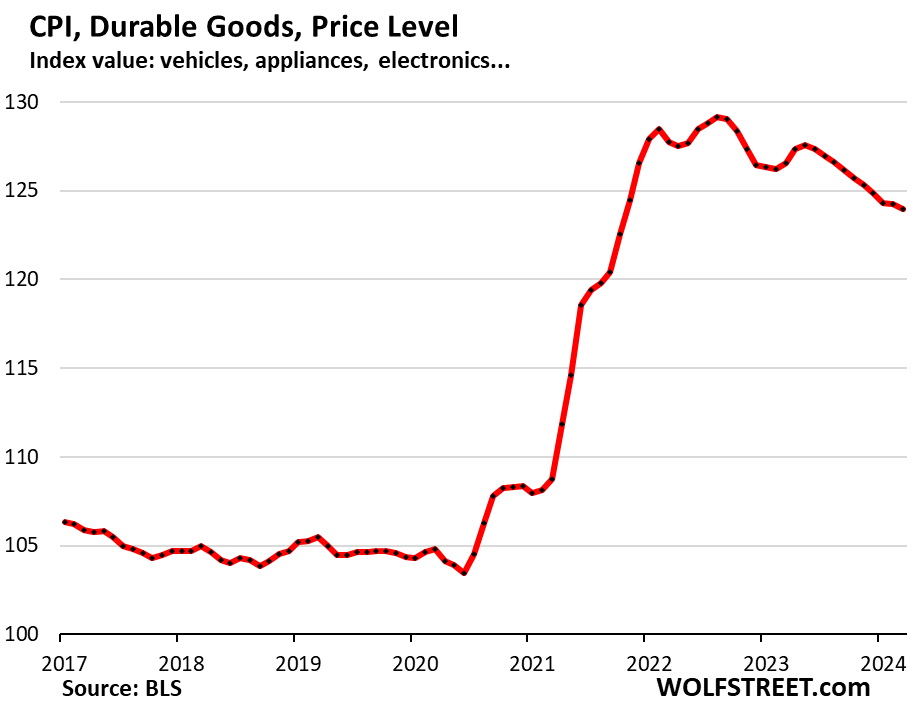
The durable goods CPI dipped 2.7% annualized in March from February and by 2.1% year-over-year.
New and used vehicles dominate this index, which also includes information technology products (computers, smartphones, home network equipment, etc.), appliances, furniture, fixtures, etc. And all categories experienced price declines, as durable goods prices are slowly coming down from their pandemic spike that had ended in August 2022.
From March 2020 to the peak in August 2022, durable goods prices spiked by 23.4%. Since then, they have dropped by 4.0%, having given up about 21% of the pandemic spike.
| Major durable goods categories | MoM | YoY |
| Durable goods overall | -0.2% | -2.1% |
| New vehicles | -0.2% | -0.1% |
| Used vehicles | -1.1% | -2.2% |
| Information technology (computers, smartphones, etc.) | -1.2% | -6.6% |
| Sporting goods (bicycles, equipment, etc.) | -1.0% | -2.2% |
| Household furnishings (furniture, appliances, floor coverings, tools) | -0.1% | -2.7% |
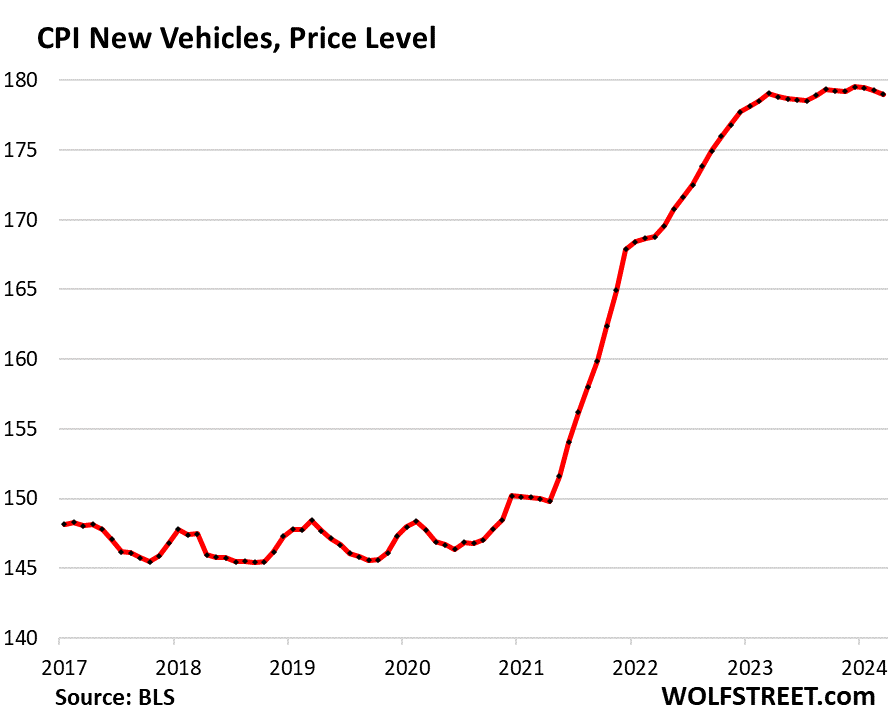
New vehicles CPI edged down for the third month in a row, after the 20% price spike in 2021 and 2022. But since March 2023, the index is essentially unchanged. New vehicle prices, unlike used vehicle prices, have turned out to be very sticky.
In the years before the pandemic, the new vehicle CPI was also meandering along a flat line, though vehicles were getting more expensive. This is the effect of “hedonic quality adjustments” applied to the CPIs for new and used vehicles and other products (detailed explanation of hedonic quality adjustments in the CPI).
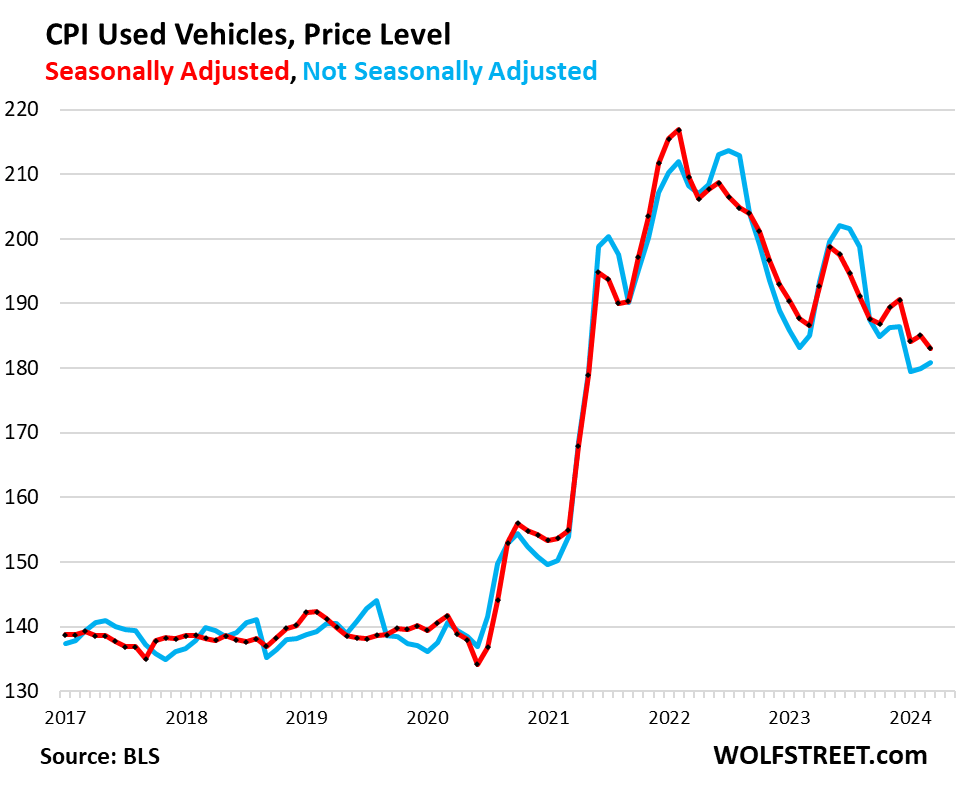
Used vehicle CPI fell by 1.1% seasonally adjusted in March from February (red); not seasonally adjusted, it rose by 0.5% (blue). March is tax refund season when people use their tax refunds for down-payments, and business perks up, and profits are easier, and prices nearly always rise in March from February. But this March, they rose less than normal.
Used vehicle CPI had spiked by 53% from February 2020 through January 2022. From that peak, it has dropped by 15.1% (seasonally adjusted), having given up 43% of its pandemic spike.
Food Inflation
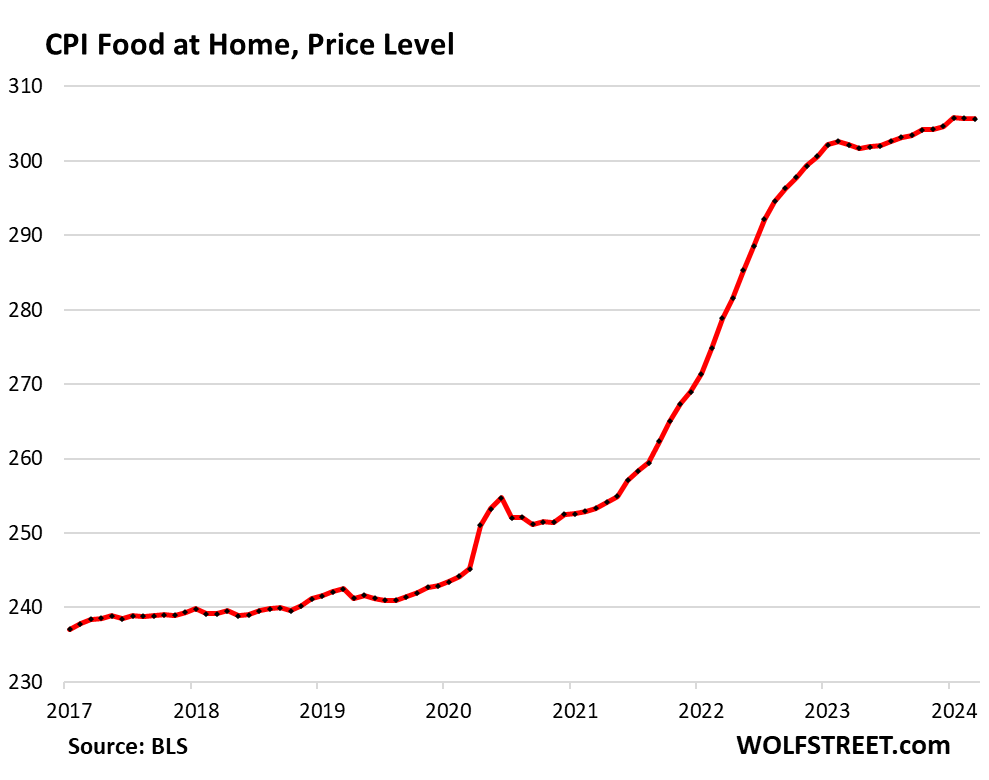
Food at home CPI – purchased at stores and markets and eaten off-premises – was unchanged in March for the second month in a row, and was up 1.2% from a year ago. But after the pandemic spike, the index is still up 25% from February 2020.
| Food | MoM | YoY |
| Food at home | 0.0% | 1.2% |
| Cereals, breads, bakery products | -0.9% | 0.2% |
| Beef and veal | 0.2% | 7.6% |
| Pork | 1.1% | 0.3% |
| Poultry | 1.5% | 2.1% |
| Fish and seafood | 0.3% | -2.6% |
| Eggs | 4.6% | -6.8% |
| Dairy and related products | -0.1% | -1.9% |
| Fresh fruits | 0.3% | 1.5% |
| Fresh vegetables | -0.2% | 3.0% |
| Juices and nonalcoholic drinks | 0.6% | 3.6% |
| Coffee, tea, etc. | 0.3% | -2.2% |
| Fats and oils | -1.0% | 1.4% |
| Baby food & formula | 0.7% | 9.9% |
| Alcoholic beverages at home | -0.2% | 1.7% |
| Food away from home | 0.3% | 4.2% |
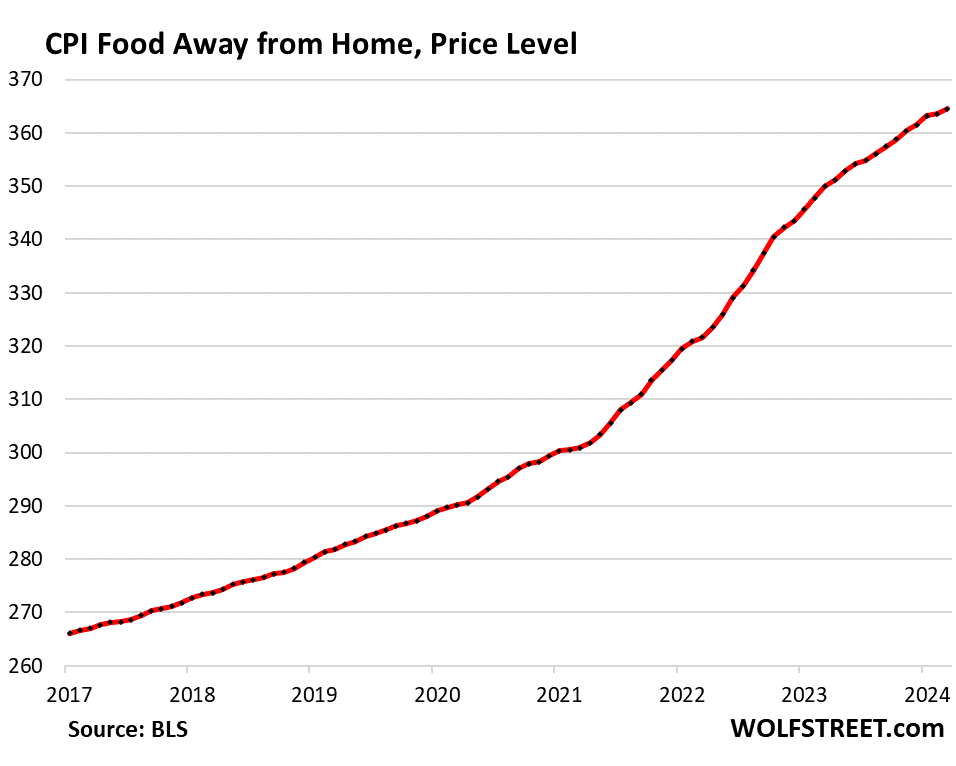
Food away from Home CPI rose by 3.2% annualized in March from February and year-over-year by 4.2%, after the massive price spikes in 2022 and 2023. Since February 2020, the index has soared by 26%.
The category includes full-service and limited-service meals and snacks served away from home, food at schools and work sites, food from vending machines and mobile vendors, etc.
Energy
The CPI for energy products and services that consumers buy directly rose for the second month in a row and was year-over-year for the first time since February 2023:
| CPI for Energy, by Category | MoM | YoY |
| Overall Energy CPI | 1.1% | 2.1% |
| Gasoline | 1.7% | 1.3% |
| Electricity service | 0.9% | 5.0% |
| Utility natural gas to home | 0.0% | -3.2% |
| Heating oil, propane, kerosene, firewood | -1.1% | -3.1% |
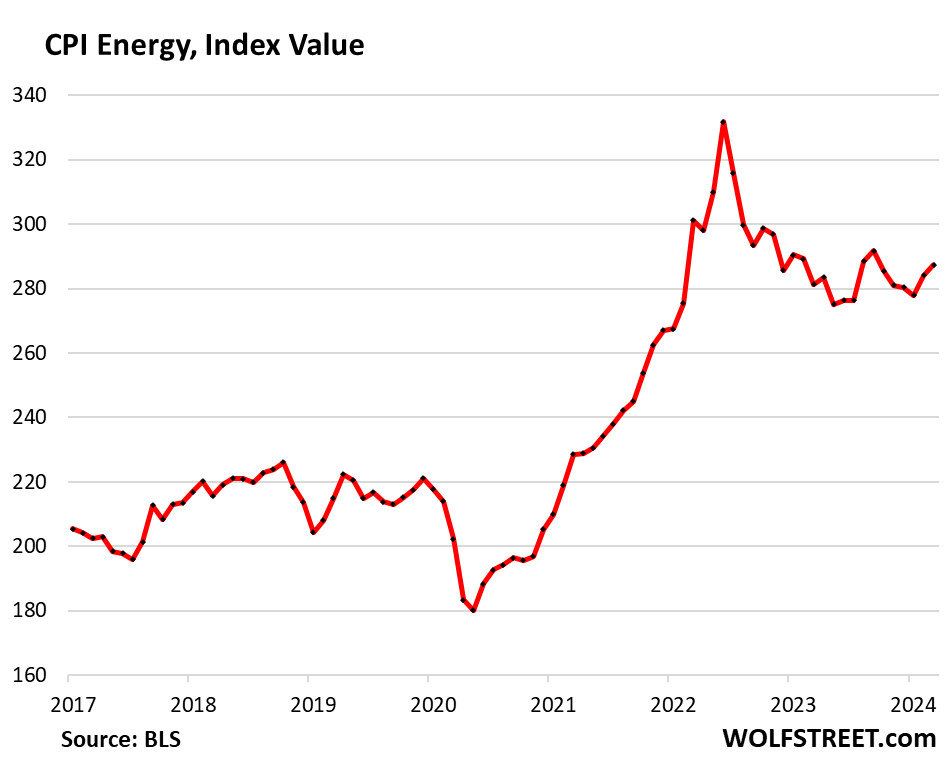
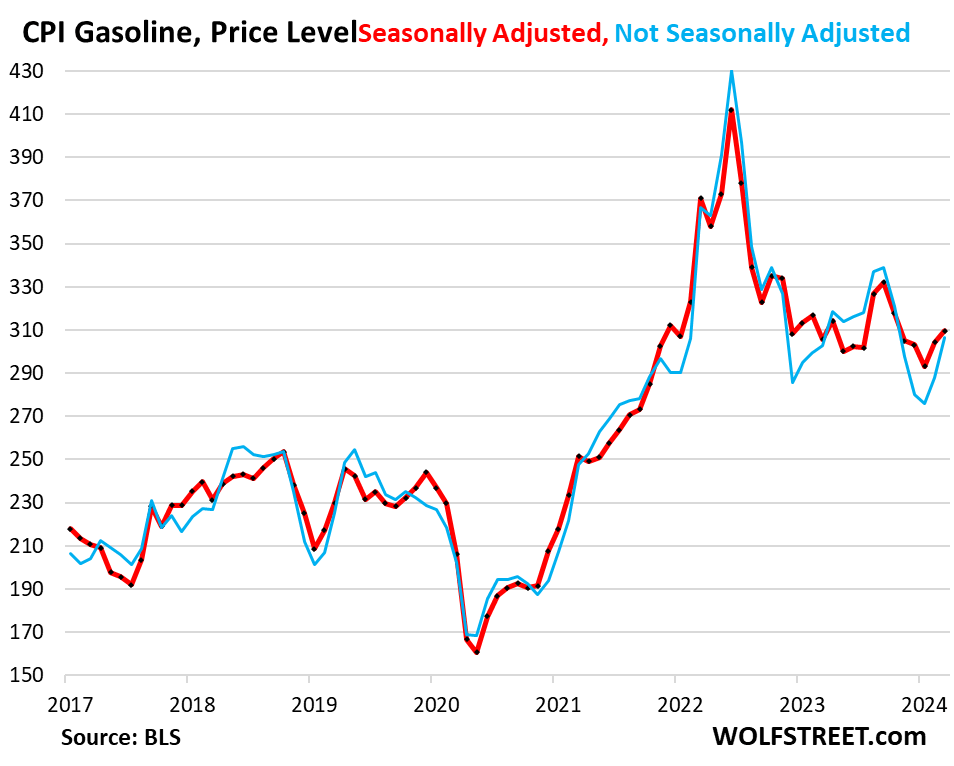
Gasoline, which accounts for about half of the energy price index, is very seasonal, with the lowest prices in December or January and the highest prices during driving season in the summer. The chart shows the seasonally adjusted price levels (red) and the not seasonally adjusted price levels (blue), and both of them rose over the past two months:
Original Post
Editor’s Note: The summary bullets for this article were chosen by Seeking Alpha editors.


