Stock market indices plunge after hitting resistance – support levels to watch | chart watcher

key
gist
- The Dow Jones Industrial Average, S&P 500, and Nasdaq composite index fell.
- Gold continues to hit new highs
- VIX surged above 18 but closed at 17:31.

Earnings season has now begun. What do you expect the stock market to do, especially after the strong performance in the first quarter? Well, after months of singing the monotonous “up, up, up,” things have taken a bit of a turn for the stock market. Now you will hear “up, down, up, down”.
Why change?
The stock market entered a sell-off due to higher-than-expected CPI figures, but the situation turned around slightly as PPI fell slightly more than expected. However, selling pressure returned on Friday and the composite index closed lower.
Earnings season began with JPMorgan Chase (JPM), Wells Fargo (WFC), and Citigroup (C) beating estimates. However, the stock price fell due to lower-than-expected interest income. JPMorgan Chase CEO Jamie Dimon further worried investors with his comments about inflation. Additionally, rising concerns about geopolitical tensions have made investors nervous, and stock markets have fallen sharply this week. The CBOE Volatility Index ($VIX), considered a fear gauge, surged above 18 during the trading day but closed lower.
Dow Jones Industrial Average Analysis
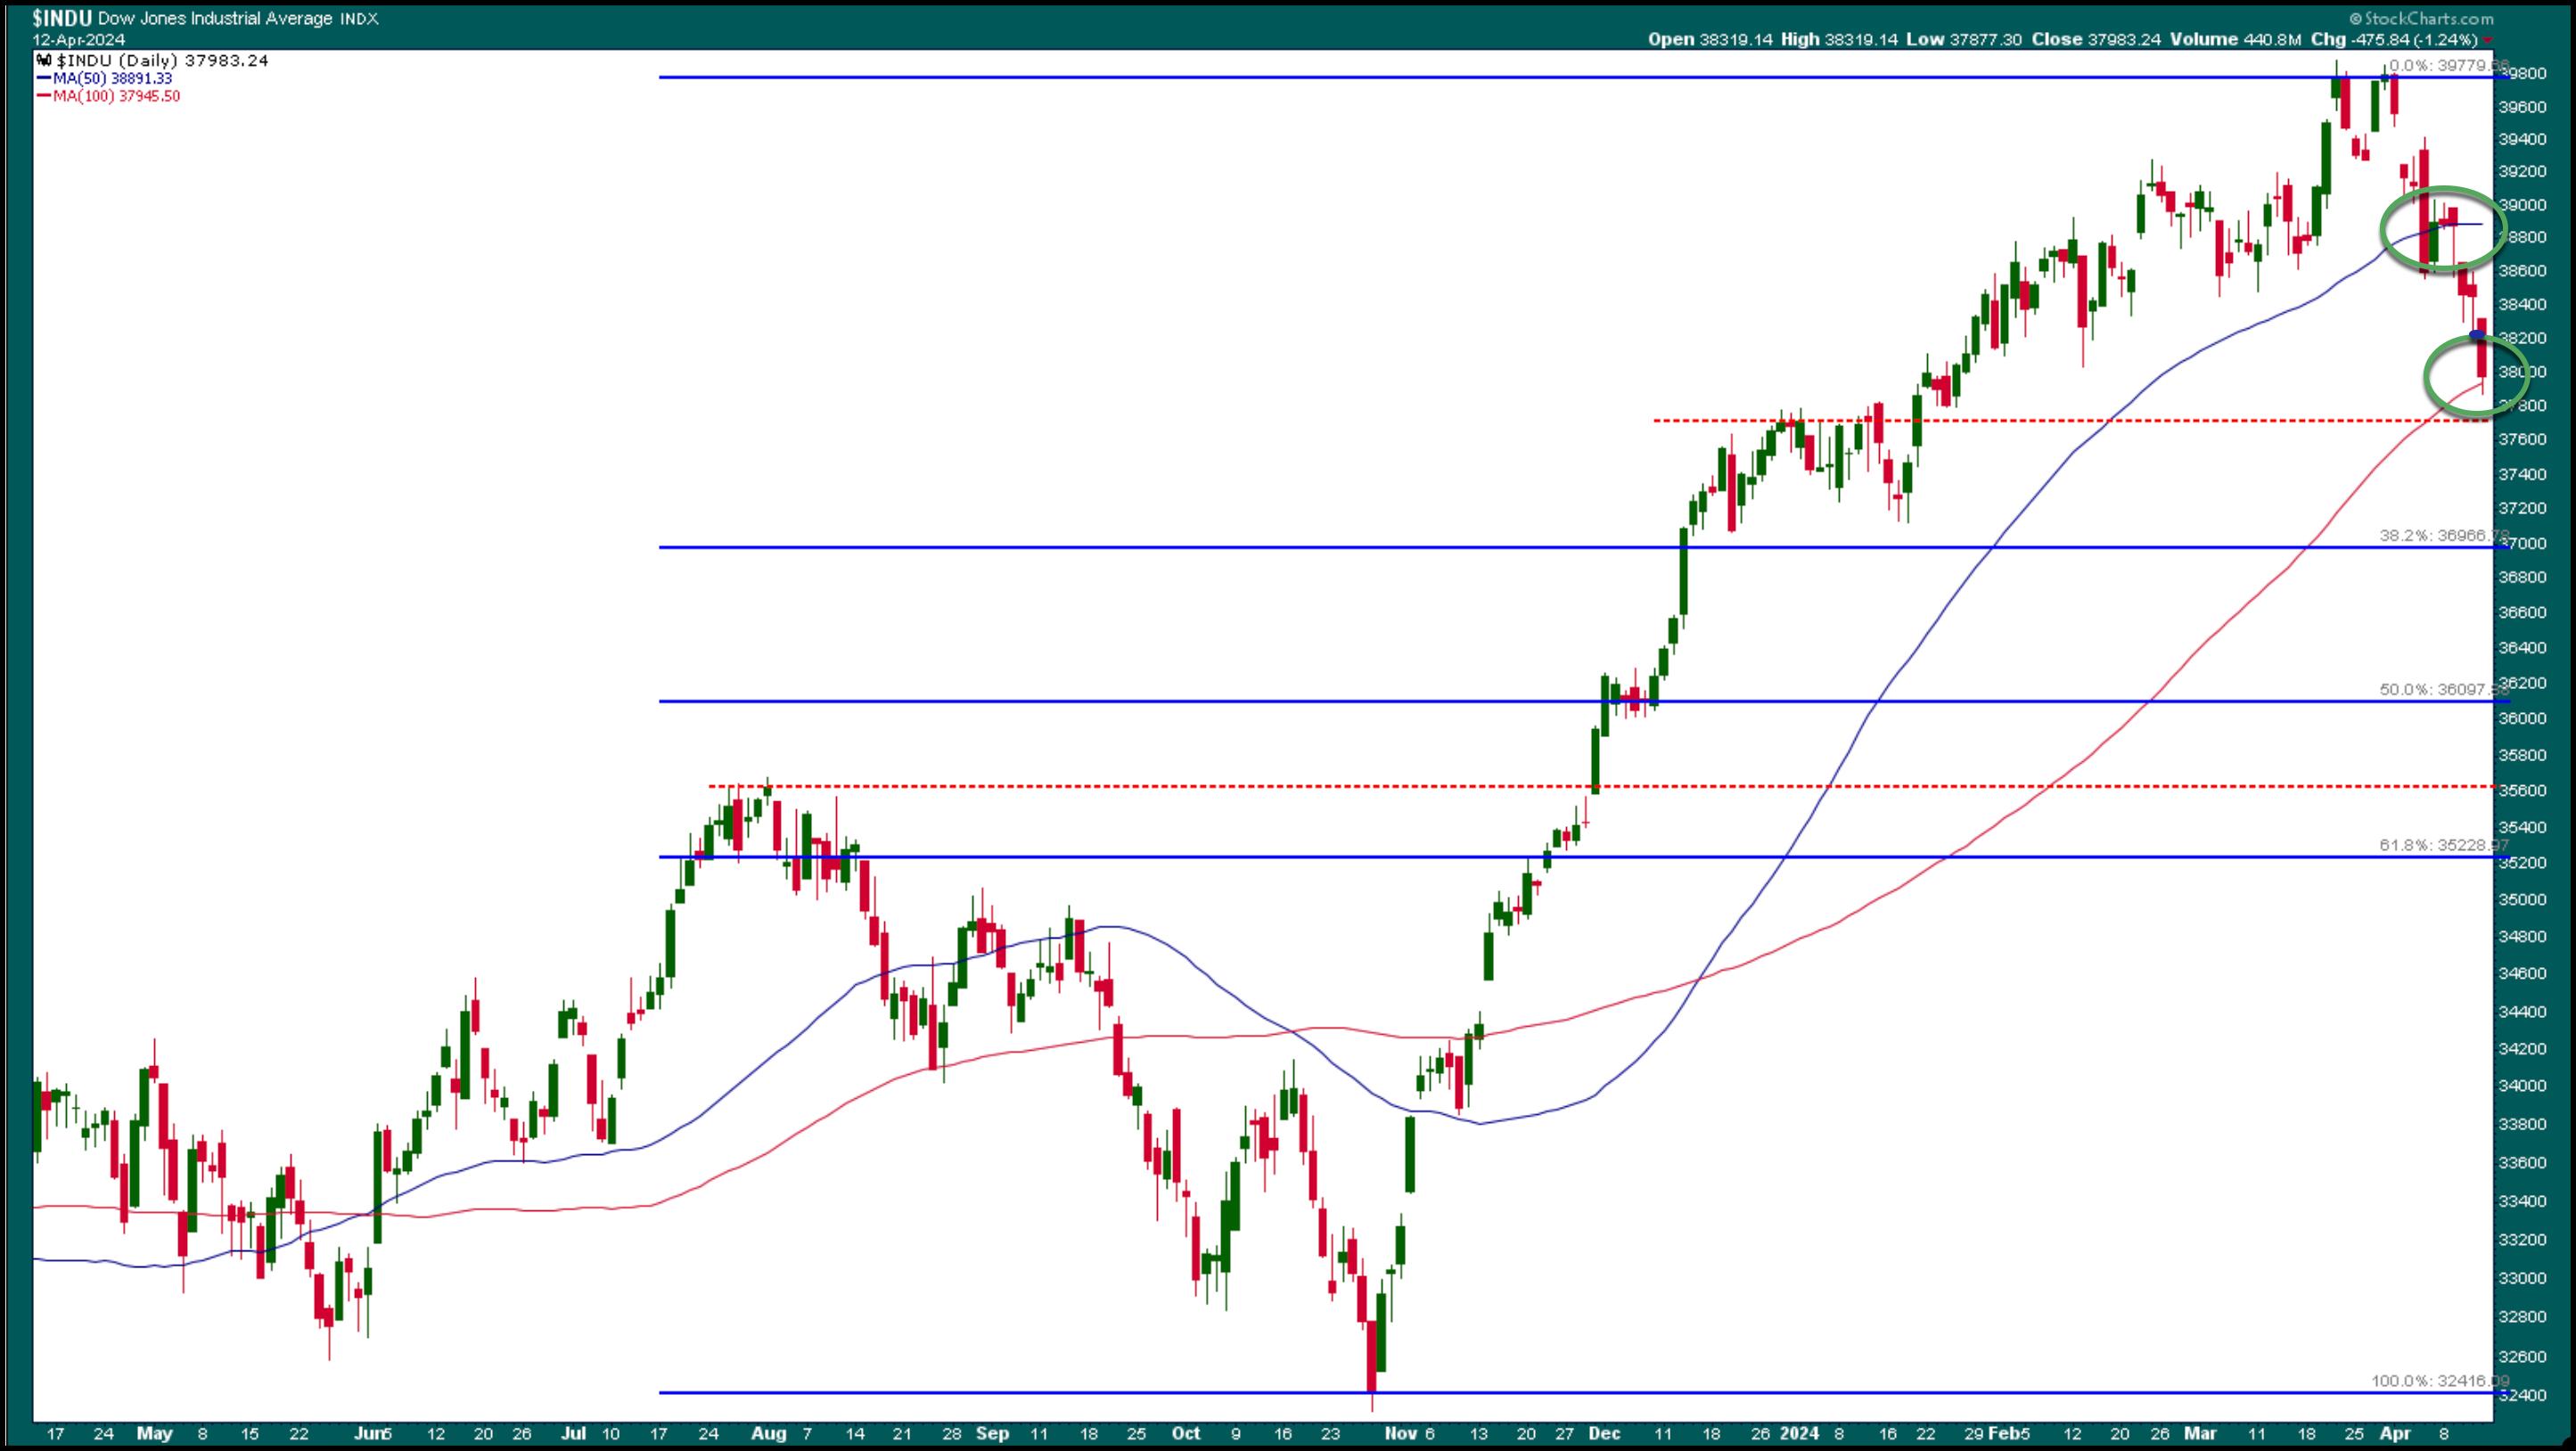
The Dow Jones Industrial Average ($INDU) daily chart below shows the index hitting an April high and then falling back to roughly the same level as its March high. This reversal happened relatively quickly. In this scenario, it helps to sit back, analyze the charts, and add lines in the sand.

Chart 1. Daily chart of the Dow Jones Industrial Average. After hitting record highs, the index began to decline, falling below the 50-day simple moving average (SMA) and is now close to the 100-day SMA.Chart source: StockCharts.com. For educational purposes.
First, look for prominent levels of support, such as previous highs, price gaps, or lows. From the chart above, it is clear that a series of higher highs have been broken and the index is now marking lower highs.
After a downward breakout of the February lows, the next support level will be the late December highs (red dotted line). Likewise, various support levels can be identified and plotted on the chart (red dotted line around 35,600).
Another way to identify support and resistance is to add Fibonacci retracement levels. On the $INDU daily chart, Fibonacci retracement levels are drawn from the October low to the March/April high.
How do I add trend lines to StockCharts?
How do I add Fibonacci retracement levels to StockCharts?
- Select the Annotate button > Line Study icon > Fibonacci Retracement.
Moving averages help identify overall trends. On the daily chart of $INDU, the index is below the 50-day simple moving average (SMA) and trying to hold support at the 100-day SMA. The S&P 500 is at its 50-day SMA.
long term perspective
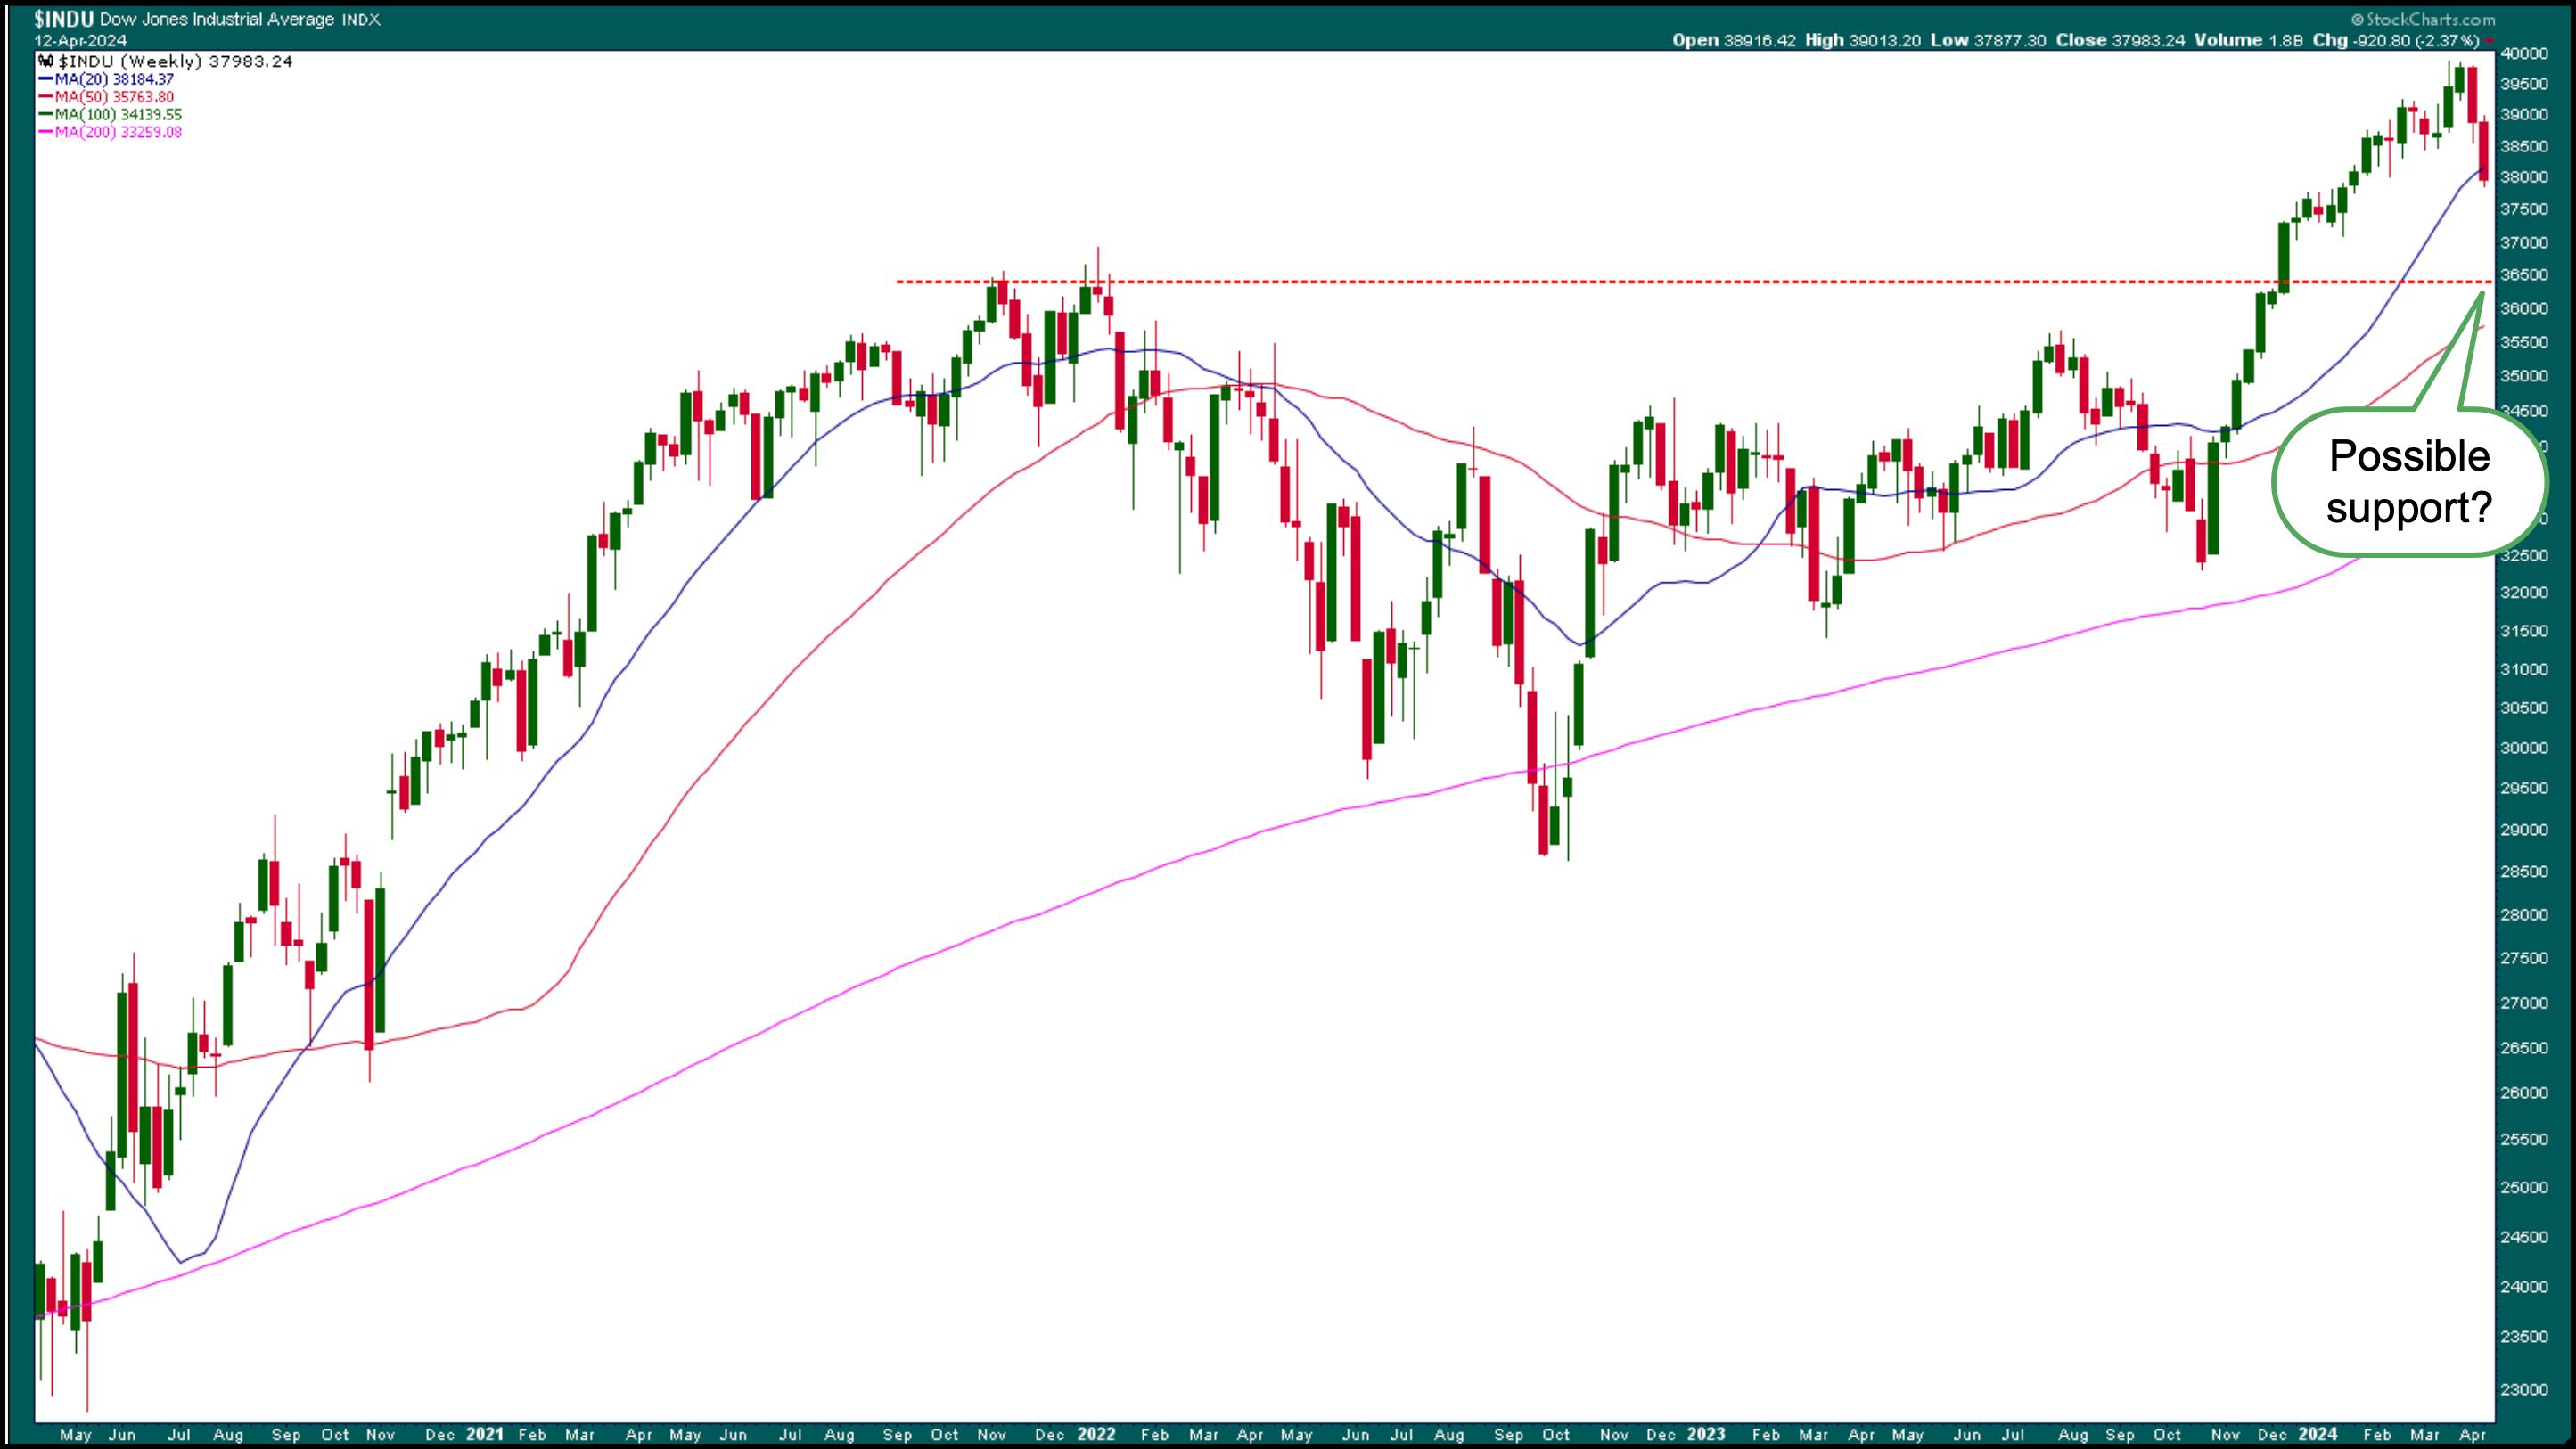
Weekly Dow Jones charts provide a big picture picture of the index (see chart below). The Dow is still above its 50-week SMA, but has seen significant selling over the past two weeks. However, less than 5% of the corrections were made. Next week will be interesting as the S&P 500 and Dow Jones are at important support levels at the end of this trading week. The market has experienced some downturns recently, but the correction period could be extended if the indices fall below significant support levels.

Chart 2. Weekly chart of the Dow Jones Industrial Average. The index is below its 50-week SMA. Will we fall to the next support level?Chart source: StockCharts.com. For educational purposes.
While stocks have been selling off, commodity prices have risen since March and gold has hit record highs. and Silver hits 52-week high. Energy prices continue to rise, and so does the value of the U.S. dollar. Although it is still too early to conclude that investment sentiment is changing, it is something that needs to be watched closely.
How This Affects Your Investment Portfolio
A 5-10% adjustment is nothing to panic about. The stock market is overextended and a downturn is long overdue. In times like these, you need to monitor the market regularly.
Here are some steps you can take:
- Add potential support levels to your chart and monitor them closely.
- Take a look at the S&P sectors and see which sectors are leading and which are lagging. Our Chief Market Strategist, CMT David Keller covers this on his show. final bar.
- Monitor price movements in commodity markets such as gold, silver, and crude oil.
weekend wrap up

- The S&P 500 closed at 5,123.41, down 1.46%, and the Dow Jones Industrial Average closed at 37,983, down 1.24%. The Nasdaq Composite Index closed at 16,175.09, down 1.62%.
- $VIX up 16.10% from 17.31
- Top performing sector this week: Technology
- Worst performing sector this week: Finance
- Top 5 Large Cap Stocks SCTR Stocks: MicroStrategy Inc. (MSTR); Coinbase Global Inc. (COIN); Super Microcomputer (SMCI); Vistra Energy Corporation (VST); Vertiv Holdings (VRT)
On the radar next week
- March industrial production
- March manufacturing production
- More Fed Speeches
- Earnings from Goldman Sachs (GS), Bank of America (BAC), Morgan Stanley (MS), United Airlines (UAL), and Schlumberger (SLB).
disclaimer: This blog is written for educational purposes only and should not be construed as financial advice. You should not use any of our ideas and strategies without first evaluating your personal and financial situation or consulting with a financial professional.

Jayanthi Gopalakrishnan is the Director of Site Content at StockCharts.com. She spends her time creating content strategies, providing content to educate traders and investors, and finding ways to make technical analysis fun. Jayanthi was the Editor-in-Chief of T3 Custom, a content marketing agency for financial brands. Prior to that, she served as Technical Analysis Editor for Stocks & Commodities magazine for over 15 years. Learn more


