Could Ethereum see a new movement soon? What Futures Data Says

Data shows that Ethereum Open Interest has been trading at relatively low levels recently. Here’s what this means for asset prices:
Ethereum Open Interest Is Moving Sideways After a Plunge
As explained by the analyst in the CryptoQuant Quicktake post, ETH open interest has been following a similar trajectory to the cryptocurrency price recently. Here, “open interest” refers to the total number of derivatives-related contracts open for Ethereum across all exchanges.
If the value of this metric goes up, it means that investors are currently opening new positions on the platform. Typically, this trend can lead to increased aggregate leverage in the market, which can lead to more volatility in asset prices.
On the other hand, a decline in the indicator means that investors are either voluntarily closing their positions or are being forced to liquidate by the platform. These declines may be accompanied by violent price movements, but once the decline is over, the market may become more stable due to reduced leverage.
We now have a chart showing the trend of Ethereum open interest over the past few months.

The value of the metric appears to have witnessed a sharp plunge recently | Source: CryptoQuant
As shown in the graph above, Ethereum Open Interest recorded a sharp drop early along with the asset price. The plunge in metrics occurred naturally as long-term contract holders were washed out due to falling prices.
Since the price has mostly consolidated sideways since the decline, so has the value of open interest. quant notes,
This correction suggests activity within the futures markets is cooling. As a result, the market appears poised for a resurgence of buy or sell positions, potentially setting the stage for a fresh and decisive market move in either direction.
Another indicator related to the derivatives market that may be related to Ethereum’s future price action is the funding ratio. This indicator tracks the recurring fees that derivative contract holders are currently paying to each other.
A positive funding ratio means that buyers are paying a premium to sellers to maintain their positions. Therefore, optimistic sentiments dominate. Likewise, a negative value suggests that most derivatives traders share a bearish sentiment.
If you look at the chart below, you can see that the Ethereum funding rate has recently turned into a deficit.
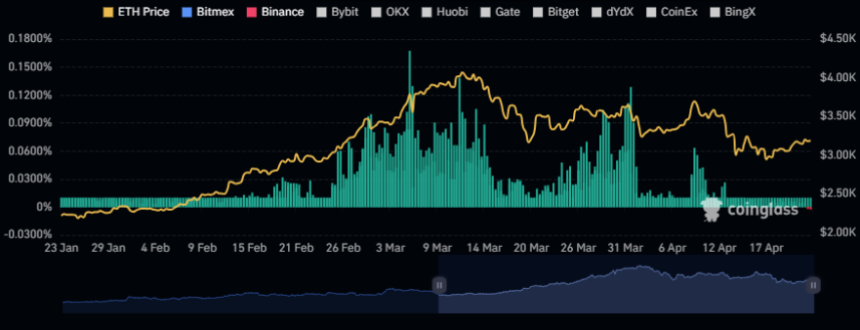
The data for the ETH funding rates over the last few months | Source: CoinGlass
Historically, markets have been more likely to move against the majority opinion, so the fact that the funding ratio has reversed into negative could be a good sign about the start of a potential uptrend.
ETH price
Ethereum price has been gradually increasing over the past few days, with the price now reaching $3,200.
Looks like the value of the coin has gone up a bit over the past few days | Source: ETHUSD on TradingView
Featured image by Kanchanara from Unsplash.com, CoinGlass.com, CryptoQuant.com, chart from TradingView.com
Disclaimer: This article is provided for educational purposes only. This does not represent NewsBTC’s opinion on whether to buy, sell or hold any investment, and of course investing carries risks. We recommend that you do your own research before making any investment decisions. Your use of the information provided on this website is entirely at your own risk.


