Grand Slam: Broad stock market indices soar to new highs | chart watcher

key
gist
- The S&P 500, Dow Jones Industrial Average, and Nasdaq Composite closed at record highs.
- Bond prices also rose, as did gold and silver.
- VIX remains low, indicating investors are becoming complacent.
The bull market wasn’t going anywhere. Despite concerns about a possible correction and the long wait for a move in either direction, the stock market has finally shown its strength.
The Dow Jones Industrial Average ($INDU) could reach 40K, the S&P 500 ($SPX) could reach 5,500, and the Nasdaq Composite ($COMPQ) could reach 20K. It may seem like the Nasdaq’s gains are increasing, but given how the index has moved, is there any reason to rule out that possibility? Today’s stock market action showed a return to optimism.
Restoring investor confidence
It wasn’t that long ago that investors were concerned that the stock market could correct much more than it actually did. What followed was lethargic stock market action. Now that the market got the inflation data it was waiting for and liked what it saw, the stock market moved higher during the trading day, closing at or near the day’s high.
The Dow, S&P 500 and Nasdaq composite indexes closed on record. There was a lot of commotion in the stock market today. Investors don’t worry about interest rates or whether the market is overbought. You can feel the investor confidence in this market.
The CBOE Volatility Index ($VIX) closed at 12.44, indicating investors were becoming complacent. With the broad indexes closing at new highs, volatility low and all 11 S&P sectors closing in the green (consumer staples, barely), you have the perfect recipe for a strong market that could continue to rise.
CPI on Wednesday came in slightly lower than expected, which was encouraging for investors. Treasury yields fell after the news, while stocks, bonds, Bitcoin and precious metals rose. Optimism should be the word of the day.
Click here to see live charts.

The daily chart of the iShares 20+ Year Treasury Bond ETF (TLT) below shows that the ETF has reached a key resistance level. A breakout of that could cause bonds to move higher along with stocks. This is an unusual correlation, but there were many surprises today (more on that below).
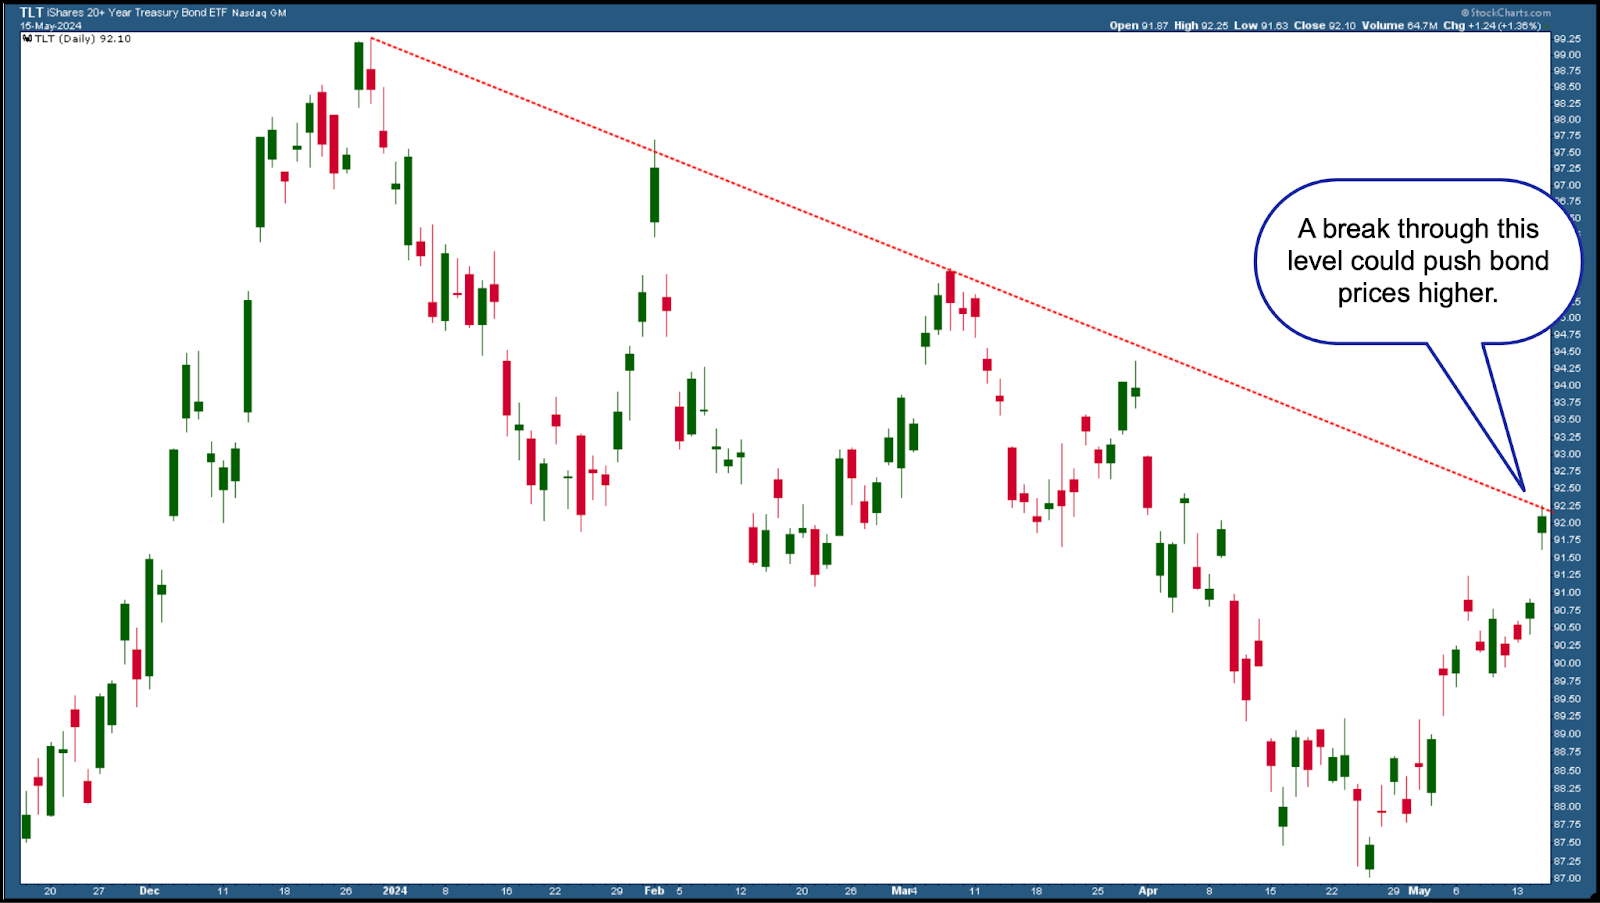
Chart 1. Daily stock chart of the 20+ Year Treasury Bond ETF (TLT). Bond prices have risen and are currently testing key resistance levels. A bond bull market comes into focus when prices break above the resistance of the downward trend line.Chart source: StockCharts.com. For educational purposes.
The stock market is technically strong. Given that it has hit a new high, it is worth watching to see if there are any signs of a trend reversal or if momentum is slowing.
Click here to see live charts.

that much Linear Regression Prediction The (LRF) indicator is overlaid on the S&P 500 chart (see below) and indicates that the S&P 500 is trending upward. The S&P 500 closed above the LRF line, well above the 50-day line. simple moving average.
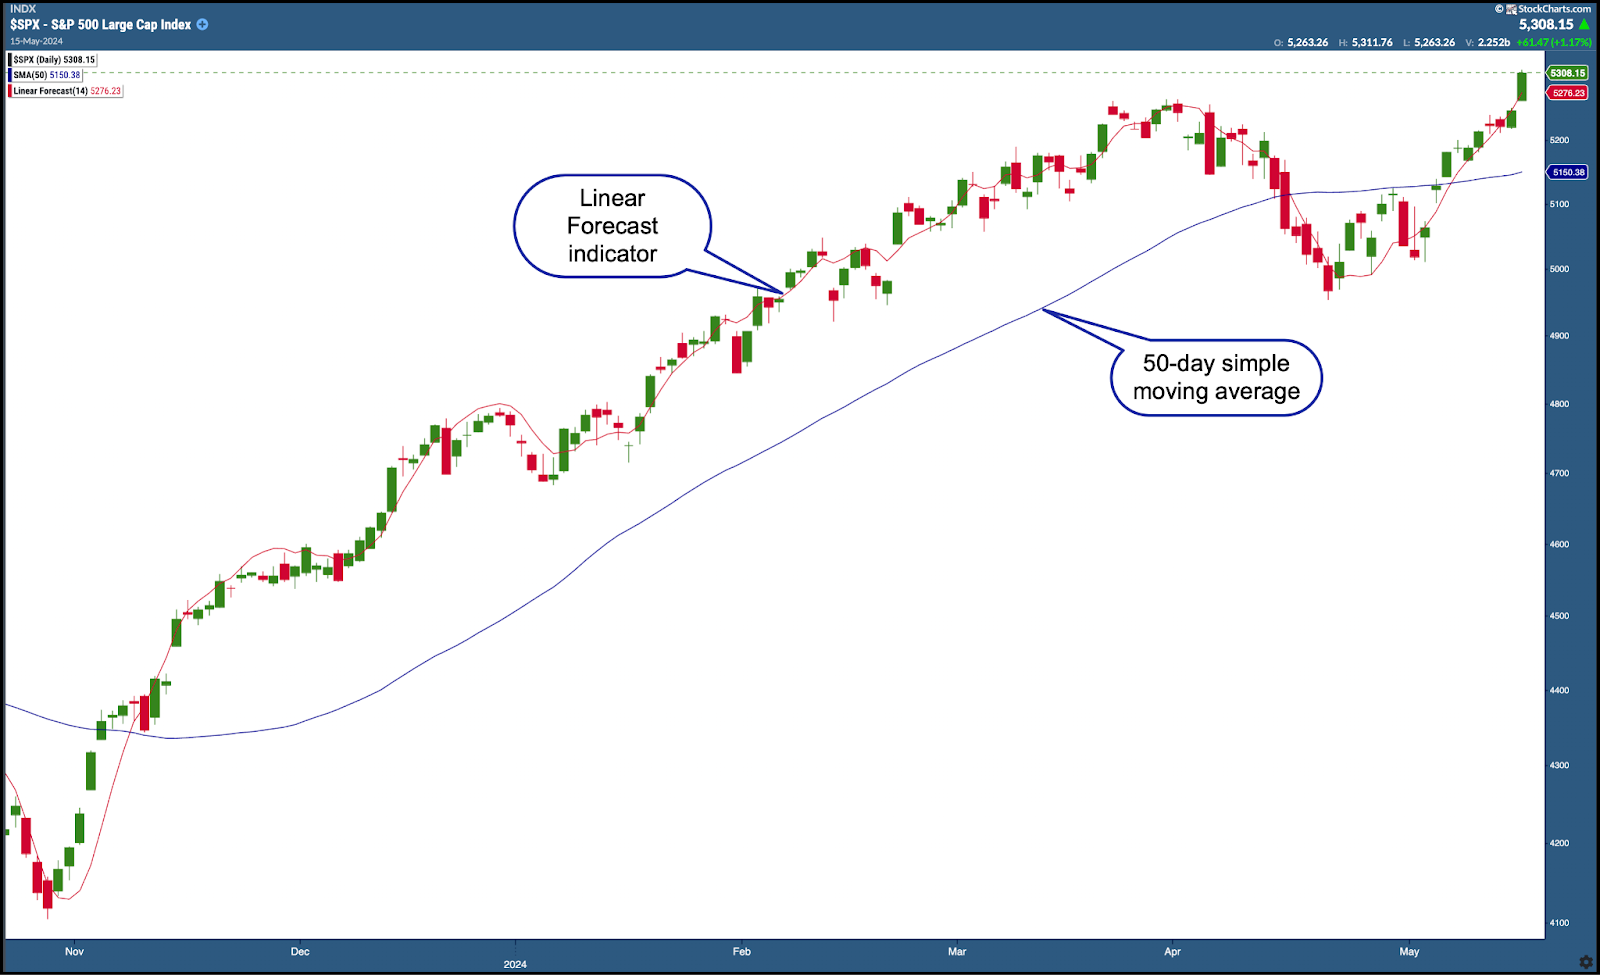
Chart 2. S&P 500 Index ($SPX) daily chart. Technically, the S&P 500 looks strong. It is trending upward, above the LRF line and well above the 50-day moving average.Chart source: StockChartsACP. For educational purposes.
As long as this scenario holds, the S&P 500 is expected to continue rising.
Click here to see live charts..
Another sector showing strength is precious metals. As you can see from the SPDR Gold Shares ETF (GLD) below, gold is heading toward all-time highs.
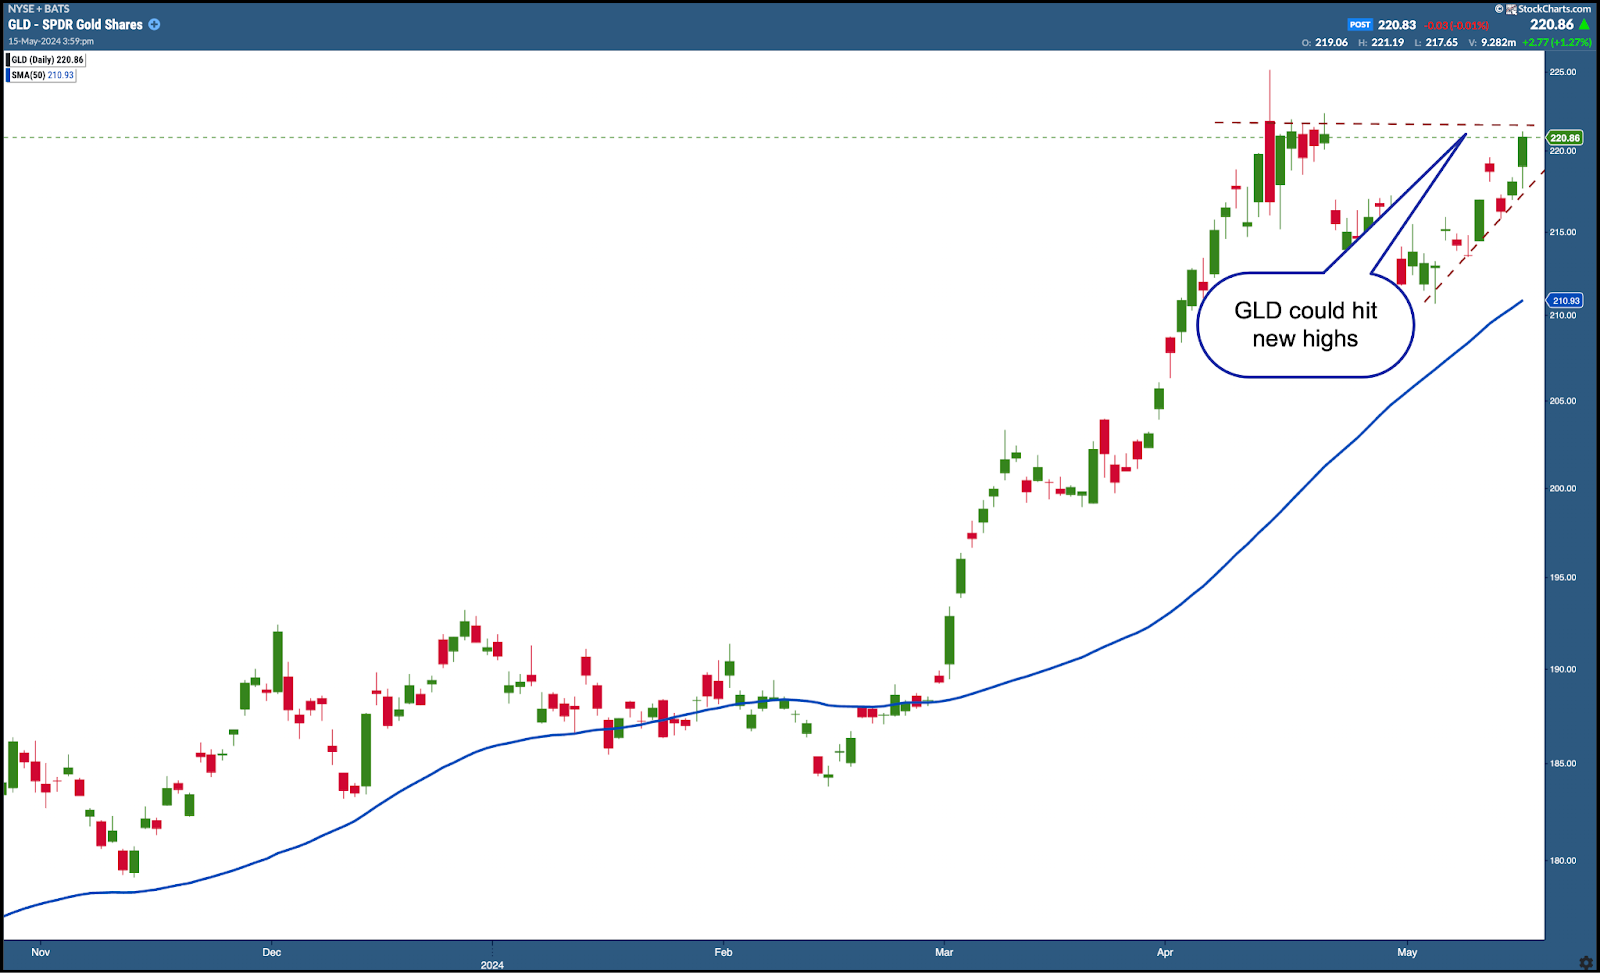
Chart 3. Gold continues to sparkle. Gold prices are near all-time highs. It could rise with the stock if the price breaks past previous highs. Chart source: StockChartsACP. For educational purposes.
Gold could break previous highs and continue rising. It’s rare to see a correlation between gold and stocks, but as long as the trend is higher, you may be able to take advantage of these moves.
Click here to see live charts.
Silver looks more interesting than gold. We need to look at the long-term silver charts to see if we are testing the 2020 and 2021 highs. A break above this level could see it reach the 2011 high (see chart below). Watch it and consider adding it to your portfolio.
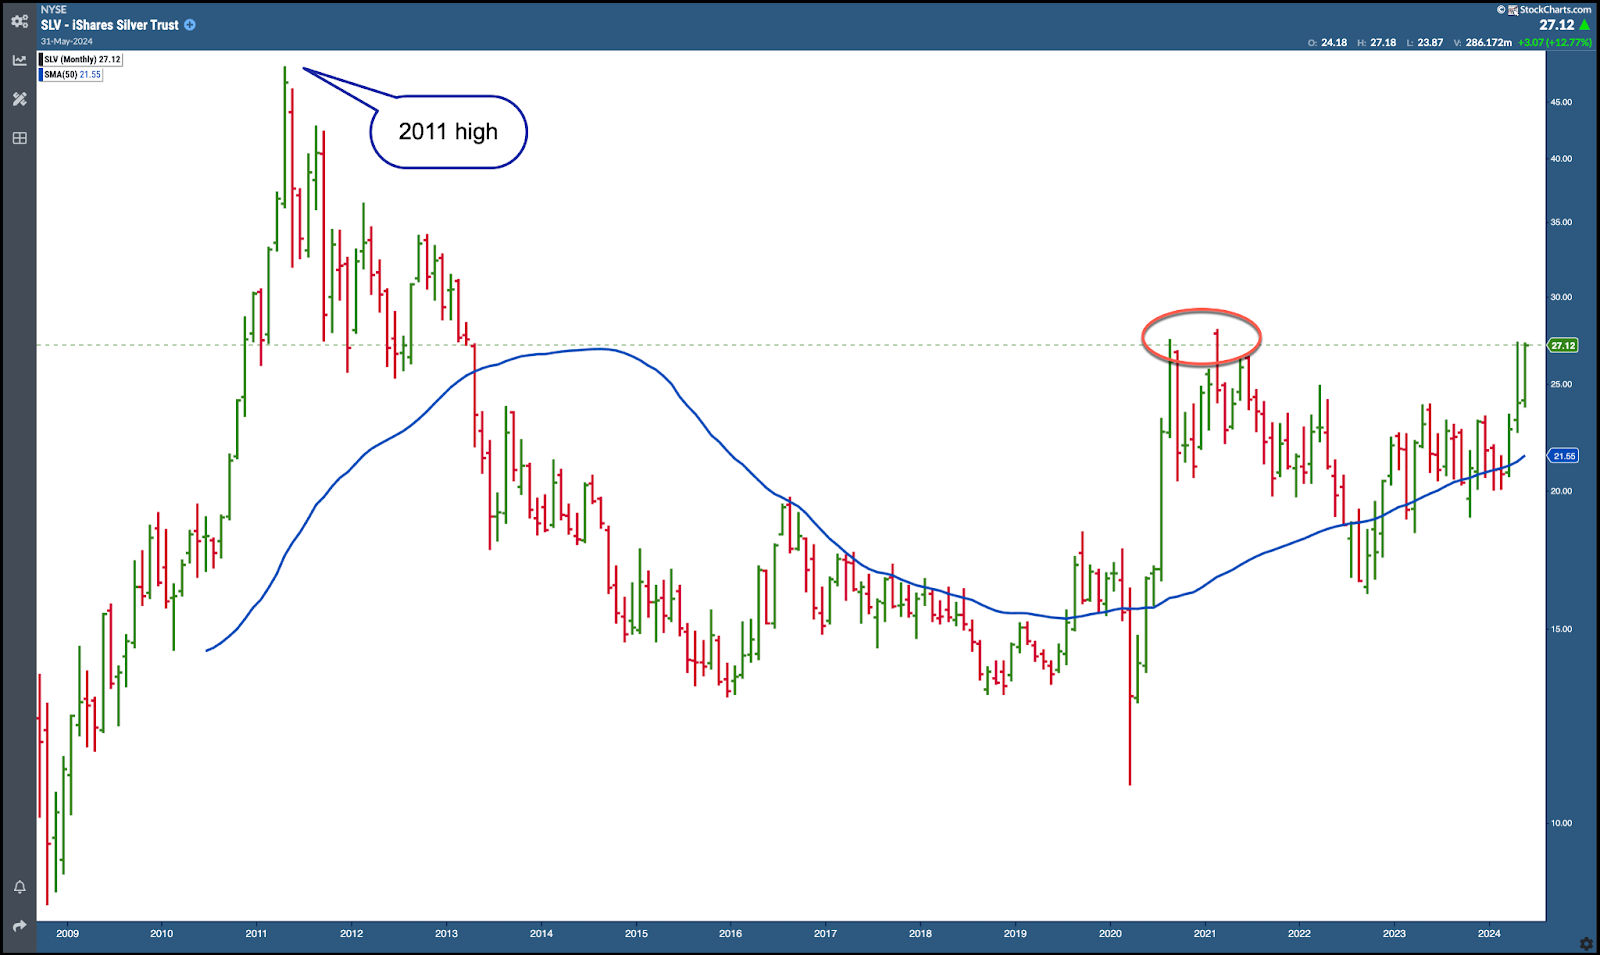
Chart 4. Silver rises. Silver is retesting previous highs. Will it break through and reach its 2011 peak?Chart source: StockChartsACP. For educational purposes.
take out
Overall, I think the wait paid off. The inflation data injected optimism into markets and lifted stocks, bonds, precious metals and Bitcoin. The bull market is still here. Investors are confident about the stock market and optimism remains positive.

disclaimer: This blog is for educational purposes only and should not be construed as financial advice. You should not use any of our ideas and strategies without first evaluating your personal and financial situation or consulting a financial professional.

Jayanthi Gopalakrishnan is the Director of Site Content at StockCharts.com. She spends her time creating content strategies, providing content to educate traders and investors, and finding ways to make technical analysis fun. Jayanthi was the Editor-in-Chief of T3 Custom, a content marketing agency for financial brands. Prior to that, she served as editor-in-chief of Stocks and Commodities Technical Analysis magazine for over 15 years. Learn more


")
