Solana’s 20-Day EMA Crossover – Here’s What It Means for SOL Price

- The price of SOL rose above the 20-day EMA on the May 15 chart.
- This indicates that selling pressure has decreased.
Solana (SOL) price crossed above the 20-day exponential moving average (EMA) during the intraday trading session on May 15. This indicates an increase in new demand for altcoins.
This crossover is noteworthy because it confirms that SOL’s prevailing price has bounced above its average price over the past 20 days. This also signaled a shift towards buying momentum and an upward trend in altcoin prices.
SOL is ready for more
At press time, SOL was valued at $163.28, registering a 13% price increase in the past 24 hours. Key technical indicators evaluated on 1-day charts have confirmed the likelihood of altcoins maintaining this rally in the near term.
First of all, SOL’s relative strength index (RSI) showed an upward trend to 59.20 at press time, predicting an increase in buying momentum. Additionally, the funds flow index (MFI) recorded 55.29.
The values of these indicators confirmed that SOL traders prefer to accumulate their holdings rather than sell them for a profit.
Additionally, the coin’s Awesome Oscillator posted green upward bars, confirming the bullish trend at press time.
This indicator measures the market momentum of an asset and identifies potential trend reversals in its price. A green upward bar, which often appears after a period of consolidation or downtrend, indicates that buyers are in control of the market and asset price appreciation may continue.
The coin’s Elder-Ray index was also positive, lending credence to the aforementioned position. At press time, the figure was 23.59, showing the dominance of bull power in the SOL market.
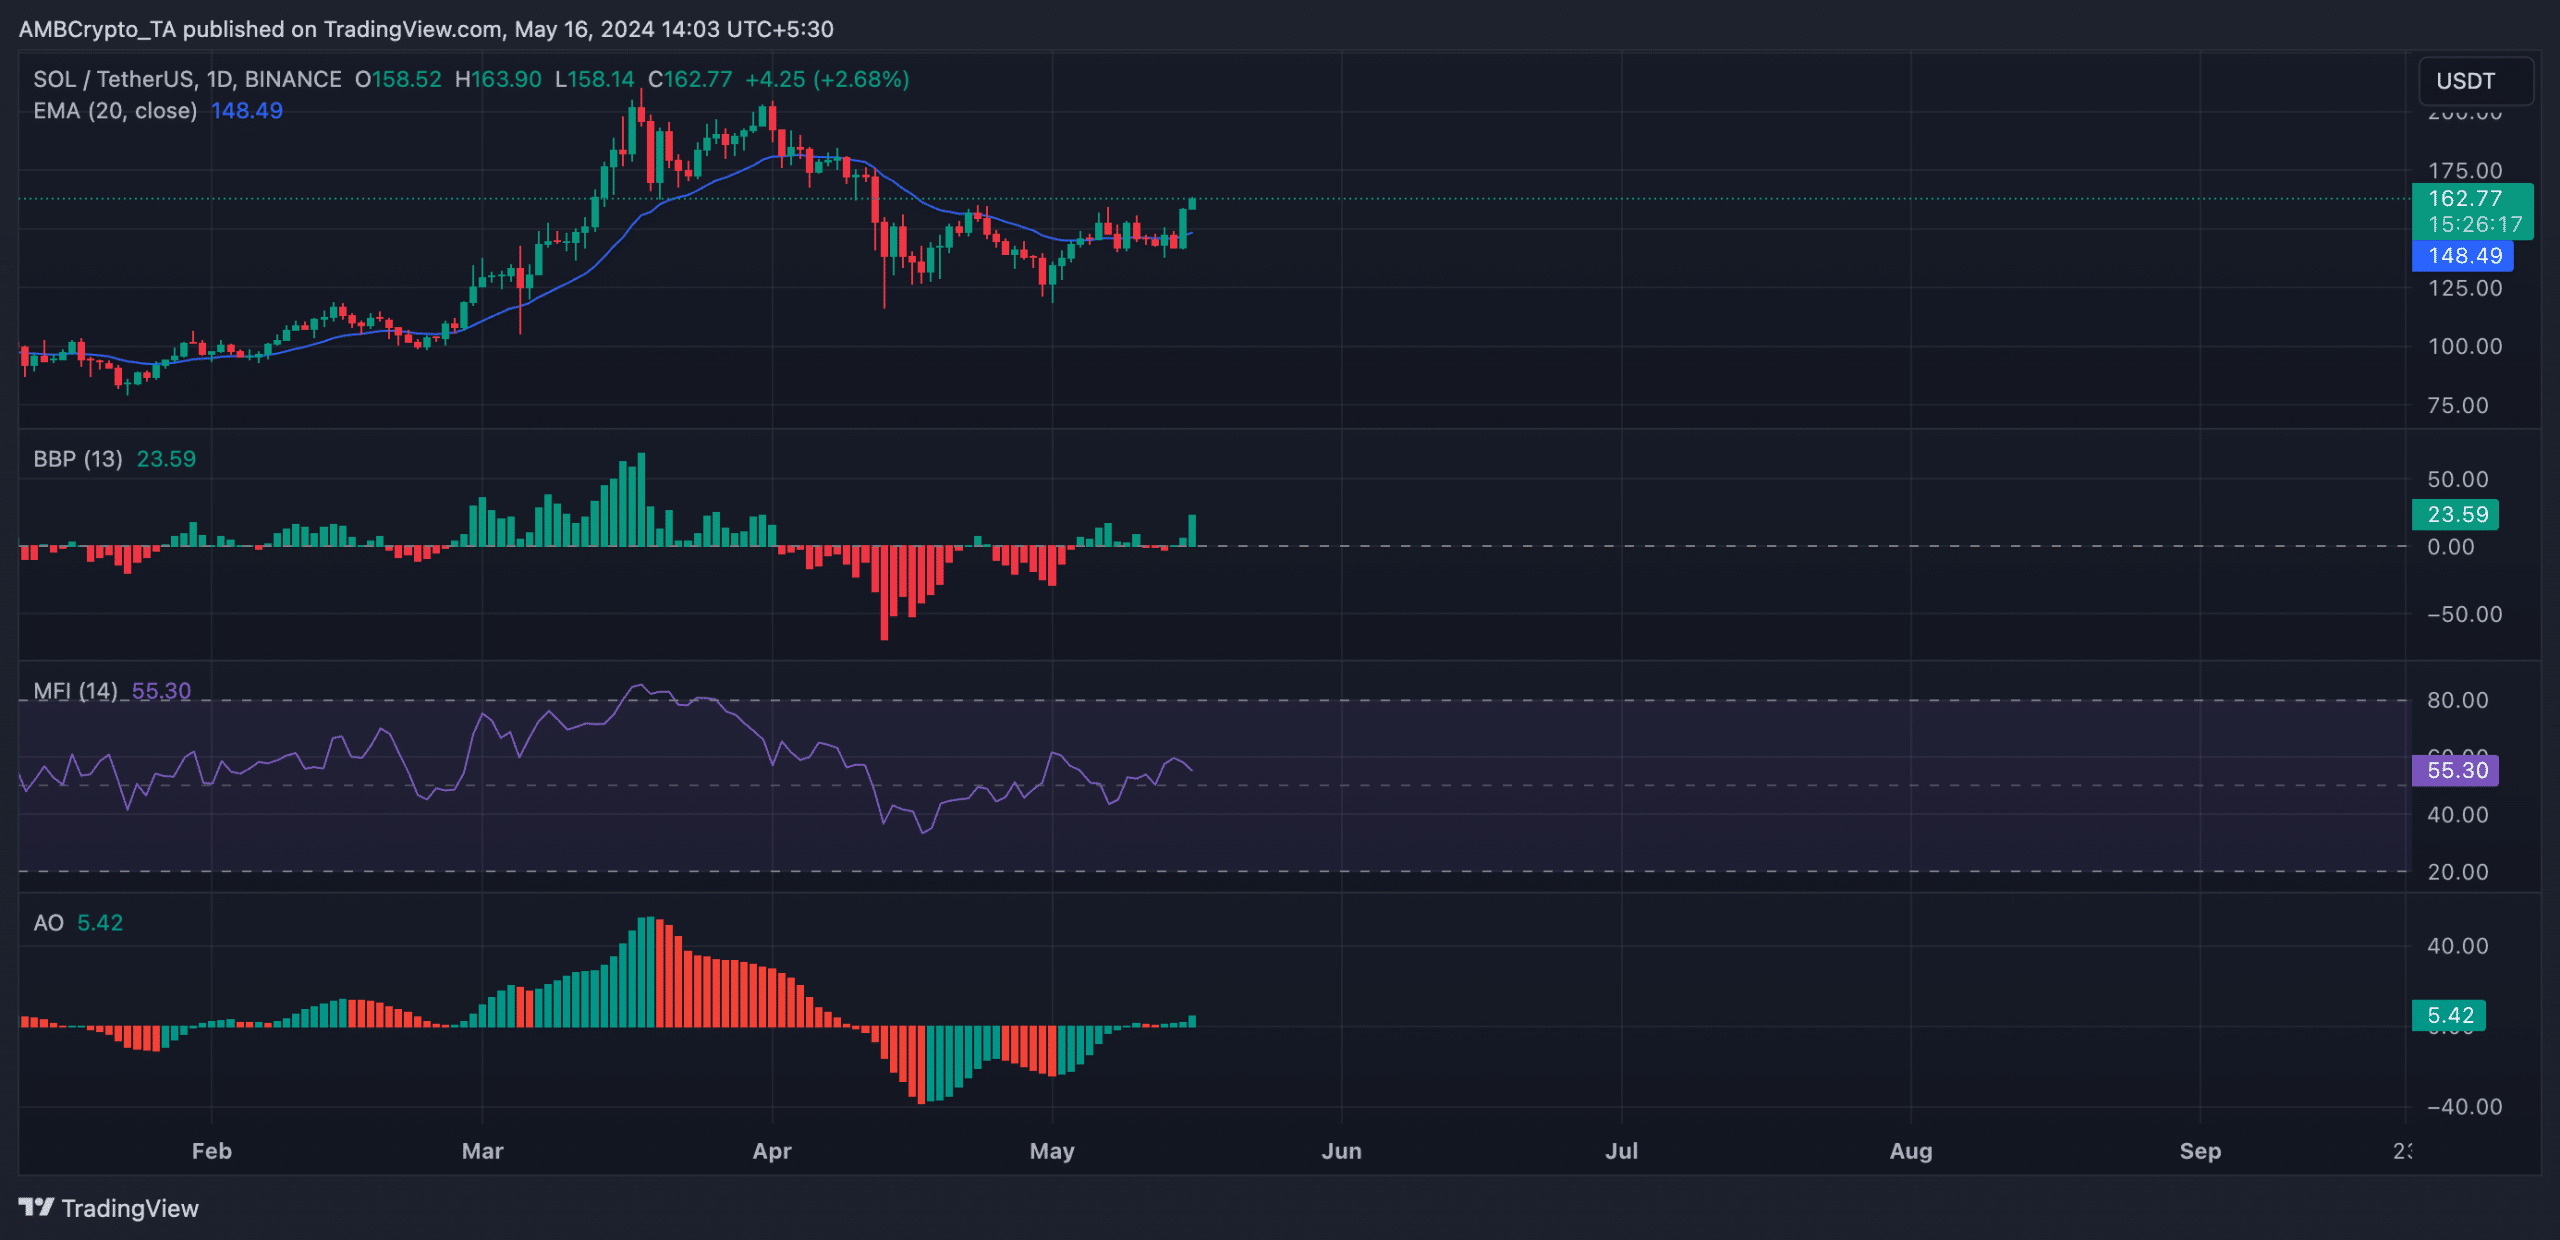
Source: SOL/USDT on TradingView
SOL’s weighted sentiment also turned positive for the first time since April 4, highlighting the growth of the bullish trend following the crossover.
In fact, according to data from Santiment, the coin’s weighted sentiment at the time of writing was 0.263.
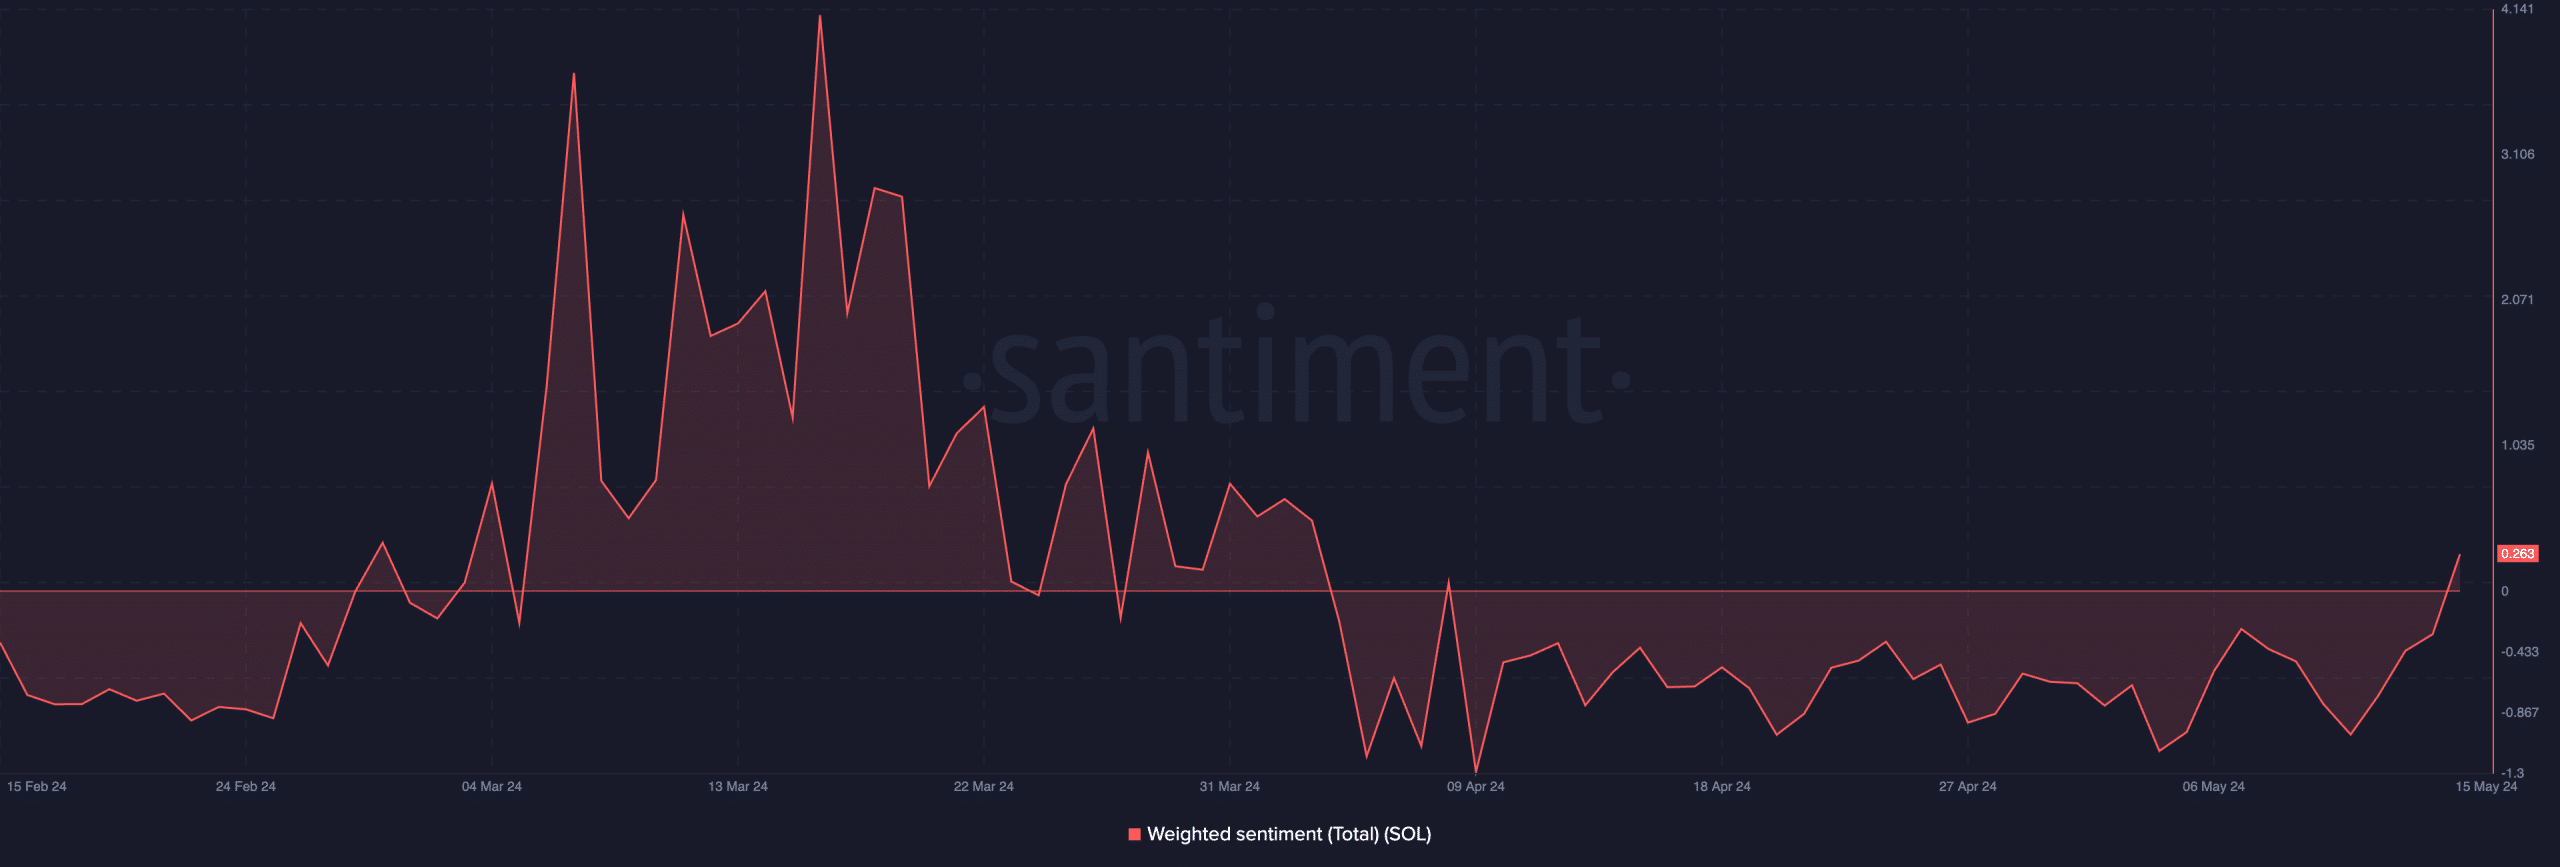
Source: Santiment
Realistic or not, the market cap of SOL in BTC terms is:
Don’t get carried away
Increased market volatility has also been accompanied by a sharp increase in new demand for SOL. Reading the coin’s Bollinger Bands shows that the gap between the upper and lower bands of the indicator has started to widen.
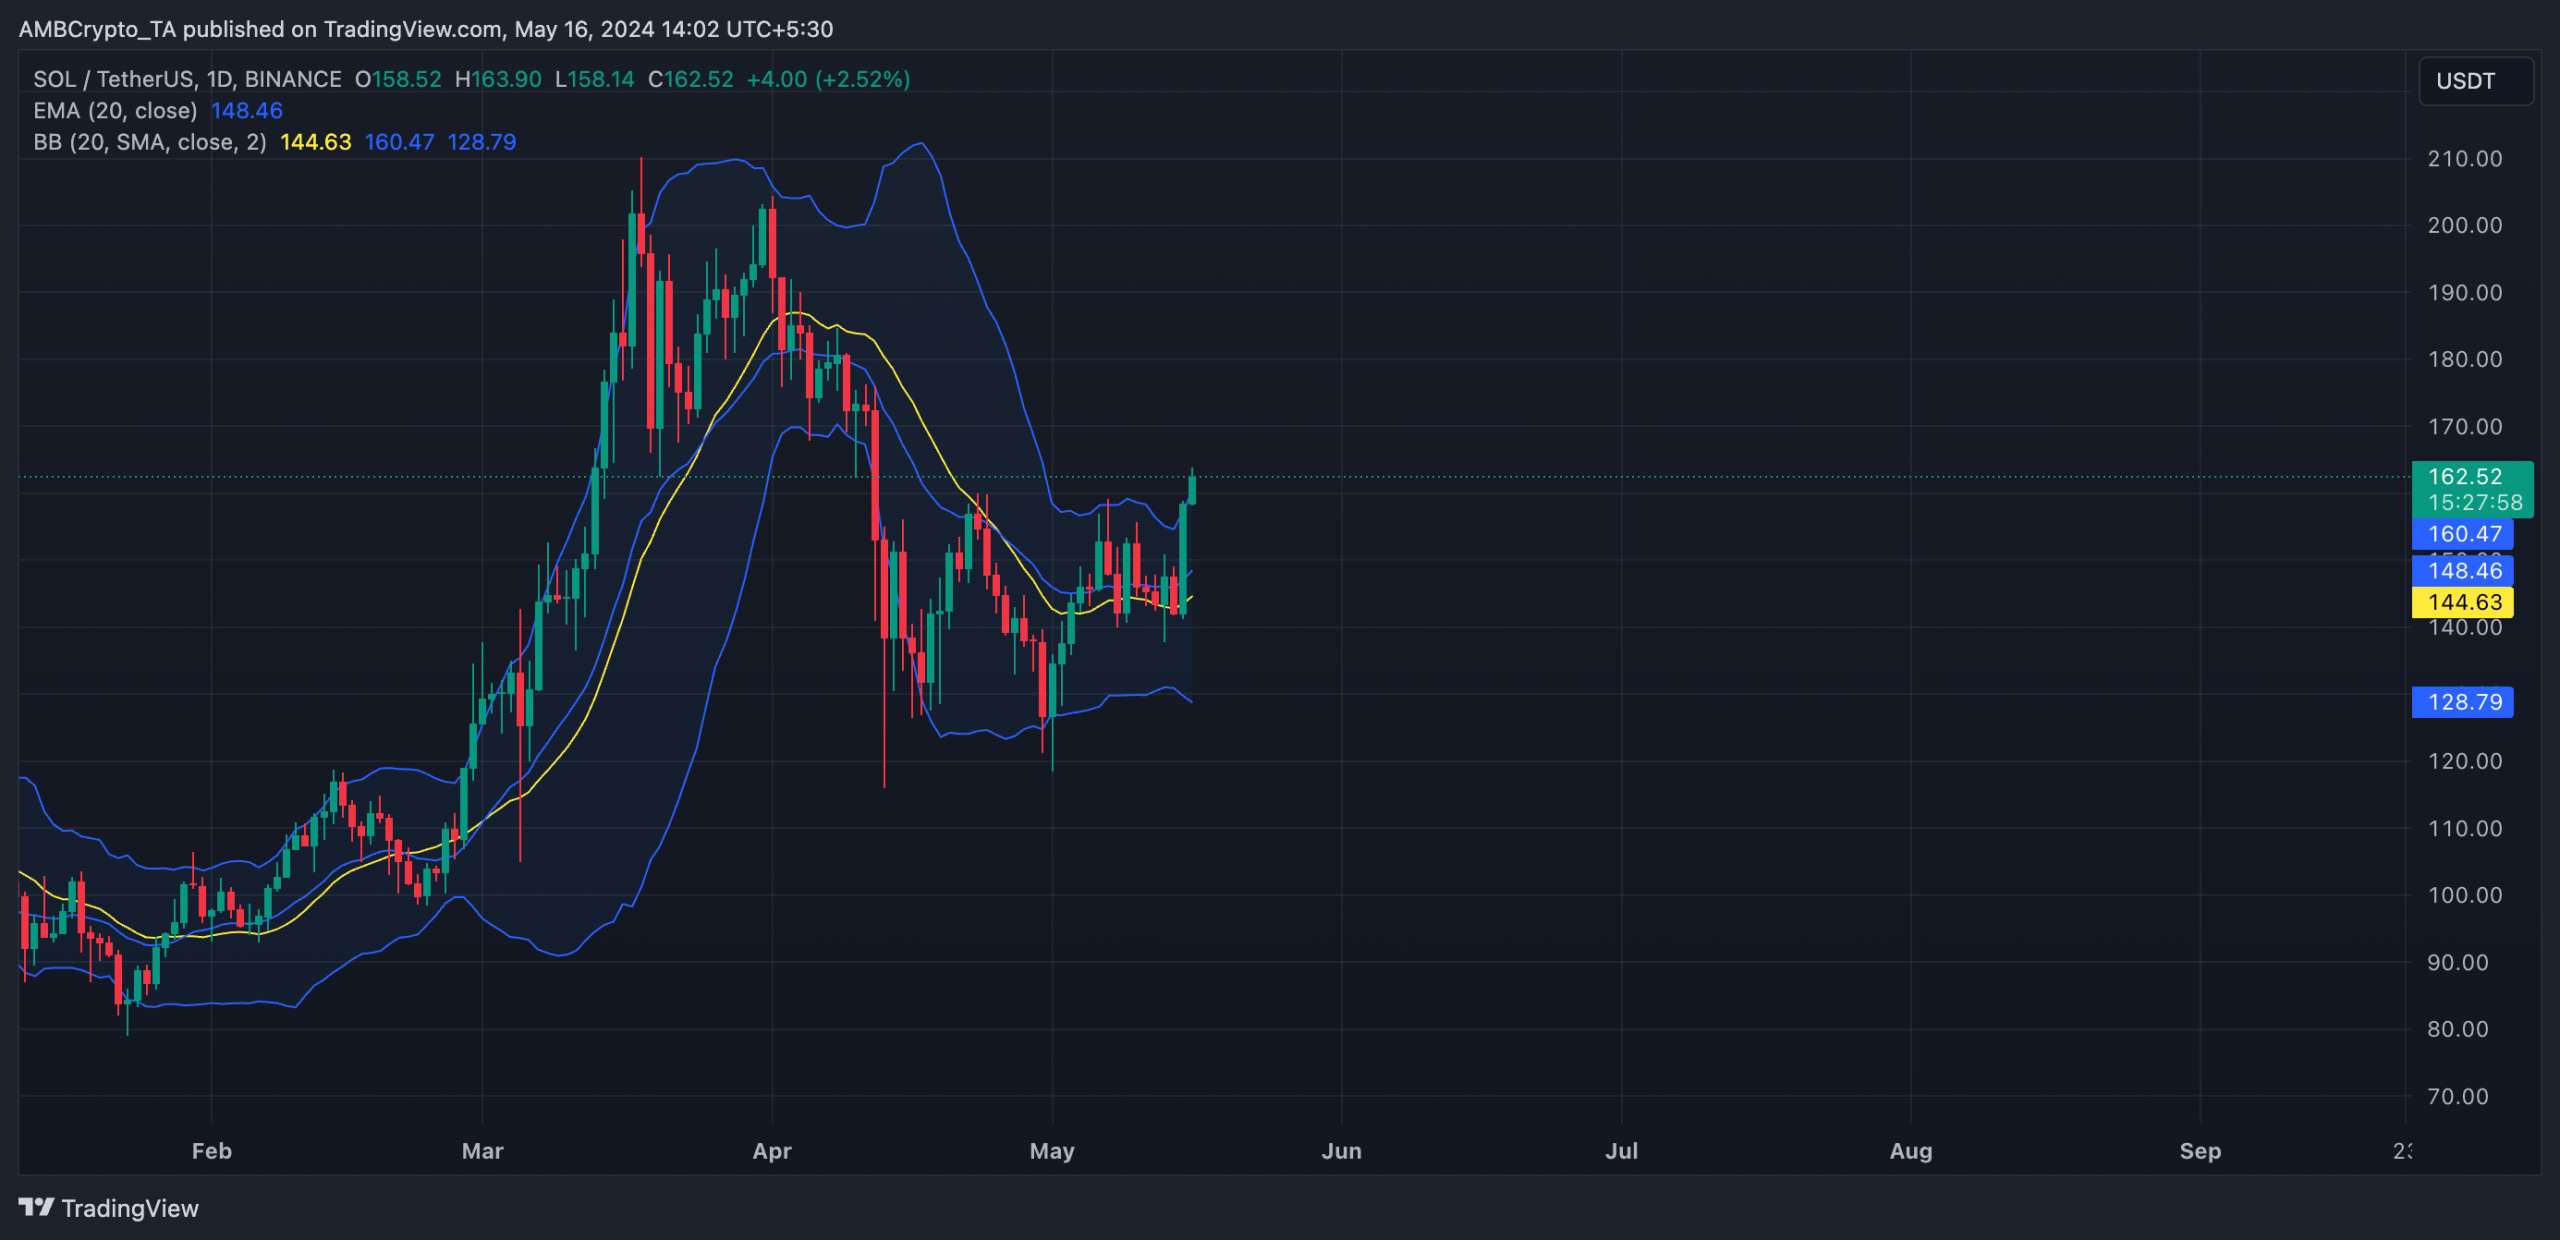
Source: SOL/USDT on TradingView
In this way, as the gap between these bands widens, the prices of crypto assets become more volatile and can record fluctuations in either direction.
Source: https://ambcrypto.com/solanas-20-day-ema-crossover-heres-what-it-means-for-sols-price/