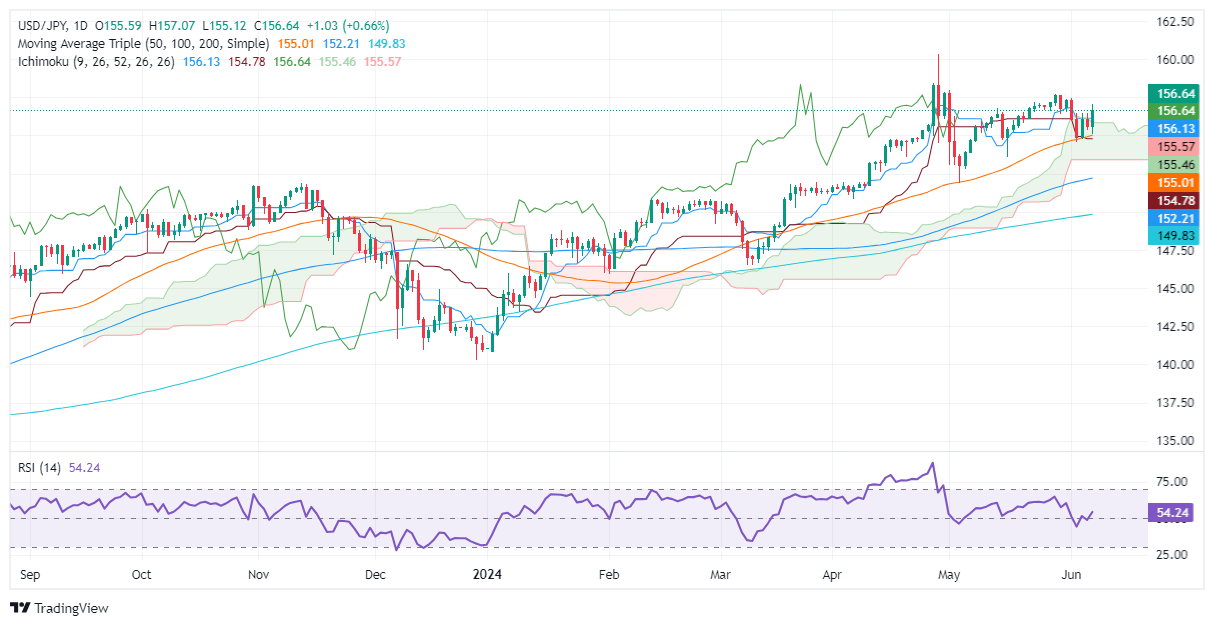
A breakout of Kumo and buyers target 157.00.

- USD/JPY rises above 156.50 as buyers push the price above the Ichimoku Cloud.
- Resistance is the June 4th high (156.48), 157.00, the April 26th high (158.44), and the YTD high (160.32).
- Supported by Senkou Span A and B (155.52/45), 50-DMA (154.98), and Ichimoku Cloud Base (153.40/50).
USD/JPY recorded a slight gain of 0.66% on Friday after a stronger-than-expected US jobs report, which reduced the chances of the US Federal Reserve easing policy this year. The pair is therefore trading at 156.64 after breaking off the low of 155.12.
USD/JPY Price Analysis: Technical Outlook
From a daily chart perspective, USD/JPY continues to consolidate and is trending slightly higher. The pair rose above Ichimoku Cloud (Kumo), indicating buyer strength.
Momentum has turned bullish, but the threat of intervention from Japanese authorities could lead to increased volatility in the currency pair.
If USD/JPY breaks the June 4 high of 156.48, it could rise to 157.00. With further strength, the next supply zone would be the April 26 high at 158.44, followed by the year-to-date (YTD) high at 160.32.
Conversely, if USD/JPY falls below 156.00, the first support point will be the Senkou Span A and B confluence at around 155.52/45 followed by a test of the 50-day moving average (DMA) at 154.98. A breach of the latter exposes the bottom of the Ichimoku Cloud (Kumo) at approximately 153.40/50.
USD/JPY price action – daily chart

Japanese yen price today
The table below shows the rate of change of the Japanese Yen (JPY) against the major currencies listed today. The Japanese yen was the strongest against the New Zealand dollar.
| USD | EUR | GBP | yen | cad | AUD | new zealand dollar | Swiss Franc | |
|---|---|---|---|---|---|---|---|---|
| USD | 0.82% | 0.53% | 0.67% | 0.62% | 1.27% | 1.47% | 0.81% | |
| EUR | -0.82% | -0.27% | -0.14% | -0.19% | 0.46% | 0.72% | 0.01% | |
| GBP | -0.53% | 0.27% | 0.14% | 0.08% | 0.74% | 0.99% | 0.27% | |
| yen | -0.67% | 0.14% | -0.14% | -0.05% | 0.59% | 0.81% | 0.15% | |
| cad | -0.62% | 0.19% | -0.08% | 0.05% | 0.65% | 0.92% | 0.19% | |
| AUD | -1.27% | -0.46% | -0.74% | -0.59% | -0.65% | 0.25% | -0.48% | |
| new zealand dollar | -1.47% | -0.72% | -0.99% | -0.81% | -0.92% | -0.25% | -0.71% | |
| Swiss Franc | -0.81% | -0.01% | -0.27% | -0.15% | -0.19% | 0.48% | 0.71% |
Heatmap shows the percentage change between major currencies. The base currency is selected from the left column and the quote currency is selected from the top row. For example, if you select Japanese Yen in the left column and move along the horizontal line to US Dollars, the percentage change displayed in the box represents JPY (base)/USD (quote).
Source: https://www.fxstreet.com/news/usd-jpy-price-analytic-breaks-above-kumo-buyers-target-15700-202406071940


