Harami – Price Action Patterns – Analysis and Forecast – December 14, 2023

That guy price action The pattern is a two candle pattern that indicates market indecision and is mainly used for breakout trades. Since one candle is formed within the range of the previous candle from high to low, it is also called ‘internal candle formation’. Below is an example of bearish and bullish harami candle formation.
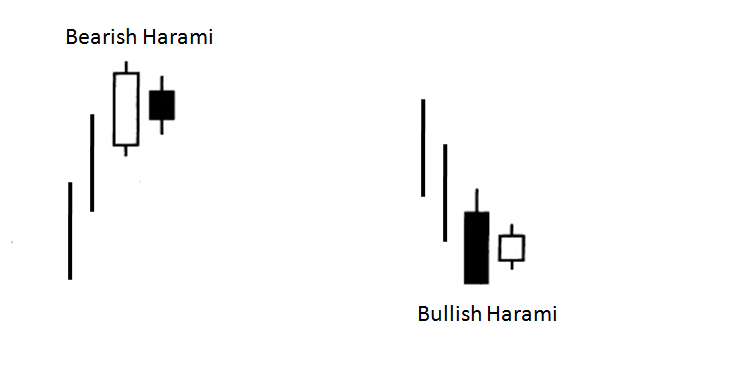
A bearish harami is formed when the high to low range of a seller candle develops within the high and low range of the previous buyer candle. Since it has failed to form new highs in succession, a bearish harami indicates market indecision, which could lead to a bearish breakout.
A bullish harami is formed when the high to low range of a buyer candle develops within the high and low range of the previous seller candle. Due to the failure to make new lows in succession, a bullish harami signals market indecision, which could lead to a bullish breakout.
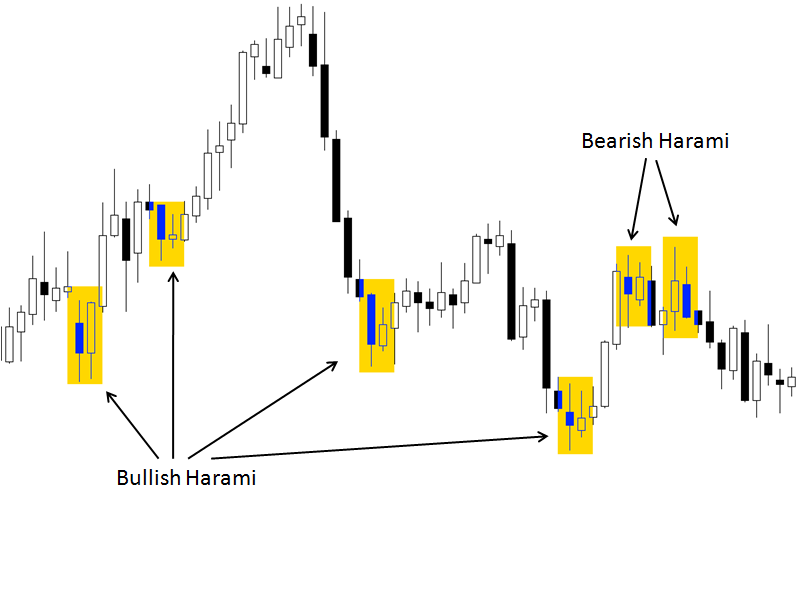
Below are some examples of bullish and bearish harami patterns that form over a period of time.
So how can you trade these patterns with a price action trading strategy? There are many ways, but no one is perfect. However, many traders use it as a standalone breakout pattern. Here are some rules you can build on:
Trading the bullish Harami pattern:
1. Identify a bullish harami pattern (a range of highs and lows of a buyer candle that occurs within the range of highs and lows of a previous seller candle).
2. Enter one pip above the previous high point. candle.
3. Set a stop loss 1 pip below the low of the previous candle (to give the trade some breathing room).
4. Aim for a one-to-one reward for risk. This means targeting the same amount of pips you are risking from your entry price to your stop loss price.
5. If trading has not started due to the opening of a new candle, cancel the order. Once a trade is initiated, leave it in the market until a stop loss or target level is reached.
Here’s an example of what the chart would look like based on the rules above:
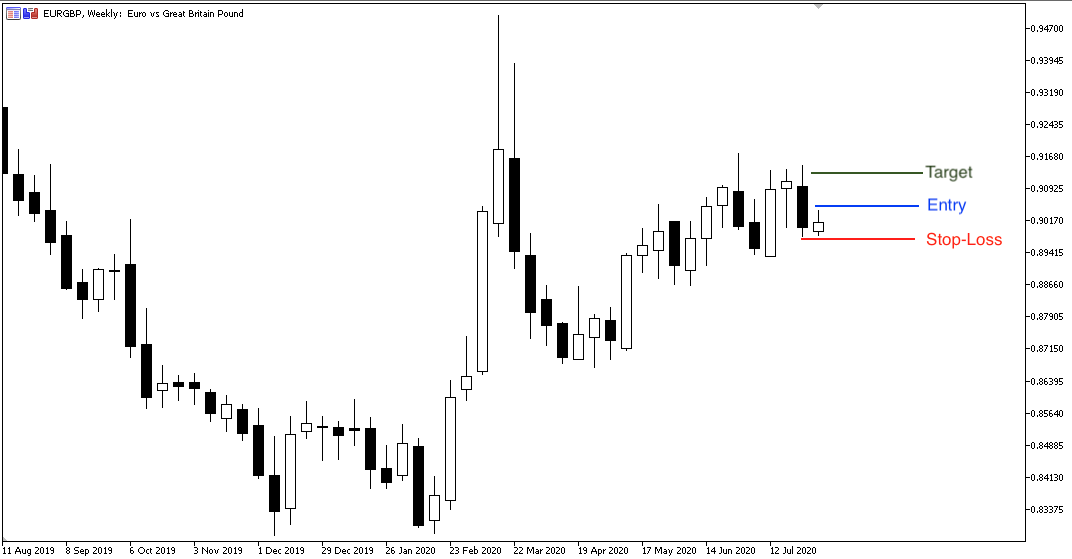
In the EUR/GBP chart above, a bullish harami has formed. Using the rules above, you can have an entry price higher than the high of the last candle, and a stop loss at the low of the previous candle. If your order is not executed when the next bar opens, you can simply cancel the order and look for the next trade. If it is triggered, your stop loss or target level will exit you with a profit or loss.
Bearish Harami price action pattern trading:
1. Identify a bearish harami pattern (a range of high and low points of a seller candle that develops within the range of high and low points of the previous buyer candle).
2. Enter 1 pip below the low point of the last candle.
3. Set a stop loss 1 pip above the high of the previous candle (to give the trade some breathing room).
4. Aim for a one-to-one reward for risk. This means targeting the same amount of pips you are risking from your entry price to your stop loss price.
5. If trading has not started due to the opening of a new candle, cancel the order. Once a trade is initiated, leave it in the market until a stop loss or target level is reached.
Subscribe to learn more about price action trading and other trading-related topics. our channel.


