Easy Toolbar MT5: User Guidelines – Other – 28 November 2024

This Guidelines includes:
Click the link to go to section you want to read
I. Overview
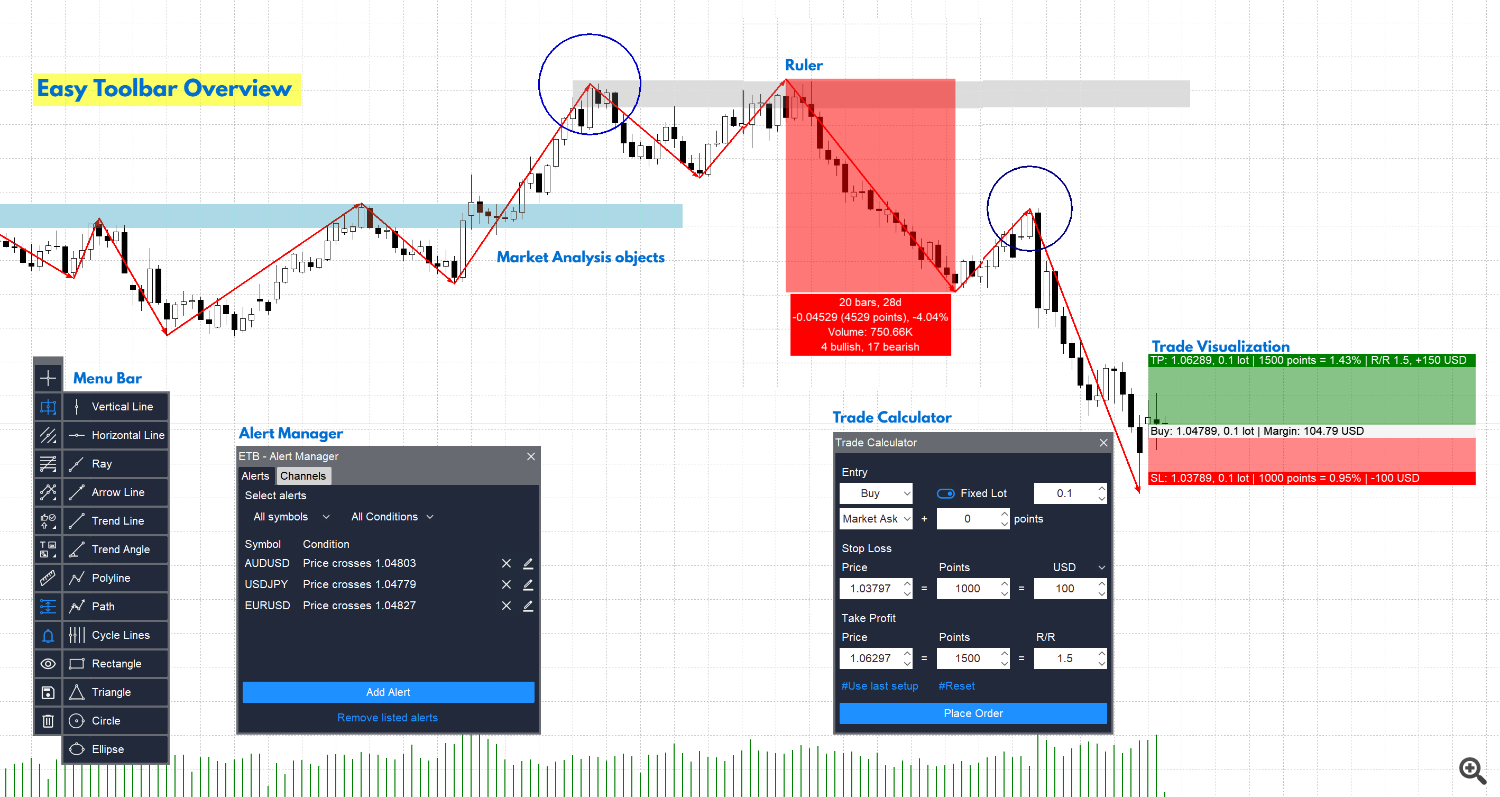
Easy Toolbar is a feature-rich but user-friendly toolkit that you can use to analyze market with Market Analysis tools, get notifications with Alert Manager, calculate your trade factors with Trade Helper and some other miscellaneous.
This toolkit helps you analyze market and trade faster, more accurate and much easier by:
- Re-invent the way to use market analysis tools
- Add new important market analysis tools
- Provide Ruler tool to measure chart quickly
- Provide Trade Helper tool to calculate and place order
- Provide Alert Manager tool to setup and mange alerts
- Miscellaneous features
Quick notes:
- This toolkit works as an Expert Adviser
- When adding Easy Toolbar into chart, Menu Bar appears on the left. You can access all tools from this menu bar
- You need to Allow Algo Trading for this toolkit as Trade Helper tool need this right to makes trades
- This toolkit works with all symbols and timeframes in multi-windows and multi-charts
- We tried to make this toolkit simple and easy to use. We expect you know how to use it when you see it. However, please spend some times to read sections below to understand everything clearly
II. Input setup guidelines
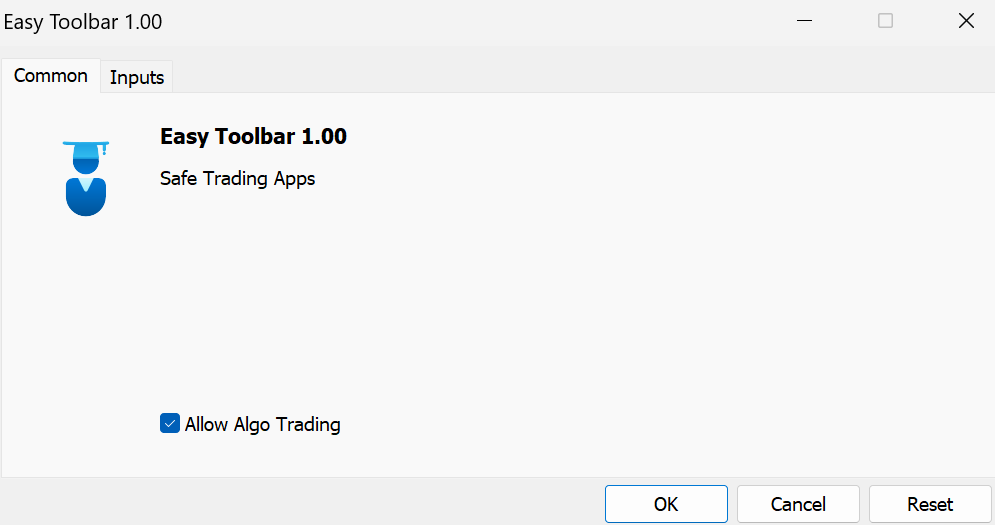
When you add Easy Toolbar into your chart, please remember to check “Allow Algo Trading” option in Common tab. The toolkit needs this right to help you make trades by Trade Helper tool
In the Inputs tab, you see options to customize some toolkit behaviors and styling. We tried to make them as simple as below
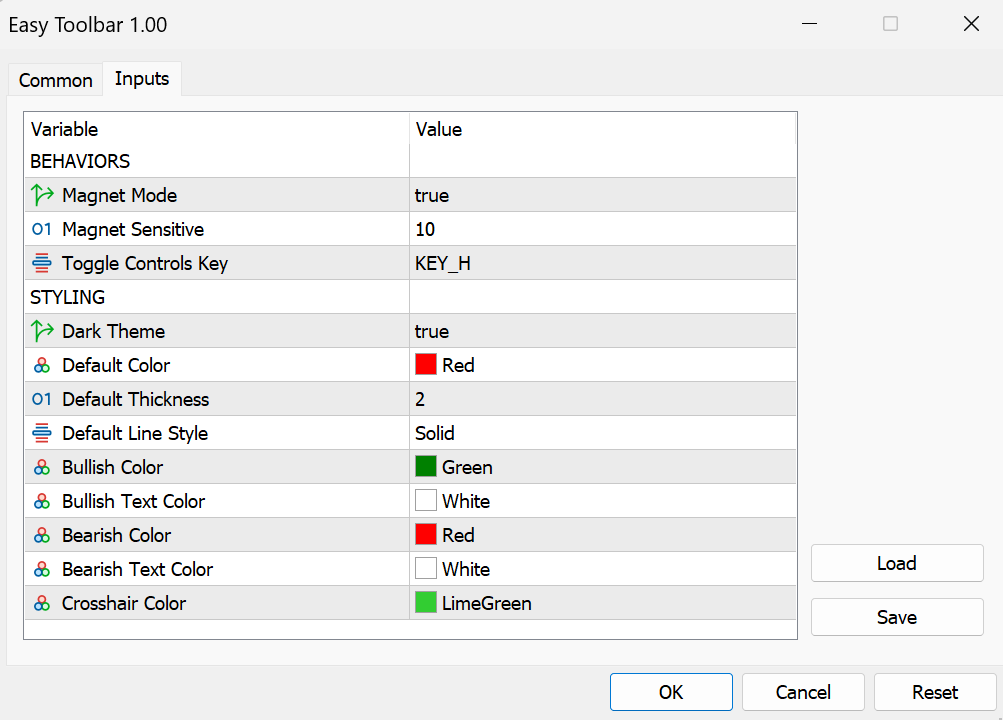
Here is meaning of input above:
- Magnet Mode: Turn on/off magnet mode. Magnet mode is the feature to let object points stick to nearest Open/High/Low/Close values of bars in main window or indicator values in sub-windows when you draw or edit objects and other tools
- Magnet Sensitive: Sensitive level of magnet mode. Higher value for more sensitive. More sensitive means stick to values when the mouse pointer is further
- Toggle Controls Key: Key to toggle on/off the menu bar. Press this key to hide menu bar. Press it again to show menu bar
- Dark Theme: Turn on/off the dark theme (for controls and panels)
- Default Color: Default color of analysis objects
- Default Thickness: Default thickness of analysis objects
- Default Line Style: Default line style of analysis objects
- Bullish Color: Color used for bullish state in some tools (Ruler, Trade Helper…)
- Bullish Text Color: Text color used for bullish information in bullish state
- Bearish Color: Color used for bearish state
- Bearish Text Color: Text color used for bearish information in bearish state
- Crosshair Color: Color of Crosshair lines
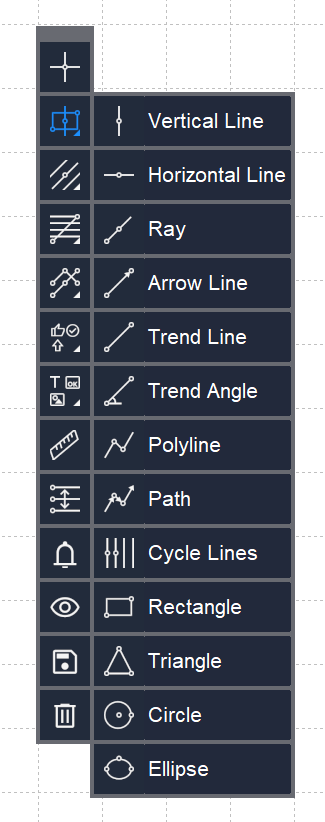
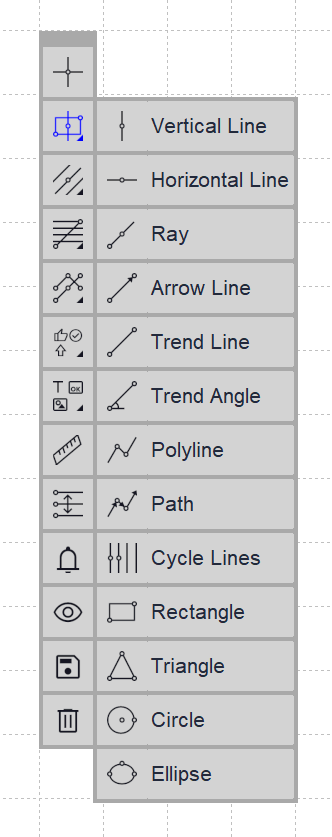
When Easy Toolbar attached to chart successfully, you will see the menu bar in left side of chart with list of tools and able to click on items to show sub-menus as below (in dark mode and light mode):
III. Market analysis tools guidelines
Market analysis tools or objects are provided in MetaTrade by default. These tools are important if you are a trader who are not fully depend on EAs and work to analyze market everyday. However, we can’t say that we love things provided. Because of that, we re-invented the way to use them to made them faster to access, easier to use and more accurate with these improvements:
- Show tools right on chart and well-grouped in menu bar
- Select & draw objects much quicker
- Create objects with live-preview and without mouse pressing
- Show quick setup on finish
- Quick access to friendly Properties panel with live-preview
- Live adjust complex tools that can’t do by default
- Flexible magnet mode for accurate drawing and editing in main window and sub-windows
- And some other tiny things
I believe you’ll love above improvements. They help your work done much faster, easier and more accurate. Easy Toolbar also provide new tools that many traders looking for:
- Advanced Crosshair with important market data right on your mouse
- Polyline to draw multi-trend in one time
- Path to draw multi-trend with direction
- Circle to draw circles (Why this is not provided by default?)
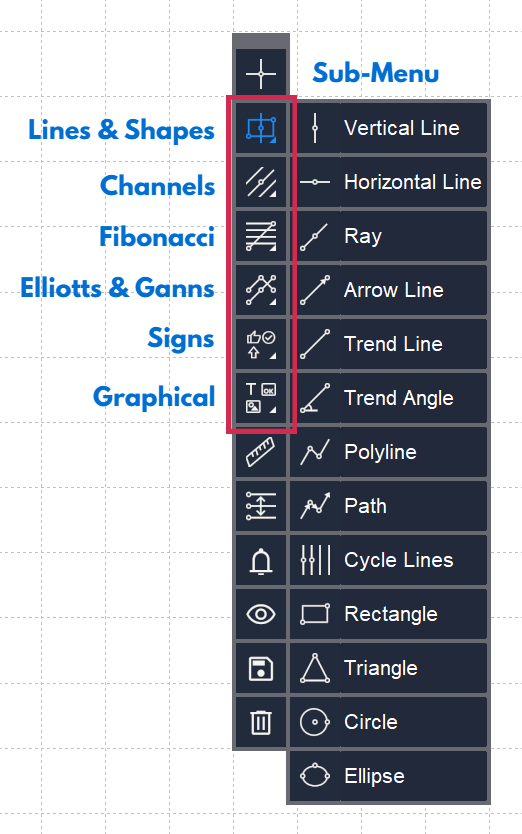
You’ll see these tools in top of menu bar, in sub menu
List of Market Analysis tools:
- Lines & Shapes: Vertical Line; Horizontal Line; Ray; Arrow Line; Trend Line; Trend Angle; Polyline; Path; Cycle Lines; Rectangle; Triangle; Circle; Ellipse
- Channels: Equidistance Channel; StdDev Channel; Regression Channel; Andrew Pitchfork
- Fibonacci: Fibonacci Retracement; Fibonacci Time Zones; Fibonacci Fan; Fibonacci Arcs; Fibonacci Channel; Fibonacci Expansion
- Elliotts & Ganns: Elliot Corrective Wave; Elliott Motive Wave; Gann Line; Gann Fan; Gann Grid
- Signs: Thumb Up; Thumb Down; Arrow Up; Arrow Down; Stop Sign; Check Sign; Left Price Label; Right Price Label; Buy; Sell; And about 200 other symbols that really useful
- Graphics: Text; Label; Button; Chart; Bitmap; Bitmap Label; Edit; Event; Rectangle Label
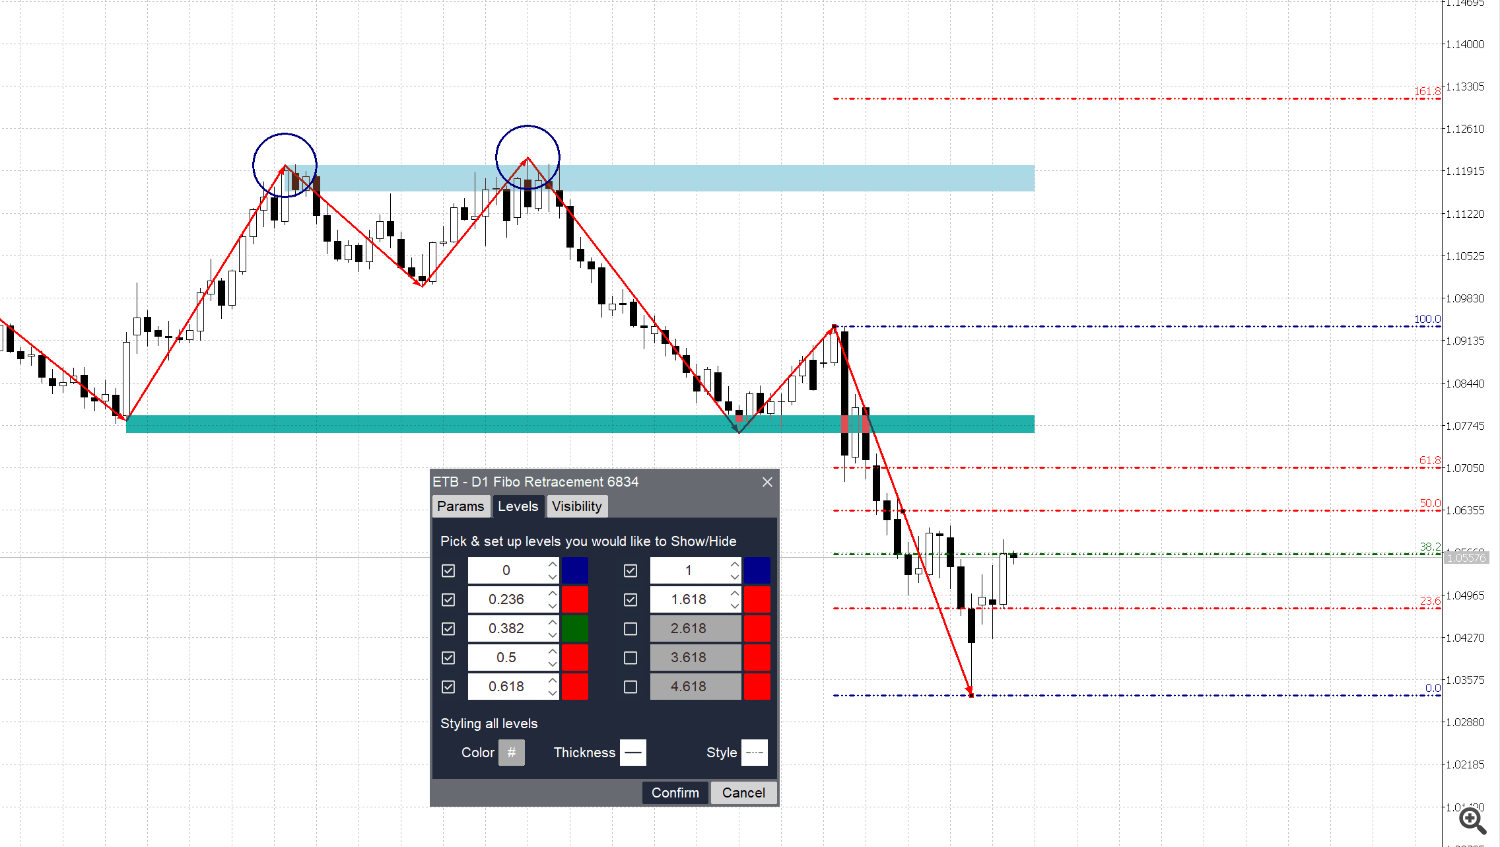
Below is an example of using market analysis tools to analyze market
Draw and Edit market analysis objects
- Click an item in main menu to open sub-menu, select tool/object you want to use
- Click anywhere on chart to start drawing
- Click 1, 2 or 3 points (number of points is depend on object type) on chart to draw, object is live updated when you move your mouse
- Don’t press mouse buttons while you draw, just click on point your want to draw
- Drawing is auto-finished when you click enough points on chart
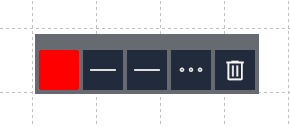
- When finish drawing, there’s a dialog appears right away to allow you update common options (color, thickness, style…). This is Quick Setup dialog. Difference options for difference object types
- Click on point of object and drag it to update object points
Change properties of market analysis objects
- Click on points of an object to select it. Click anywhere on chart to deselect it
- When object is selected, Quick Setup dialog appear
- Click More button (three-dot icon) on Quick Setup dialog to open Properties dialog
- Click Delete button (trash bin icon) on Quick Setup dialog to delete object
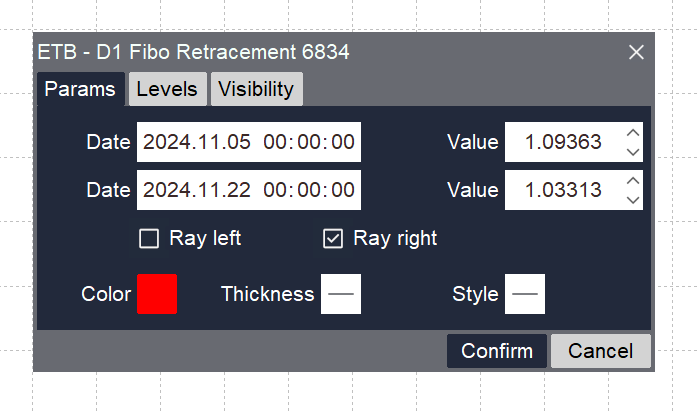
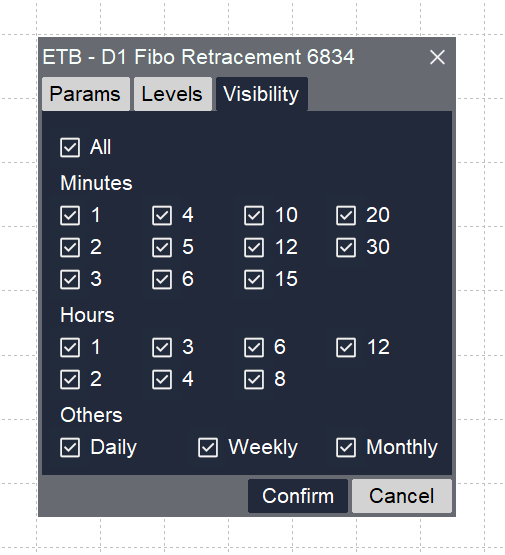
- Properties dialog shows all options/properties you can change. Normally, it has Params tab for main options and Visibility tab for show/hide object based on timeframes
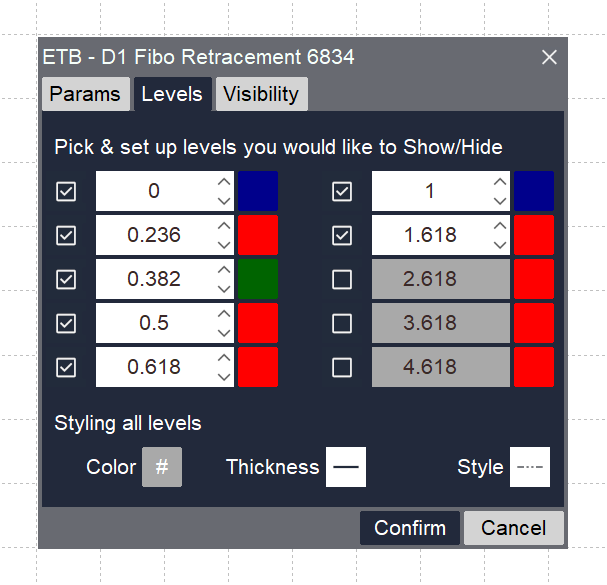
- Properties dialog of Fibonacci tools has Levels tab that allows you to change visibility, color, value of up to 10 levels
- Changes in Quick Setup dialog will be saved automatically
- Changes in Properties dialog will be shown right away for live-preview. However, you need to click Confirm button to save changes. Otherwise, click Cancel button to restore changes
Important notes:
- These tools work in main-window and sub-windows (indicator windows)
- When Properties dialog is open, you can’t select other object or click on menu items or working with other panels
- We keep some default behaviors of objects such as points to select, main options/properties, visibility… but re-arrange to make them cleaner and easier to use
- Polyline and Path are unlimited point objects. You can draw them with just 2 points or as much as you want. When you want to finish, double-click on stop point
- To select Circle object, click on central-top, central-bottom or central-left points
- Don’t use default properties dialog (access via right-click) to change object properties, it may cause conflicts
Below pictures show examples of Quick Setup dialog and tabs in Properties dialog:
IV. Advanced Crosshair guidelines
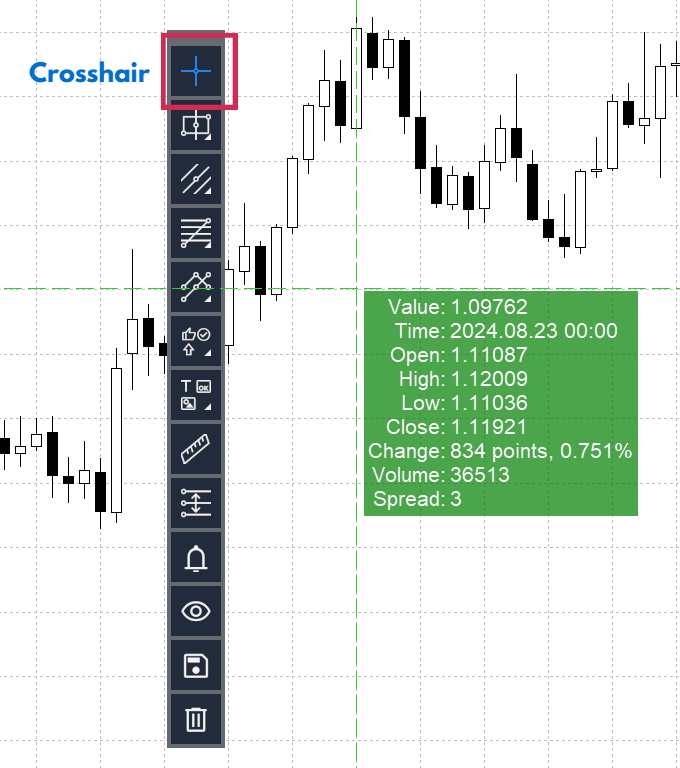
Advanced Crosshair is a crosshair tool that show important information (as you can see in data window) right on your mouse pointer when you hover a bar in main window or indicator windows.
- To start using Advanced Crosshair tool, click on the first item in menu bar to select it, then move your mouse pointer to the bar you want to see information
- Click anywhere on chart to stop using Advanced Crosshair
- You can change colors of this tool via Expert setup inputs
- When hover bars in sub-windows (indicator windows), value information for that indicator but others are for based on the bar in main window
IV. Ruler guidelines
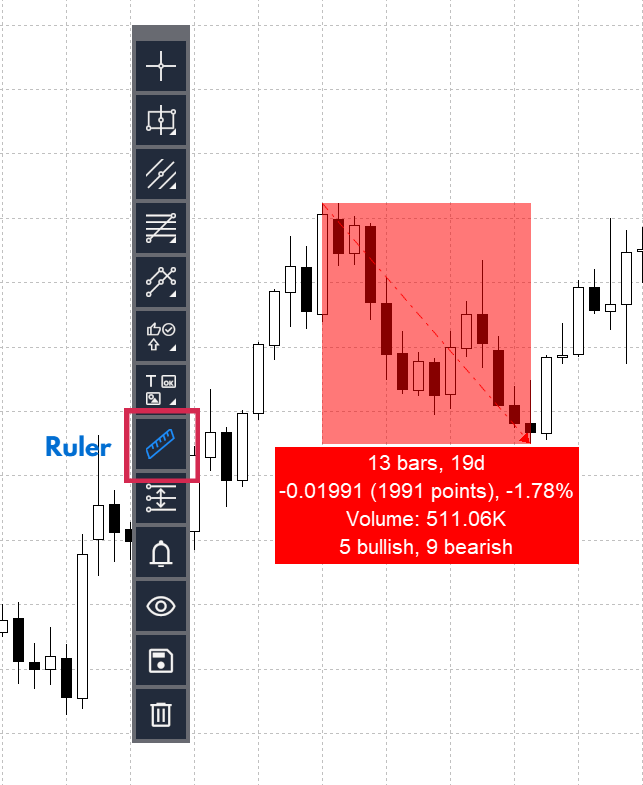
Ruler tool helps you measure 2 points on chart quickly and provide these information:
- Number of bars and duration
- Change in value, points and percent
- Total volume
- Number of bullish and bearish bars
How to use Ruler
- Select Ruler tool on menu bar
- Click on the starting point where you want to start measure
- Move your mouse to the ending point where you want to end measure
- See measure information on the box
- Click anywhere on chart to remove ruler
Important note: Ruler doesn’t work with custom indicators that not provided by MetaTrader by default.
V. Trade Helper guidelines
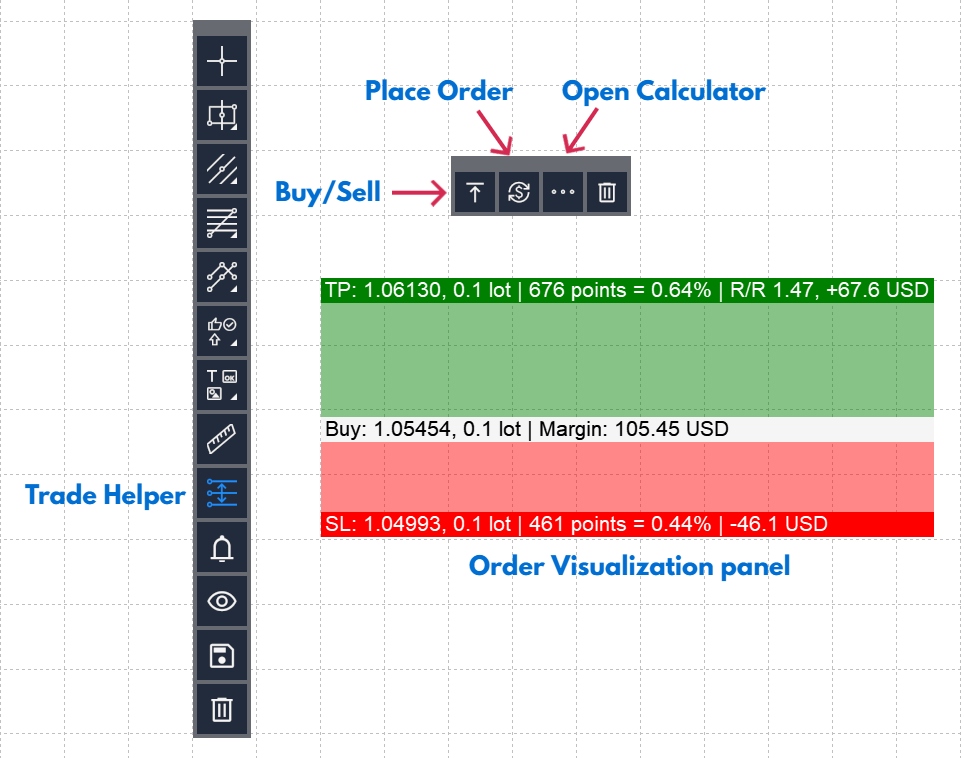
Trade Helper helps calculate trade factors and place order quickly and visually. It provides:
- Order Visualization panel on chart with entry, stop loss and take profit levels
- Live adjust visualization panel and pre-view your trade factors
- Auto-calculate lot size based on risk or fix it and know your risk
- Risk on account currency or balance/Equity/Free margin
- Stop Loss level in absolute value, in points or adjusted based on risk
- Take Profit level in absolute value, in points or in Risk/Reward ratio
How to use Trade Helper
- Select Trade Helper tool on menu bar
- Click on entry level or anywhere on chart to show Order Visualization panel
- Drag to adjust entry/stop loss/take profit levels on panel
- Read information calculated on panel for details of trade you intend to place
- Start order right away by click Place Order button on Quick Setup dialog
- For more detailed setup, click More button on Quick Setup dialog to show Trade Calculator panel
- Click Place Order button on Trade Calculator panel to place order you calculated carefully
Please note that:
- Changes on Trade Calculator panel are shown to Order Visualization panel with additional information after calculated
- You can adjust levels on Order Visualization panel and changes will be updated on Trade Calculator panel
Trade Calculator setup
It includes 3 sections: Entry, Stop Loss and Take Profit. There are constrains among fields to auto-calculate entry/stop loss/take profit levels, entry lot size, risk, risk/reward ratio.
The main idea is when updating one or more fields, other factors are auto-calculated to let you know entry lot size, risk and risk/reward ratio.
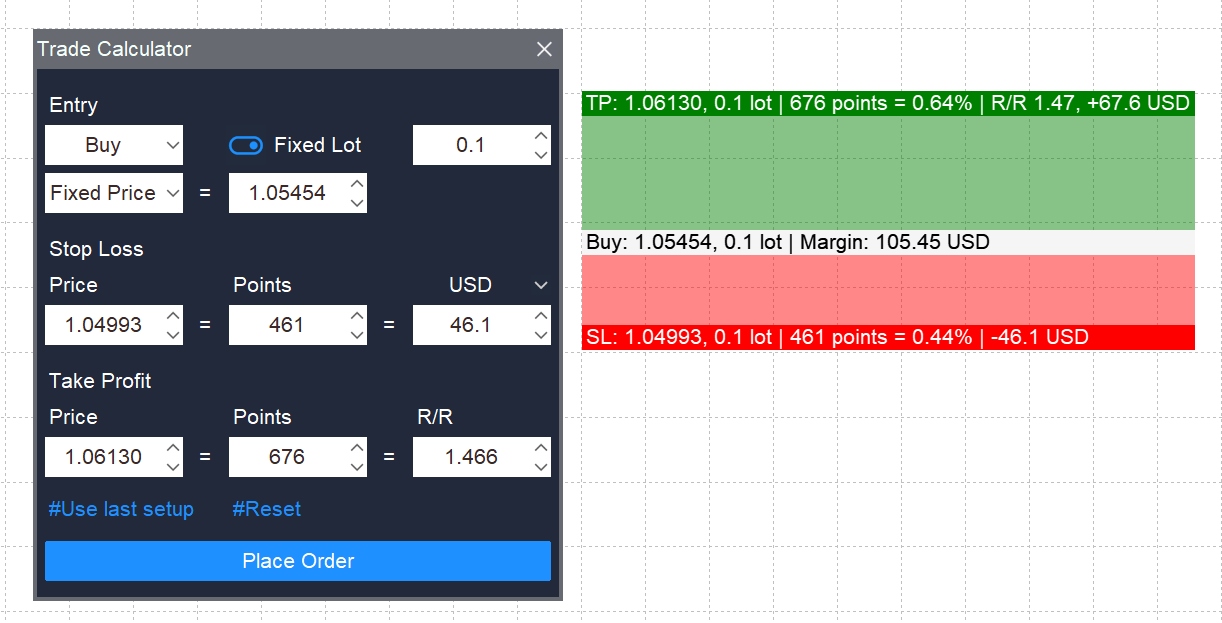
Please allow us use variant_type_name of fields to explain as it’s easier to address fields. Please also allow us explain in not-full-sentence style to make description shorter.
- Entry type: Direction of trade
- Entry lot type: If “Fixed Lot” on, enter lot size number and it will not be fixed. Otherwise, lot size will be auto-calculated
- Entry lot size (entry_lot_size)
– Enter lot size you want to buy/sell here. When this field is updated, Stop loss level and R/R can be updated. Just enabled if “Fixed Lot” on
– If disabled, value of this field will be calculated based on stop loss level
– Lot size is calculated with this formula: stop_loss_risk / (stop_loss_points * point_value). point_value depends on symbol/currency pair
– Lot size is auto rounded to a valid lot size
– Default is 10 * minimum_lot - Entry price type
– Entry trade by fixed price or market price (Buy = Market Ask; Sell = Market Bid)
– If pick “Fixed Price”, enter price in the next field
– If pick “Market Bid/Ask”, you can specific an adjustment number in points for better entry point. With this option, Order Visualization panel will move up/down to reflect market price changes - Entry price value: Specific entry price here. Just available if Entry price type is “Fixed Price”
- Entry adjust points
– Define an adjustment point number from the market price. Just available if Entry price type is “Market Bid/Ask”
– Can be a positive or negative number
– Will be add directly to market bid/ask price. It doesn’t care the entry direction - Stop loss price (stop_loss_price)
– Stop loss level of trade in absolute value
– If updated, these fields may updated: stop_loss_points, take_profit_rr, stop_loss_risk (if “Fixed Lot” on), entry_lot_size (if “Fixed Lot” off) - Stop loss points (stop_loss_points)
– Stop loss level of trade in point change value
– If updated, these fields may re-calculated: stop_loss_price, take_profit_rr, stop_loss_risk (if “Fixed Lot” on), entry_lot_size (if “Fixed Lot” off)
– Default is 200 points - Stop loss risk (stop_loss_risk)
– Define affordable risk of trade here- Unit can be absolute amount in account currency (USD, EUR,…) or percent of account balance/equity/free margin
– Choose unit by select from dropdown list above this field
– Risk can be over account balance if using absolute amount but maximum 100% if using percent of account balance/equity/free margin
– If updated, these fields may re-calculated: entry_lot_size (if “Fixed Lot” off), stop_loss_price/stop_loss_risk (if “Fixed Lot” on), take_profit_rr (if “Fixed Lot” on)
– Default is 200 points * point_value - Take profit price (take_profit_price)
– Take profit level of trade in absolute value
– If updated, these fields are re-calculated: take_profit_points, take_profit_rr - Take profit points (take_profit_points)
– Take profit level of trade in point change value
– If updated, these fields are re-calculated: take_profit_price, take_profit_rr
– Default is 300 points - Take profit R/R (take_profit_rr)
– Specific risk/reward ratio of trade here
– If updated, these fields are re-calculated: take_profit_price/take_profit_points
– Take profit R/R is calculated based on this formula: take_profit_points / stop_loss_points - “#Use last setup” button: Restore last valid calculator setup
- “#Reset” button: Restore changes
Important notes:
- Because account balance/equity/free margin is updated frequently depend on open positions/orders, Trade Calculator uses latest value when it created or when risk unit is updated. So if using risk unit account size and want to update to latest value, please re-select risk unit from dropdown list
- “Use last setup” doesn’t restore entry price. It respects current entry price
- “Use last setup” may not restore the same stop_loss_risk value if risk unit is percent of your account size as Trade Calculator use latest account value
VI. Alert Manager guidelines
Alert Manager helps create immediately notifications for trade opportunities via channels you prefer
- Set up notifications you want to receive for difference symbols, conditions…
- 7 popular conditions to pick
- 4 channels to be notified
- Filter, update, delete notifications
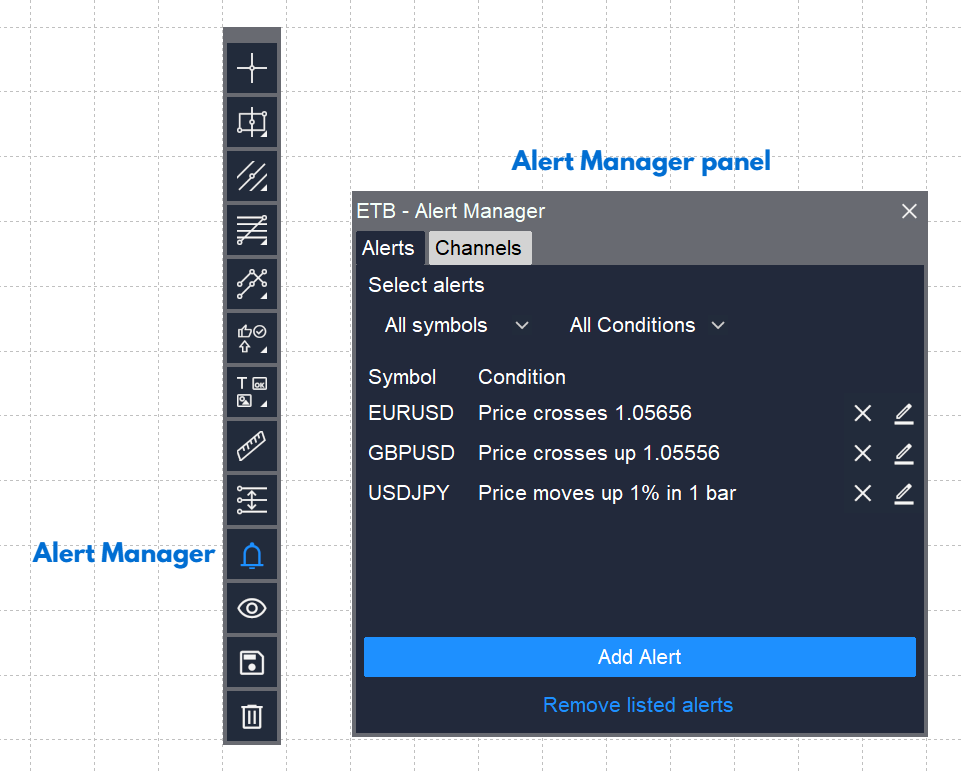
How to create an alert
- Click Alert Manager button on menu bar to show Alert Manager panel
- Click “Add Alert” button
- Setup alert
- Click confirm
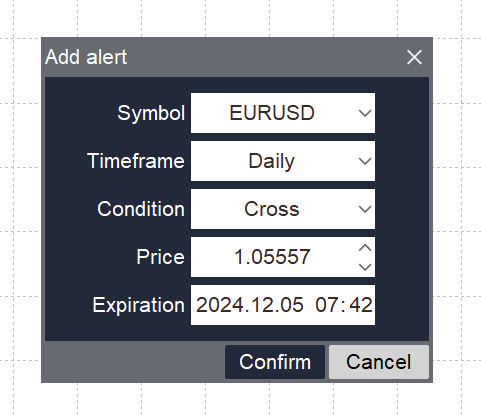
Setup alert fields:
- Symbol: Choose alert on symbol
- Timeframe: Choose timeframe for alert. This field is meaningful with conditions that using “Bar”. Otherwise, you can pick any timeframe
- Condition: Condition to fire alert. There are 7 conditions are supported:
1. Cross: Price crosses over a specified price (you will specific later)
2. Cross Up: Price crosses up (from below to above) a specific price
3. Cross Down: Price crosses down (from above to below)a specific price
4. Greater Than: Price is greater than a specific price
5. Less Than: Price is less than a specific price
6. Move Up %: Price moves up a specific percent in a specific number of bars (you will specific later)
7. Move Down %: Price moves down a specific percent in a specific number of bars - Price: Specific price for first 5 conditions above. Not available if condition is “Move Up %” or “Move Down %”
- Percent: Specific percent for 2 latest conditions above. Just available if condition is “Move Up %” or “Move Down %”
- Bar: Specific bar for 2 latest conditions above. Just available if condition is “Move Up %” or “Move Down %”
- Expiration: Expiration time of alert. Alert will be removed if time is over but condition doesn’t meet. Time is Server Time
How to setup alert channels
You can get notification via 4 channels, turn on/off channels as below:
- Click Alert Manager button on menu bar to show Alert Manager panel
- Select Settings tab
- Toggle on/off channels you want to receive notification or not
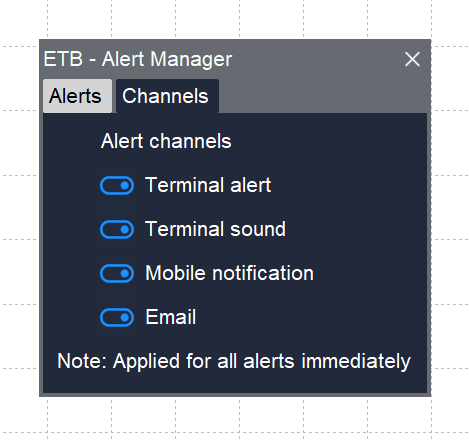
List of alert channels
- Terminal alert: An alert dialog that appears on working terminal
- Terminal sound: A sound that appears on working terminal
- Mobile notification: A mobile notification that send to your mobile. To make this option works, you need to install MetaTrader app and set up MetaQuotes ID. Guidelines here
- Email: An email that send to your mailbox. To make this option works, you need to setup email SMTP. Guidelines here
How to view available alerts
- Click Alert Manager button on menu bar to show Alert Manager panel
- List of active alerts with main information are shown on list
- You can filter alerts by:
– Symbol filter to filter alerts by symbol. Just available symbols show on list
– Condition filter to filter alerts by condition
How to edit an alert
- Click Alert Manager button on menu bar to show Alert Manager panel
- Click three-dot icon next to alert on list to start edit
- Update fields you want to change. Meaning of fields are explained above
- Click Confirm
How to remove alert(s)
All alerts that fired or expired will be removed automatically. If you want to remove an active alert:
- Click Alert Manager button on menu bar to show Alert Manager panel
- Click cross icon next to alert on list and click Confirm
VII. Show/Hide/Remove objects
Easy Toolbar allows you show/hide all created objects and panels by just 1-click. You can also able to remove all objects by 1-click too.
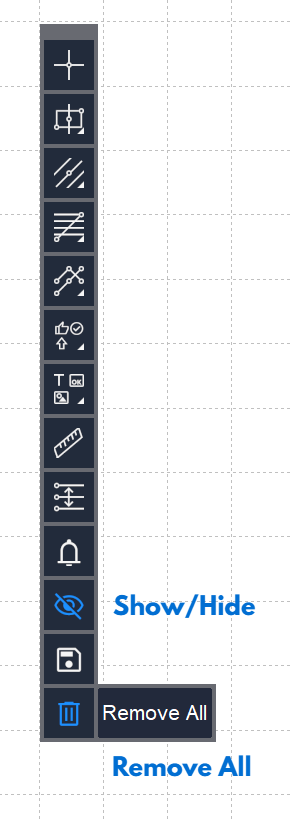
Show/Hide objects and panels
- Click Show/Hide button on menu bar to toggle objects and panels visibility
Remove All objects and panel
- Click Remove button then select “Remove All”
VIII. Save/Load chart
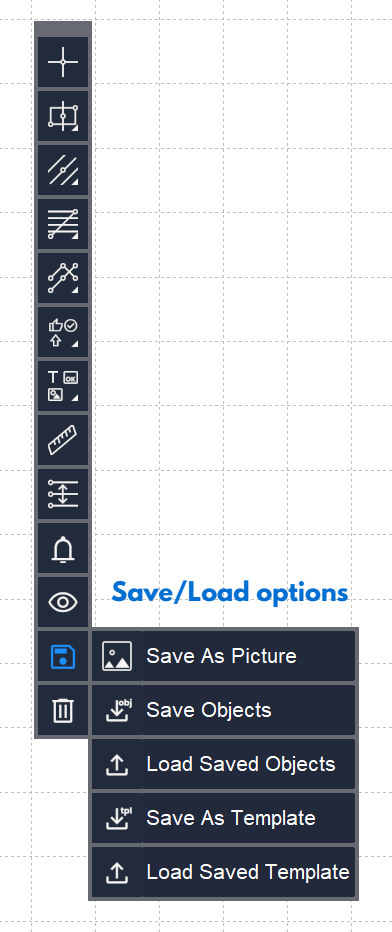
Save As Picture
This option saves your current chart as a picture
- Click Save button on menu bar and select “Save As Picture”
- Choose the name of picture
- Click Save
Save Objects
This option saves all objects in chart as a .csv file. Unlike “Save As Template”, this option just save objects only.
- Click Save button on menu bar and select “Save Objects”
- Choose the name of file
- Click Save
Load Saved Objects
This object loads your saved objects and re-create them on chart. Unlike “Load Saved Template”, this option just loads saved objects. It’ll ignore objects in indicator windows if the current chart doesn’t have that indicators. The current chart symbol and symbol of saved objects must be same.
- Click Save button on menu bar and select “Load Saved Objects”
- Select the file you saved
- Click Open
Save As Template
This option saves current chart as a template (.tpl file). Unlike “Save Objects”, this option saves everything on chart (chart options, indicators…)
- Click Save button on menu bar and select “Save As Template”
- Choose the name of file
- Click Save
Load Saved Objects
This object loads your saved template and apply it. Unlike “Load Saved Objects”, this option will load and apply everything of saved chart.
- Click Save button on menu bar and select “Load Saved Template”
- Select the file you saved
- Click Open
Important notes for Save/Load options:
- Saved pictures/files are stored in MetaTrader Data Folder. Normally, it’s in the path like this: C:\Users\Your_Username\AppData\Roaming\MetaQuotes\Terminal\Your_Terminal_Id\MQL5\Files\ETB
- You can access Data Folder from your MetaTrader application by click File\Open Data Folder. Then select MQL5\Files\ETB from open file dialog
- You also just able to load saved objects and templates from the folder above to protect you from violate access

