Ethereum price tests oil $2,100, ETF pressure mounts.

With the price of Ethereum falling to $2,100, a short-term price correction has turned into a broader test of the market’s confidence in one of the cryptocurrency’s largest assets.
Source of data CryptoSlate ETH has fallen nearly 10% over the past week, wiping out all of its May gains and turning traders’ attention back to the $2,000 level.
This price performance came as selling pressure spread across spot markets, derivatives and regulated investment products.
The weakness has left the Ethereum price trapped between two competing forces. In the short term, rising oil prices, exchange inflows, aggressive futures selling, and ETF redemptions put pressure on the token.
From a longer-term perspective, proponents, including BitMine Chairman Tom Lee, say Ethereum’s role in tokenization and agent artificial intelligence will remain intact, creating a more pronounced gap between current price action and the asset’s structural investment case.

Impact of Oil Pressure on Ethereum Price
Lee placed the first part of the Ethereum price decline outside the cryptocurrency, arguing that oil has become the biggest macro headwind for ETH.
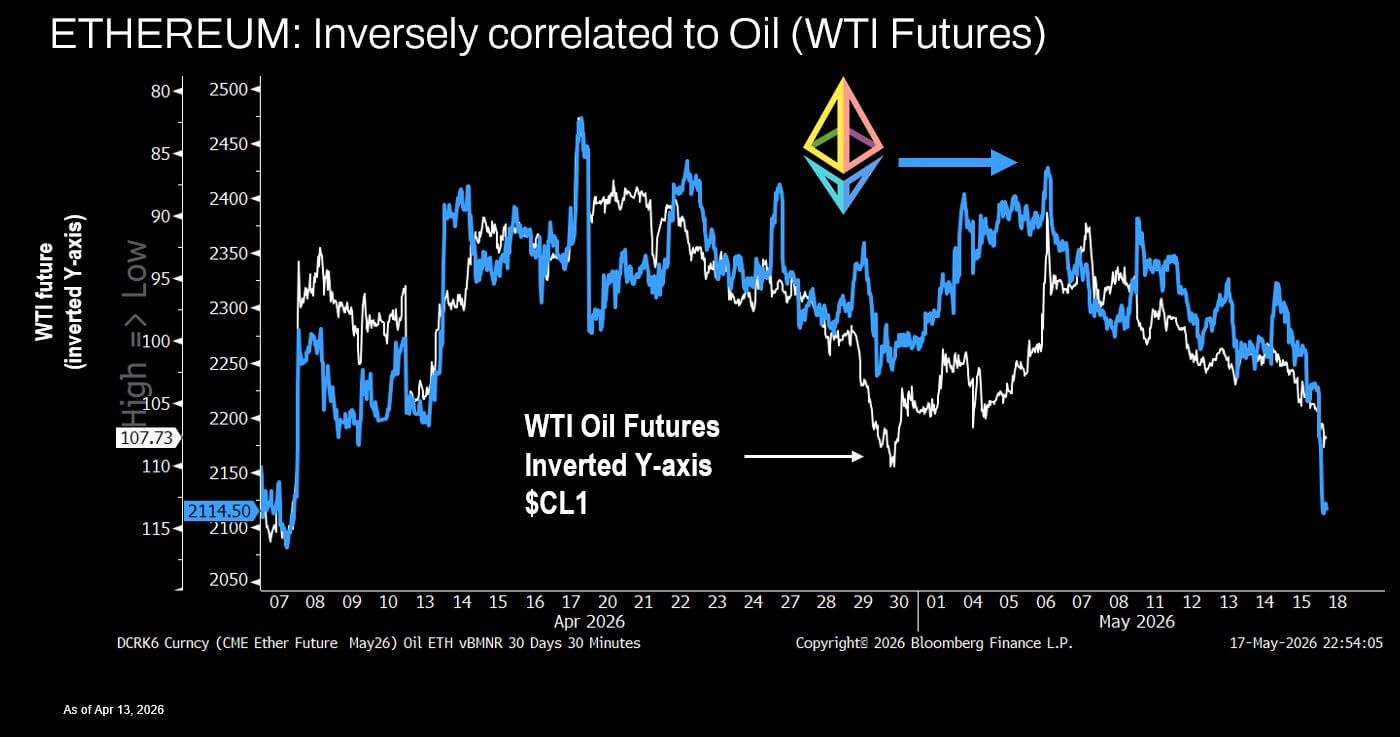
The BitMine chairman said rising crude oil prices were the biggest source of pressure on Ethereum, pointing to the record negative correlation between ETH and oil.
Ethereum crude oil correlation is important for traders because crude oil serves as a proxy for inflation, liquidity stress, and broader risk appetite.
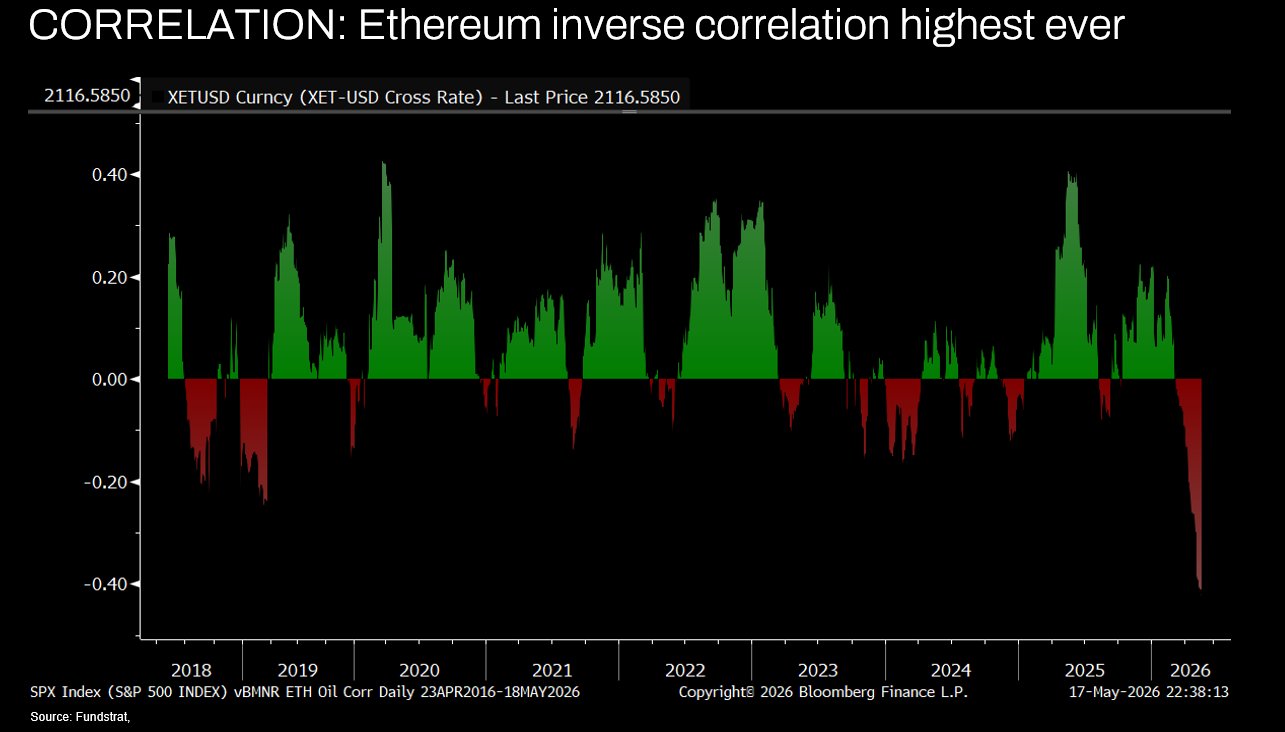
In this setup, the rise in crude oil has coincided with the decline in Ethereum, making energy markets an important part of the current cryptocurrency sell-off.
Crude oil prices have risen more than 54% since the U.S.-Iran war began on February 28, pushing prices above $100 to their highest level in years, according to Oilprice.com data.
The move puts additional pressure on markets already sensitive to inflation, interest rates and liquidity expectations.
Rising oil prices can act as a tax on consumers and businesses by increasing transportation, production and energy costs. It could also continue to raise inflation risks, complicating the central bank’s outlook.
For cryptocurrency assets that trade with high liquidity, high beta risk appetite expressions, this backdrop can cause demand to decline quickly as traders begin to reduce their exposure.
The Ethereum price has been particularly exposed to these changes since the token entered recovery mode in May. A move towards $2,400 has begun to restore confidence, but the rise in crude oil prices has coincided with renewed weakness across digital assets.
However, as oil prices have risen over the past few weeks, ETH has steadily lost momentum and reverted to the lower end of its recent range.
Nonetheless, Lee described the pressures around oil as “short-term tactical noise” and suggested its appeal could ease if oil prices plateau or reverse.
This view focuses on oil as an immediate macro trigger while leaving room for Ethereum’s long-term thesis to be reasserted once the market moves beyond its current inflation and liquidity issues.
Binance flows and futures sales show pressure moving into market structure.
While the macro backdrop sets the tone for Ethereum’s decline, on-chain and derivatives data shows how pressure has moved through the market.
According to CryptoQuant data, Binance continued to record positive ETH netflow during the first half of May. This means that more ETH was deposited into the exchange than was withdrawn.
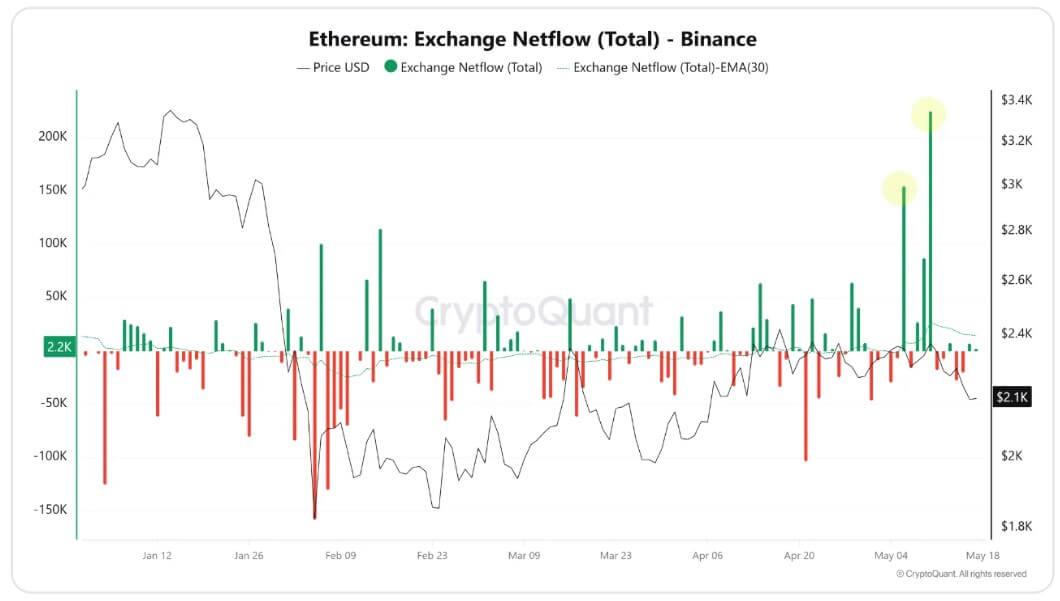
This change is important because even if deposits are not sold immediately, exchange inflows increase the amount of liquidity available for trading.
These movements were large enough to change the short-term balance of the market. More than 225,000 ETH moved to Binance in one day, pushing the seven-day moving average of the exchange’s net flows to its highest level since late 2022.
The timing amplified the signal, as ETH was already showing weakness after trading near $2,400.
Large transfers to exchanges may reflect several motivations. Some holders may be preparing to sell, others may be taking hedging positions, and some may be moving collateral for derivatives trading.
But in a declining market, a surge in deposits tends to increase concerns that more supply could hit the order book as buyers become more cautious.
This helped explain why the Ethereum price decline accelerated as ETH approached $2,100. Tokens no longer only dealt with macro pressures from oil and interest rates. It also absorbed new exchange supply from large holders, forcing the market to find new levels where buyers could absorb additional liquidity.
The pressure then shifted to the futures market. Binance Taker sales surpassed $1.1 billion in one hour over the weekend as ETH edged closer to $2,100, according to CryptoQuant data.
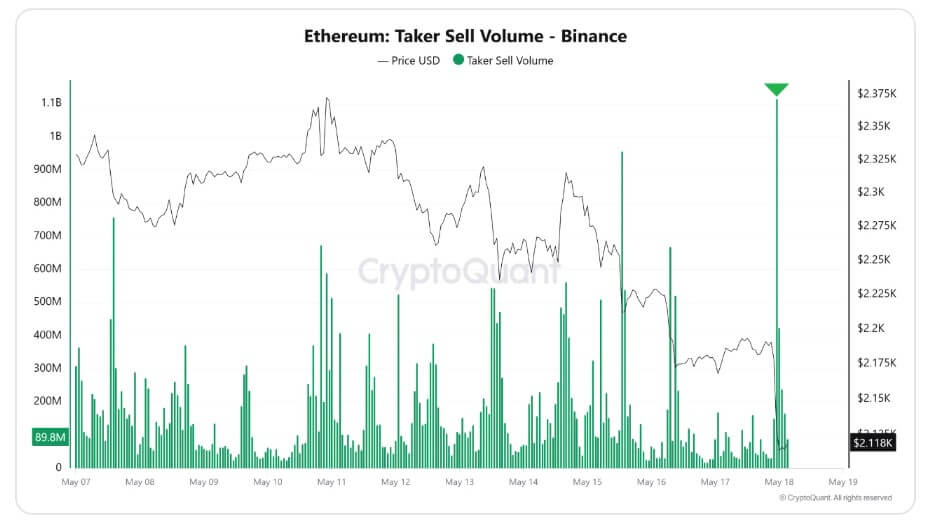
Taker Sell Volume tracks aggressive market selling where traders apply existing bids instead of placing passive orders. A spike in that indicator during a pullback often points to a short-term trader who is forced to de-risk, execute a stop loss, or lean into the downside momentum.
Ethereum ETF outflows add another price drop as institutional demand weakens.
As regulated investment products begin to see continued outflows, Ethereum’s decline has become harder to dismiss as a short-term exchange-driven move.
The US-based spot Ethereum ETF recorded net outflows for six consecutive trading days, losing more than $340 million, according to SoSoValue data.
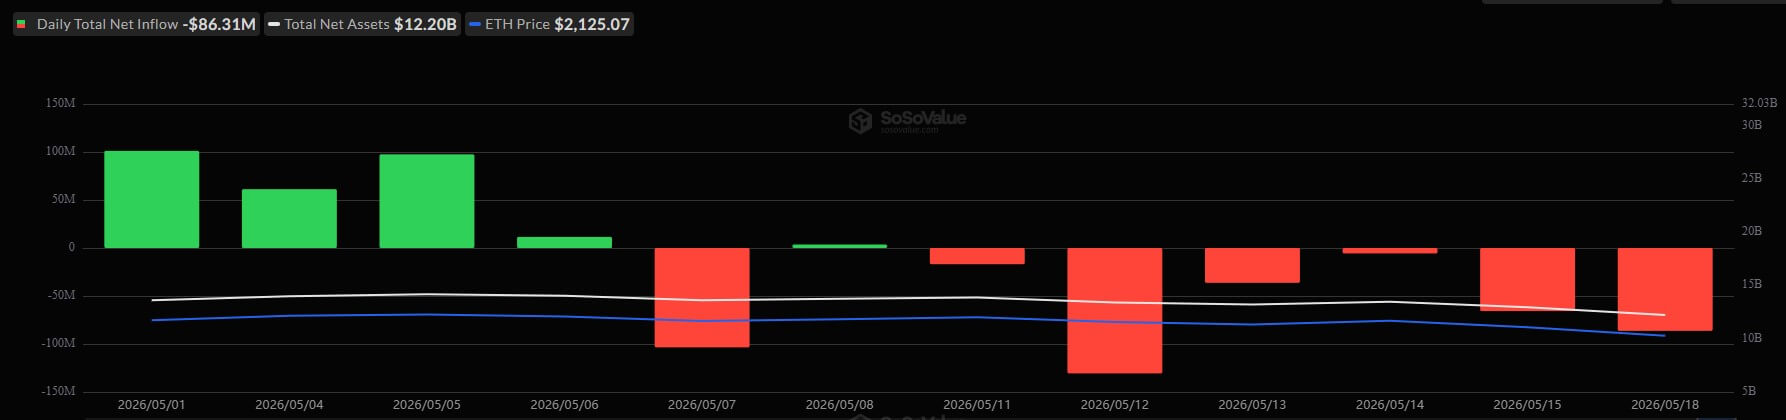
The redemption occurred during the same period of weakness for ETH, suggesting that ETF demand was not strong enough to absorb pressure from spot sellers and derivatives traders.
Meanwhile, the retreat also appeared in global trends. Ethereum investment products recorded $249 million in weekly outflows through May 15, the largest weekly withdrawal since January 30, according to CoinShares data.
These withdrawals extend the weakness beyond Binance and leveraged futures traders.
ETF flows are closely watched because they provide a clearer picture of the preferences of regulated investors. When ETFs attract capital, they can support markets by absorbing supply and strengthening confidence. If you lose capital during a price decline, you may become more dependent on spot buyers and short-term traders to stabilize prices.
This is the challenge facing the Ethereum price right now, as the token is facing pressure from multiple channels simultaneously. Oil weighed on macro sentiment. Binance inflows have increased available exchange supply. Futures sellers pressed the bears. ETF redemptions remove a potential source of institutional support.
This overlap helps explain why ETH struggled to defend its May gains. Each pressure factor fed into the next, turning what started as a drop in macro sensitivity into a broader test of liquidity, positioning and demand.
These signals must improve together for the recovery to look more sustainable. Exchange inflows must be curbed, aggressive futures selling must be reduced, and ETF outflows must be slowed or reversed.
Absent such changes, Ethereum’s long-term story could remain the same while short-term markets continue to trade defensively.
Ethereum tokenization and AI frame ETH price recovery path
Lee argued that Ethereum’s current weaknesses must be separated from its long-term strength, which could support the network until 2026.
While oil, exchange inflows, futures selling and ETF redemptions have created a short-term decline, Lee said the bigger drivers for ETH remain tokenization and agent AI.
These topics have become central to Ethereum investment cases. This is because both rely on programmable financial rails, deep liquidity, and settlement infrastructure that can support activities beyond speculative trading.
Tokenization is a further development of that argument. Financial institutions are increasingly using blockchain networks to represent assets such as government bonds, funds, credit products and other securities on-chain. Ethereum remains one of the primary venues for this change due to its developer base, liquidity, security record, and established smart contract infrastructure.
According to Token Terminal data, the on-chain market value of real-world assets has surpassed $38 billion, with Ethereum accounting for approximately 67% of tokenized RWA.
Grayscale also described tokenization as a big potential investment opportunity, noting that tokenized assets still account for only a small portion of global stock and bond markets despite their rapid growth over the past year.
This gives Ethereum a structural argument beyond the current sell-off. As more traditional assets move to public ledgers, networks that provide payments, liquidity, and smart contract execution can capture a larger share of financial activity.
Ethereum proponents argue that the chain is already positioned to fill that role, as it has the deepest DeFi ecosystem and one of the most mature foundations of tokenized asset infrastructure.
Lee’s second driver, agent AI, adds a new layer to the same thesis. Autonomous software systems that can trade, borrow, lend, verify data, or make payments require digital rails designed for machine-centric activities.
Ethereum proponents argue that the blockchain network is suited for that role because it allows agents to interact directly with code, liquidity pools, stablecoins, and on-chain credit markets.
These long-term drivers are the basis of BitMine’s view that recent declines have created opportunities rather than undermining the broader thesis.
The company sees ETH falling below $2,200 as an attractive level to accumulate assets, citing continued tokenization and agent AI developments as reasons it could outperform the current market stress.
BitMine owns over 5.2 million ETH, making it the largest public company holder of the digital asset. This position gives the company a first-hand look at whether Ethereum’s structural demand story can outlast the current pressures from oil, exchange supply, derivatives sales, and ETF outflows.
However, the case for ETH’s price recovery still needs to be confirmed by the market. ETH’s exchange inflows will need to cool, futures selling to die down, and ETF redemptions to slow before investors can more confidently treat the recent decline as a reset. A reversal in oil prices would support Lee’s view that the biggest macro disruptions to ETH are temporary.


