Understanding Price Trend Indicators

Price trend indicators: Deciphering the language of price movements and volume in financial markets is like deciphering the mysteries of market dynamics. Among the numerous technical indicators, Price Volume Trend (PVT) stands out as a unique tool that can help relate security prices and trading volumes.
In this article, we will discuss the price volume trend indicator and see how traders can use it.

What is a price volume trend indicator?
Price Volume Trend Indicator is a volume-based technical analysis tool that helps traders relate security prices to volume.
It is useful in identifying parity between the supply and demand of a security and also helps in determining the price direction and intensity of price changes of the security.
The indicator consists of a cumulative volume line that adds or subtracts a percentage change in the security’s price and current volume as the security moves upward or downward.
Price Volume Trend Indicator – Formula
The basis of the indicator is to multiply the quantity of a security by the rate of change in the security’s price.
PVT = previous PVT + volume x (today’s closing price – previous closing price)/previous closing price
Where PVT = price trend
The value of an indicator rises with security prices and falls when prices fall.
Interpreting price trend indicators
Unlike indicators like MACD or RSI, there are no clear signals that indicate that a security is overbought or oversold. Instead, traders analyze the overall trend along with changes in the PVT indicator to determine a security’s momentum.
An increase in the PVT indicator indicates that funds are flowing into the security. On the other hand, a decrease in PVT indicates that funds are leaving the security.
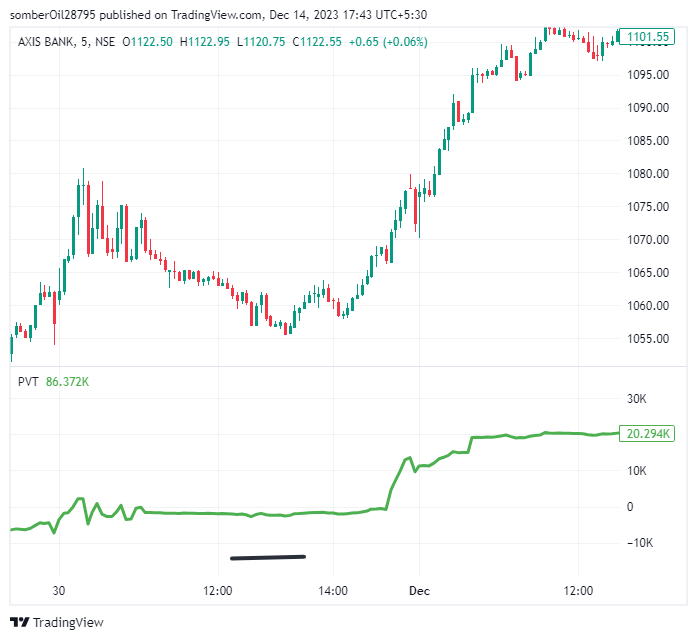
This indicator gives you an idea about the money coming in and out of a security, but how can you use this indicator to identify an upward or downward trend?
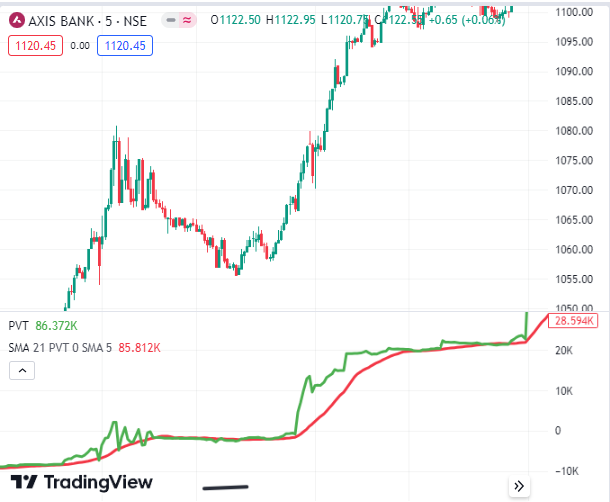
This is where the signal lines come into play. The signal line is nothing more than a 21-day simple moving average that we add to the PVT indicator.
To apply a signal line to a PVT indicator, follow these steps:
- Level 1: In the PVT Indicator section, click More Options.
- Step 2: Select ‘Add indicator/strategy to PVT’.
- Step 3: Search for ‘simple moving average’ and select
- Step 4: Change the length of SMA to 21 and choose the color you want.
Here, we will set the color of the PVT line to green and the color of the signal line to red to easily identify securities trading transactions.
Trading using Price Volume Trend Indicator (PVT)
Here’s how you can use the price volume indicator along with signal lines to initiate trades in the market.
Signal line crossing strategy
In this strategy, you enter trades based on a price trend indicator that crosses above or below the signal line. Here are some indications for bullish or bearish signals and how to trade them.
bullish signal
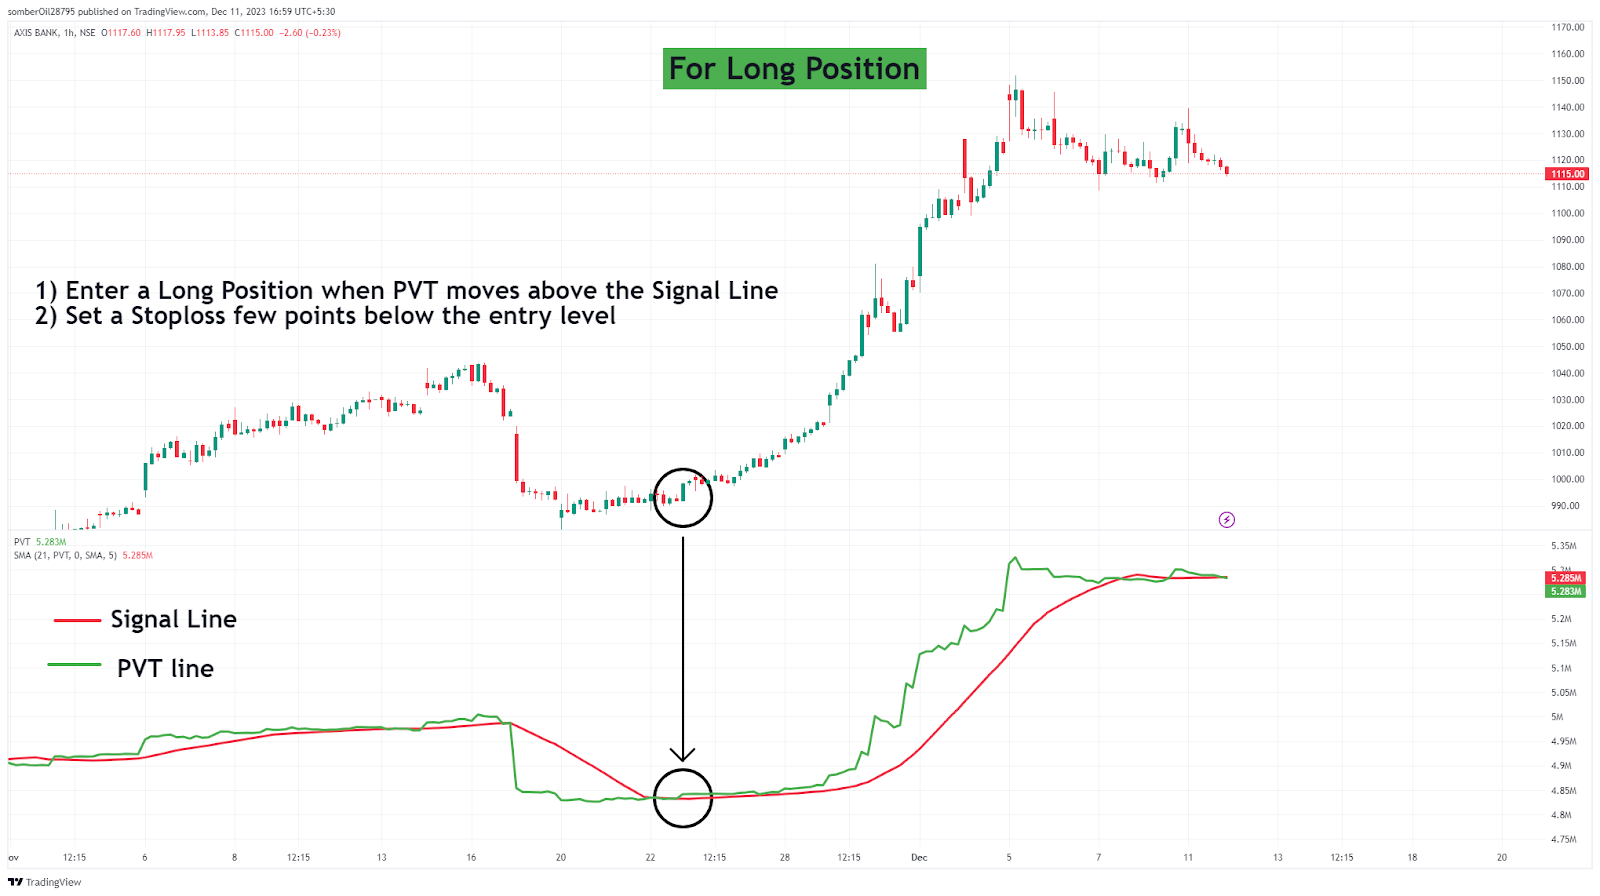
When the price volume trend indicator crosses above the signal line, it indicates a bullish trend in the security.
entry: When the PVT indicator (green line) crosses above the signal line (red line), you can enter a long position in the security.
Profit Target: You can remain secure until the PVT line closes below the signal line or until the tracking stop loss is reached, whichever comes first.
Stop Loss: The stop loss for this trade can be an immediate support level and can be followed if the trade starts to move in your favor.
bearish signal
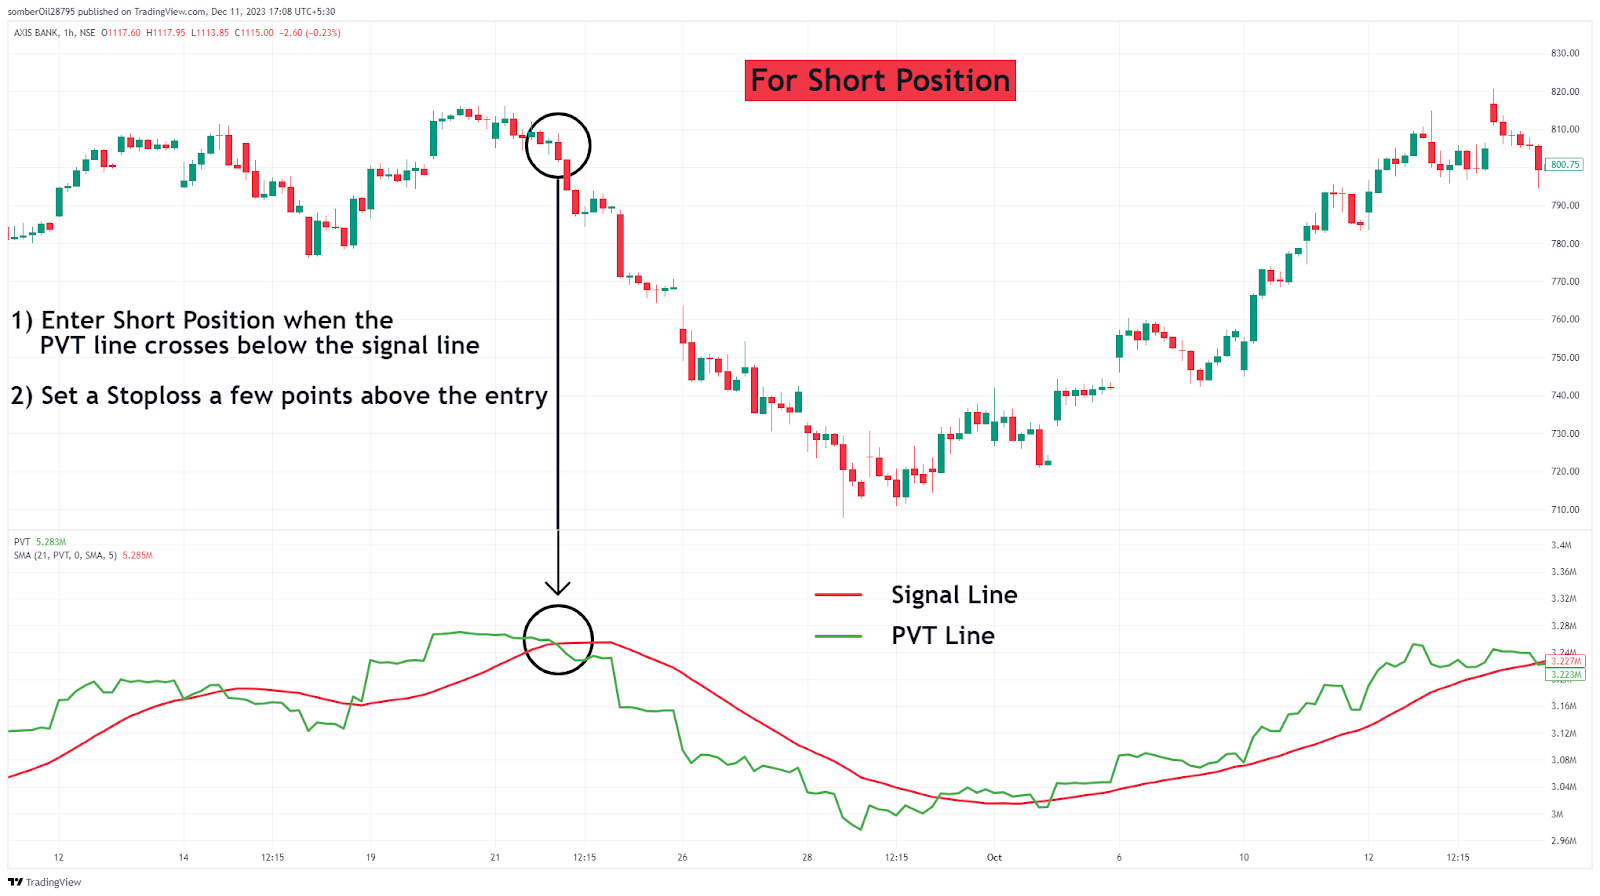
When the price volume trend indicator crosses below the signal line, it indicates a bearish trend in the security.
entry: If the PVT indicator (green line) crosses below the signal line (red line), you can enter a short position in the security.
Profit Target: You can remain secure until the PVT line closes above the signal line or until the trailing stop loss is reached, whichever comes first.
Stop Loss: The stop loss on this trade can be an immediate resistance level and can be traced once the trade starts to move in your favor.
divergence strategy
Divergence refers to a situation where securities and price/volume indicators move in opposite directions. This indicates that the current market trend is reversing. Here’s how to identify bullish and bearish divergences in the market.
bullish divergence
When the price of a security makes lower lows and the PVT indicator makes higher lows, this indicates a bullish divergence in the security. This indicates that the bearish trend is weakening and indicates the possibility of a bullish reversal in the security’s price.
When a bullish divergence occurs, it does not mean that the stock price will move in an upward direction. In this strategy, you should enter a buy position only when the PVT indicator moves above the signal line.
Trading bullish divergences is similar to the bullish signal line crossover strategy.

bearish divergence
When the price of a security makes higher highs and the PVT indicator makes lower highs, this is a bearish divergence occurring in the security. This indicates that a bullish trend is weakening and signals a potential bearish reversal in the security’s price.
Like a bullish divergence, the occurrence of a bearish divergence does not necessarily mean that the security will move in a downward direction. In this strategy, you should consider entering a sell position only when the PVT indicator moves below the signal line.
The bullish divergence trading method is similar to the bearish signal line crossover strategy.

Period of PVT indicator
The price volume trend indicator can be used on any time period depending on your trading style, goals and trading time frame.
However, it is important to note that although you can get more signal in a shorter period of time, you are more vulnerable to market noise. On the other hand, longer time periods may produce little signal, but may provide more significant trends.
Finishing
In this article, we discussed what the price volume trend indicator means, how to trade using this indicator, and the time period during which you can use this indicator.
The Price Volume Trend (PVT) indicator is a useful tool for traders to make informed decisions by analyzing both price and volume. However, using this indicator with a combination of indicators such as moving averages can help you gain better confidence in your trades.
Written by Aaron Barth
by utilizing stock screener, stock heatmap, Backtesting Portfolioand stock comparison The tools on the Trade Brains portal give investors access to comprehensive tools to identify the best stocks, stock market newsBe aware and invest well.

Start your stock market journey now!
Want to learn stock market trading and investing? Check out exclusive stock market courses from FinGrad, a learning initiative from Trade Brains. You can sign up for free courses and webinars from FinGrad and start your trading career today. Sign up now!!


