Building a Trading Strategy: An Evolutionary Approach and Data Mining – Trading Strategy – December 19, 2023

In the dynamic world of trading, I have progressed from intuitive strategies to a more structured and advanced approach. Currently, I use professional strategy creation tools to systematically and efficiently build my trading approach.
My main focus has shifted towards creating Expert Advisors (EA) based specifically on grid strategies. Despite the criticism, I have found fertile ground for this strategy to shine.
Recently I have entered a new phase of exploring more complex strategies that incorporate Stop Loss and Take Profit. I am confident that this evolution is the way forward in the pursuit of more powerful and effective trading strategies.
Throughout this article, I will share my strategy creation process. This shift toward more advanced tactics reflects my ongoing commitment to improvement and adaptation in an ever-changing marketplace. We invite you to join us on this exciting journey towards a more sophisticated and strategic trading approach!
strategic mining
In the process of establishing a strategy, specialized software is used to create a strategy through mining.
The logic behind this is as follows: Test millions of trading indicators and signal combinations, mix them in a predetermined order and set limits. Because of the large number of combinations, this process can take hours or days. In my case it was tested over a specific period of time, using a period of 10 years.
This process involves the genetic evolution of the strategy, which is then validated and subjected to an out-of-sample period. This is not indiscriminate mining. I already know what I want when I start. As you begin the process, you have an idea in mind. In this case, I was looking for a strategy for a proven strategy, considering the Bollinger Bands as support and resistance. When the price begins to break a band, it is accompanied by a level breakout and we consider momentum to be imminent.
Initially, relatively flexible values are set to guide the evolution of strategies, followed by more firm values that are used to classify and discard many strategies.

What do we observe in this first image? Some interesting things. At the time of screen capture, 13 million combinations had been tested, and only 7,482 (0.6%) were approved according to our criteria. At this point the first test is closer to 10 hours. 48 building blocks were selected and tested over 10 years of GBPUSD. However, tests were also conducted against EURUSD, discarding those that did not perform well in both symbols.
Clearly, once we have obtained more than 7,000 strategies that meet suitable retrospective criteria, we can consider our work completed. But what happens next is that it is essential to discard mere chance, over-optimization, or precise parameter fitting, which can lead to misleading results. We will explore a series of additional tests to ensure the robustness of our strategy.
Robustness testing
Robustness testing is varied and challenging, but we highlight some of the methods used.
- Start bar randomization: How does our strategy work when the test starts on a different bar? Let us see whether the strength of our strategy lies in its independence from the initial position of the test.
- Randomize strategy parameters: The strategy depends on certain parameters, but what happens if there is a small change in those parameters? We will evaluate the strategy’s resistance to subtle changes while maintaining the excitement of uncertainty.
- Randomize historical data: Can our strategy withstand changes in historical data? Or are you too tied to a specific past? We will look at how it works against changes in historical data, challenge over-reliance and ensure a more comprehensive view.
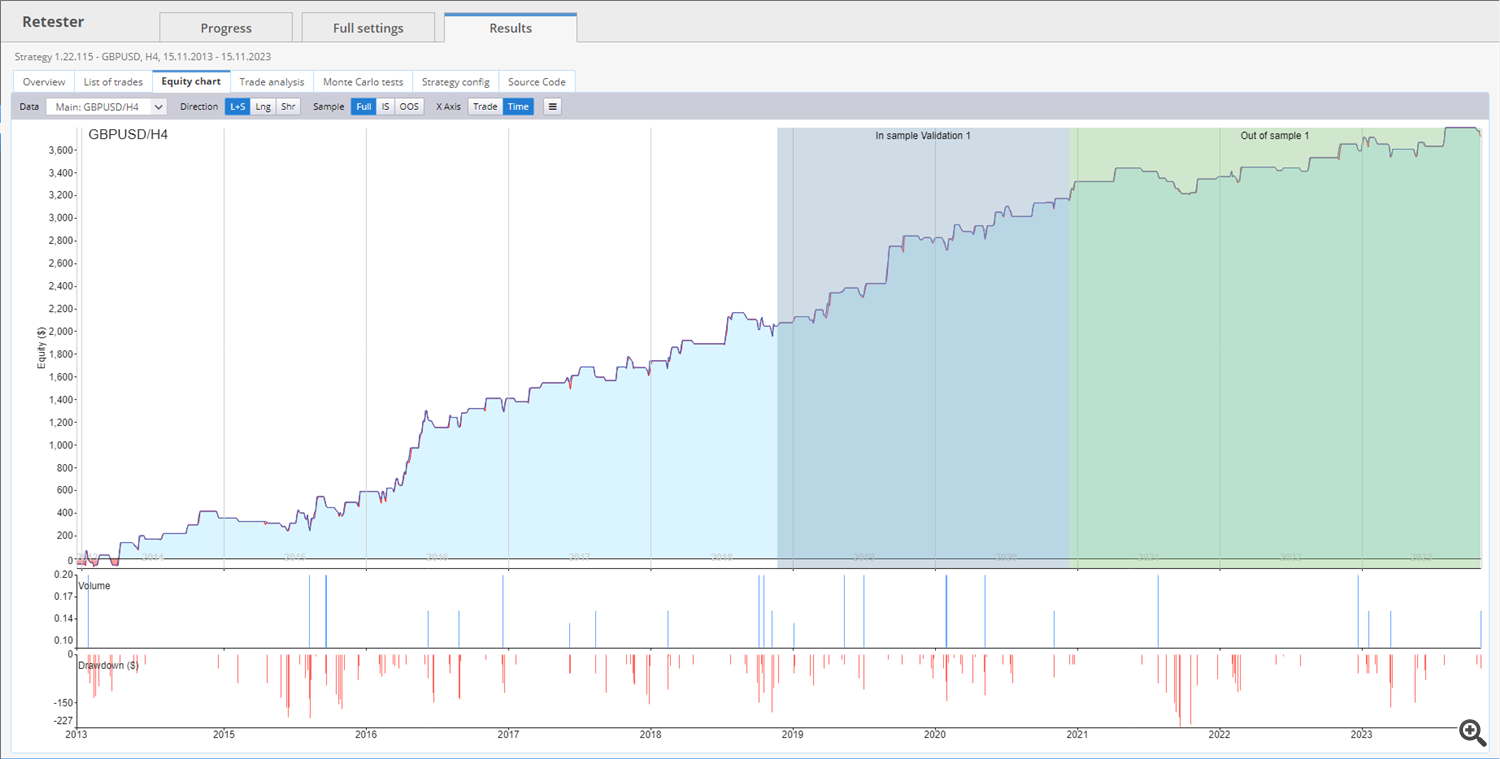
Let me explain with a clear example. In the image below you can see a stock chart showing further growth in the out-of-sample period (green period). We believe this is a good strategy that is powerful, natural, and uniform.
However, after applying 200 transformations to the special circumstances in which they are deployed – quotes, spreads, slips, parameters, etc. – a Monte Carlo test confirms:
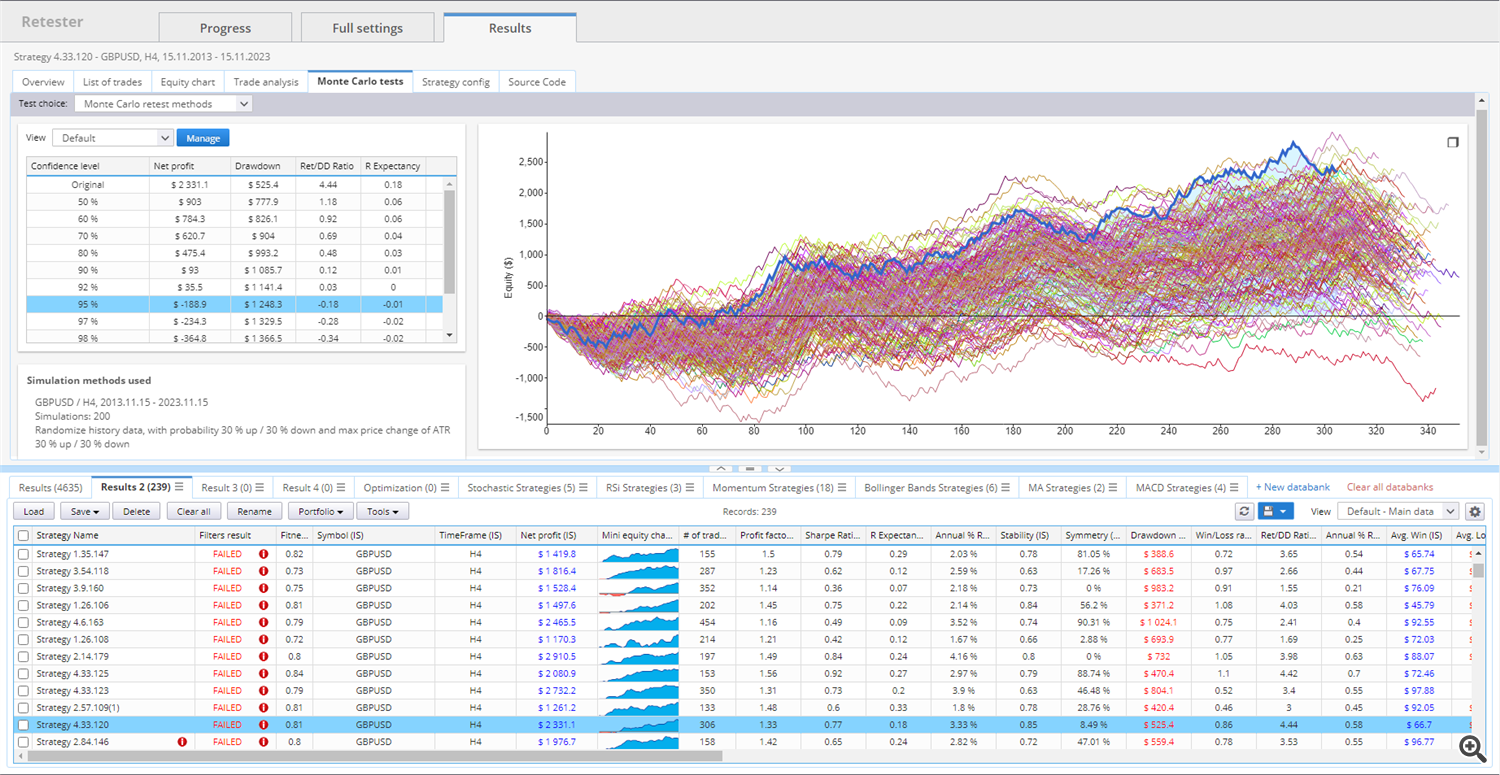
Image description: Dark blue shows the original strategy and any variations around it that occurred after testing. In fact, the best result is the original test, the remaining results are worse because they have many variants with missing results. This strategy, which may seem good, is automatically discarded at this stage.
But let’s see how the Monte Carlo test works in our favor.
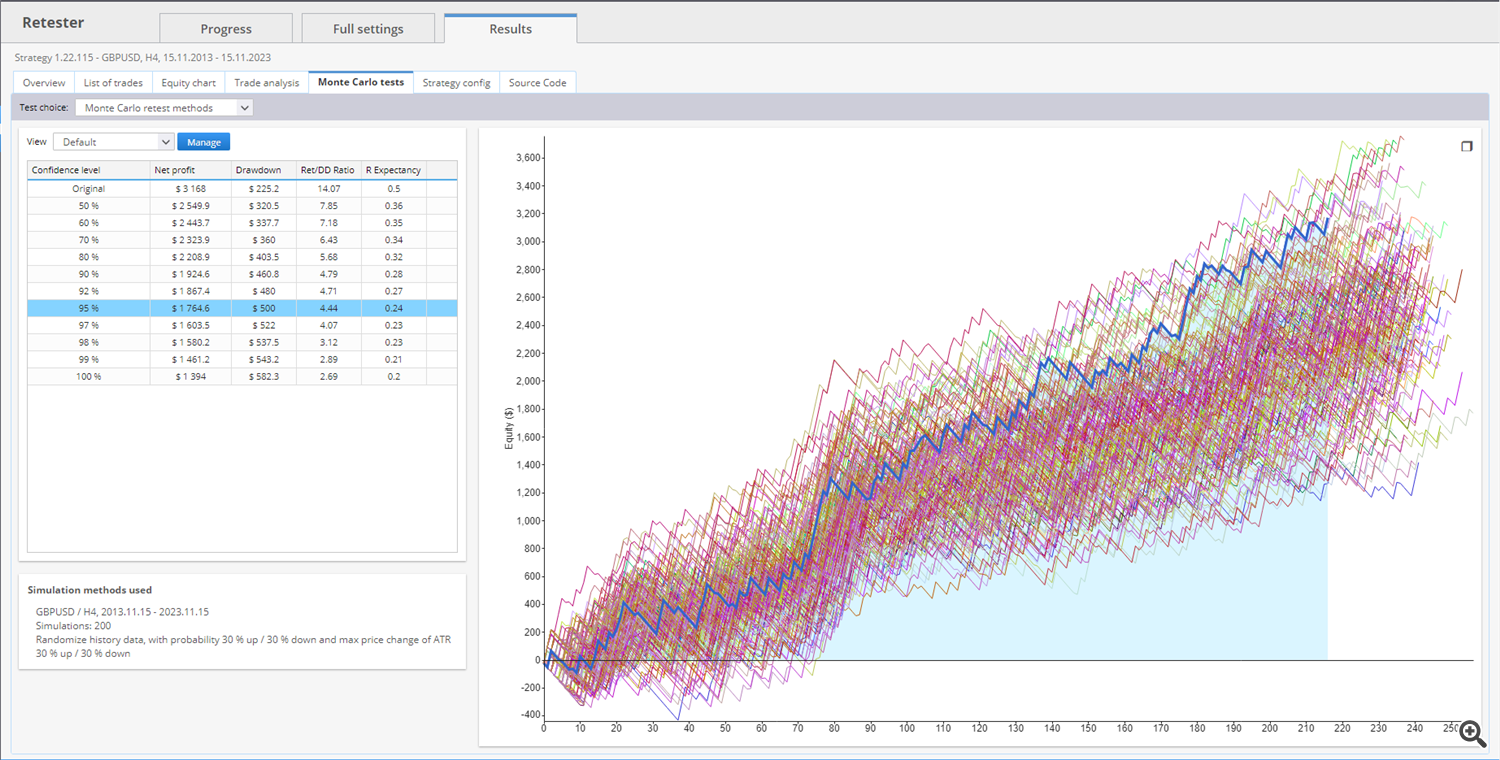
In this test, the transformations occur simultaneously to the benefit. This tells us that this strategy can be powerful.
But the testing doesn’t end there. Hard work still remains as we need to test the Walk Forward Optimization process and the Walk Forward Matrix.
Optimized walking forward
Walk-Forward Optimization is a special backtesting technique that performs multiple small backtests during the optimization period. These periods are spread over the entire backtesting period and are always followed by out-of-sample testing using optimized parameters.
In a walk-forward optimization process, data is divided into configurable periods, with each period containing an optimization part and an execution part. After performing optimization on past data segments, the system’s performance is verified through Forward-Test on the data after the optimized segment.
This technology simulates how a strategy would be used during real trading to optimize historical data and operate at optimal values. If the strategy does not improve during re-optimization, it may indicate curve fitting. On the other hand, if a walk-forward optimized strategy outperforms an unoptimized version on the same data, it means that the strategy is robust enough to benefit from periodic optimization and adapt to market changes.
walk forward matrix
This is simply a series of walk-forward optimizations performed using varying numbers of re-optimization periods and varying sample rates.
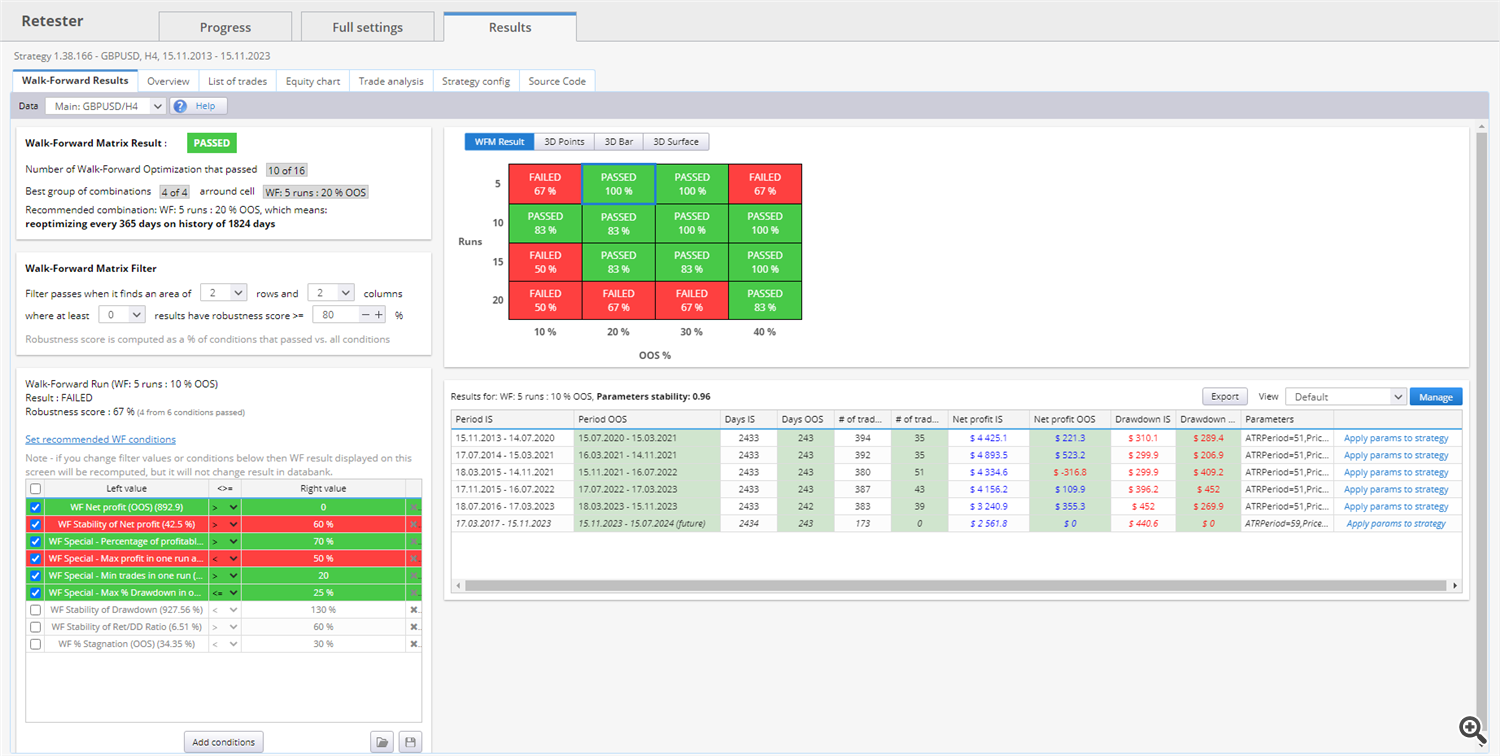
The results of the Walk-Forward matrix are presented as a table and 3D chart showing the scores (robustness results) for all combinations of out-of-sample ratios/runs performed on this matrix. This information will be explained in more detail at the end of the article, but before we go into detail, let’s start with a full example.
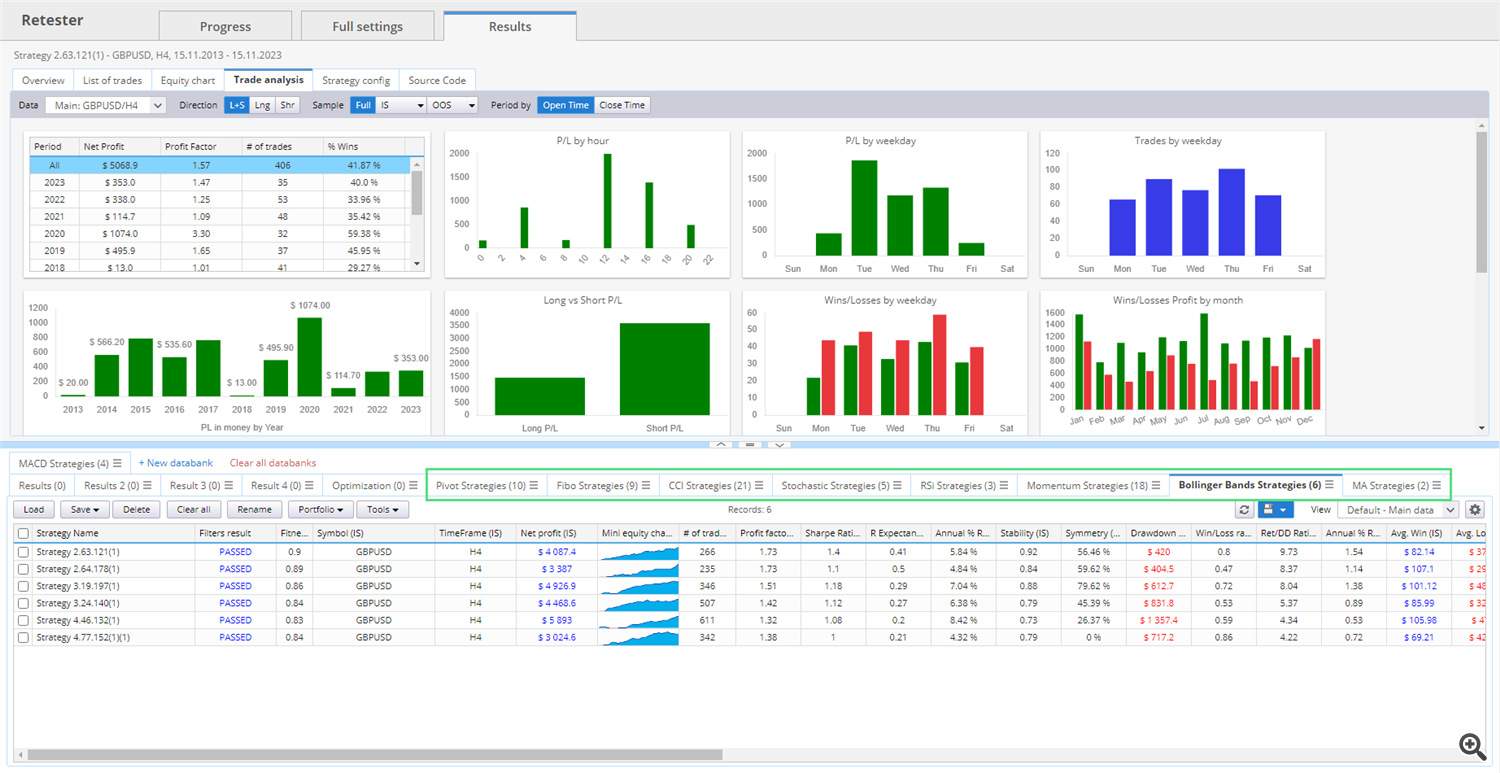
Ultimately, theory may be difficult, but what we care about is choosing a strategy that passes the test. The results of these tests are expressed as follows:
And at this point most of you might think we have completed the process, but now we have 6 strategies to manually analyze, understand the logic behind them, and compare them to others.
Our approach is to build a portfolio with a variety of strategies that we are confident will work before starting the process, and after going through several steps, we refine them so that we have a strategy that can be part of a portfolio that compensates for downturns. Good thing about other strategies. And as you can see in the image below, there are various folders with strategies based on more or less differentiated trading elements to make your portfolio as strong as possible.
Although this step may not interest you at first, you can improve the process even further by optimizing your strategies individually. In this last image, you can see an example of a portfolio of nine strategies that, as we have seen, were selected from millions of strategies, combine a variety of indicators and signals, and, above all, perform well in an out-of-sample environment. Our testing has given us confidence that this can be a good starting point for a much larger portfolio of different symbols.


