The best assistant is the Chaikin Oscillator. – Analysis and Forecast – January 7, 2024

1. Theory – How to use indicators
Developed by Marc Chaikin
This is an oscillator indicator, which measures the accumulation/distribution of money entering and leaving a currency pair. This indicator is based on the fact that the closer the closing price is to the high, the more accumulation there is in the currency pair. Additionally, the closer the closing price is to the lowest price, the greater the distribution of the currency pair.
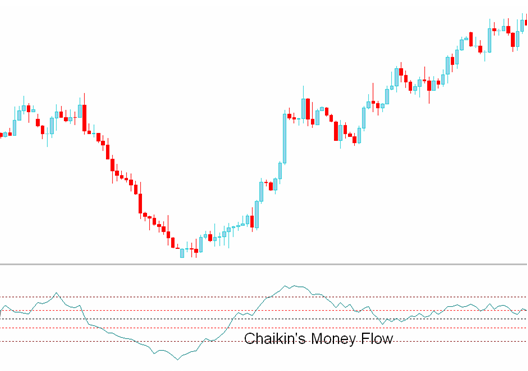
This indicator will be positive if the price consistently closes above the midpoint of the bar with increasing volume.
However, if the price consistently closes below the midpoint of the bar as volume increases, the indicator becomes negative.
Technical analysis of the Chaikin oscillator
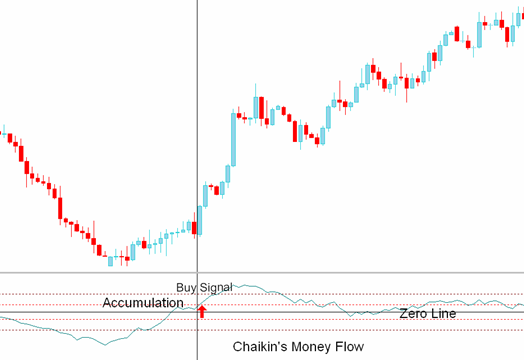
Buy Signal
A crossover greater than 0 indicates accumulation in the currency pair. Any value above +10 is a buy/bullish signal. A value above +20 indicates a strong upward trending market.
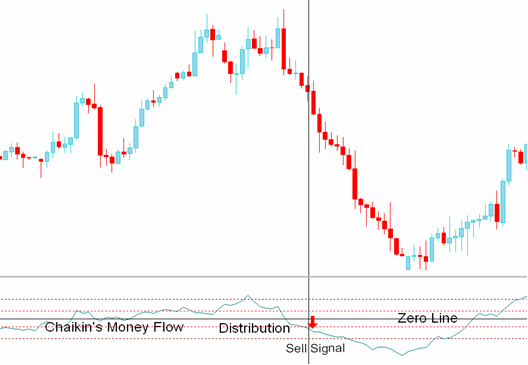
sell signal
The crossing of the zero line below 0 signifies the distribution of the currency pair. Any value below -10 is a buy/sell signal. A value below -20 indicates a strong downward trending market.
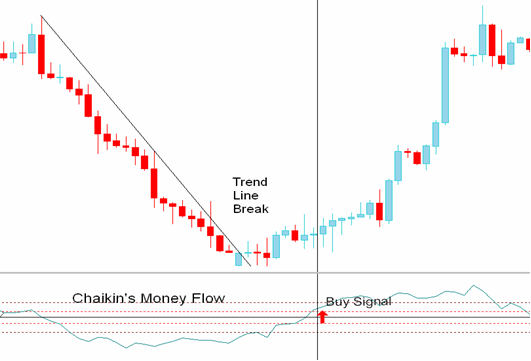
Chaikin’s Money Flow Indicator Breaks the Trendline
Fund flow indicators confirm trend line breakouts or Support/resistance levels rest. If the price breaks the upward trend trend lineForex traders should wait for a confirmation signal at an indicator value below -10.
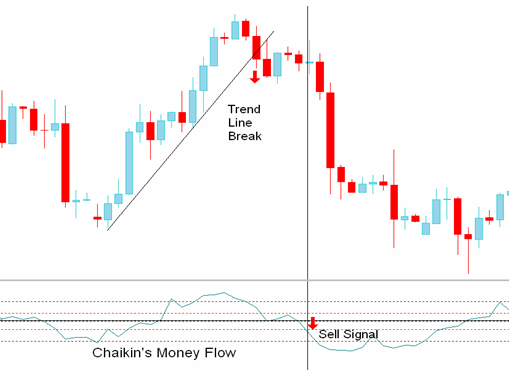
If the price breaks the downtrend line, forex traders should wait for a confirmation signal at an indicator value of +10 or higher.
divergence trading
The difference between the Money Flow indicator and price is often a signal that the market direction is about to reverse. However, as with all divergences, it is best to wait for a confirmation signal before trading a divergence. A bullish divergence signal occurs when the price makes lower lows and the Chaikin Money Flow indicator makes higher lows. A bearish divergence signal occurs when the price makes higher highs and the Chaikin Money Flow indicator makes lower highs.
2. Real examples
Chaikin Oscillator or Volume Accumulation Oscillator consists of the difference between two exponential moving averages (usually 3 and 10 days) of the Accumulated Distribution Line indicator and is used to determine price movements or differences in price movement. The Chaikin Oscillator is more accurate than the On Balance Volume indicator.
- Balance Volume: Even if the stock closed a penny higher, we add all of the day’s volume if the close is positive, or subtract all of the day’s volume if the stock closes low.
- Chaikin Oscillator: Considers the closing price in relation to the highest, lowest and average price and determines the appropriate volume percentage to allocate for that day.
The main purpose of the Chaikin oscillator is to confirm price trends and warn of an imminent price reversal. The chart below for the Nasdaq 100 ETF QQQQ shows these confirmation and divergence signals.
High #1 ~ High #2
The Nasdaq 100 ETF QQQQ hit higher highs in a generally bullish signal. However, the Chaikin Oscillator failed to reflect the rise of QQQQ and eventually made lower lows. This bearish divergence signaled an imminent price reversal.
High #2 ~ High #3
QQQQ’s highs have fallen significantly. Chaikin Oscillator also lowered the high point, confirming the downward trend of QQQQ.
Low #1 ~ Low #2
The Nasdaq 100 index made significantly lower lows, but the Chaikin oscillator made higher lows. This bullish divergence indicates that the previous downtrend may be over.
Chaikin Oscillator is a useful volume-based technical indicator that can help confirm current price action or predict an upcoming price reversal. Another technical indicator similar to Chaikin Oscillator is On Balance. volume indicator
Learn more technical indicators and other trading-related topics by subscribing to Our Channels: t.me/Dollar_forex_ok

")

