A decline in the ETH/BTC ratio shows Bitcoin’s rising market dominance.

The Ethereum (ETH) to Bitcoin (BTC) ratio (ETH/BTC) is a pivotal indicator that provides insight into the relative strength and market power of the two largest cryptocurrencies. This ratio, which represents the value of one Ethereum in terms of Bitcoin, serves as an important tool for investors and analysts to gauge comparative performance and sentiment towards these digital assets.
Historically, this ratio has experienced significant fluctuations. Ethereum’s value reached an all-time high in June 2017, when it significantly surpassed Bitcoin’s value. Conversely, the ratio hit an all-time low in December 2016, reflecting a period when Ethereum’s value fell significantly relative to Bitcoin.
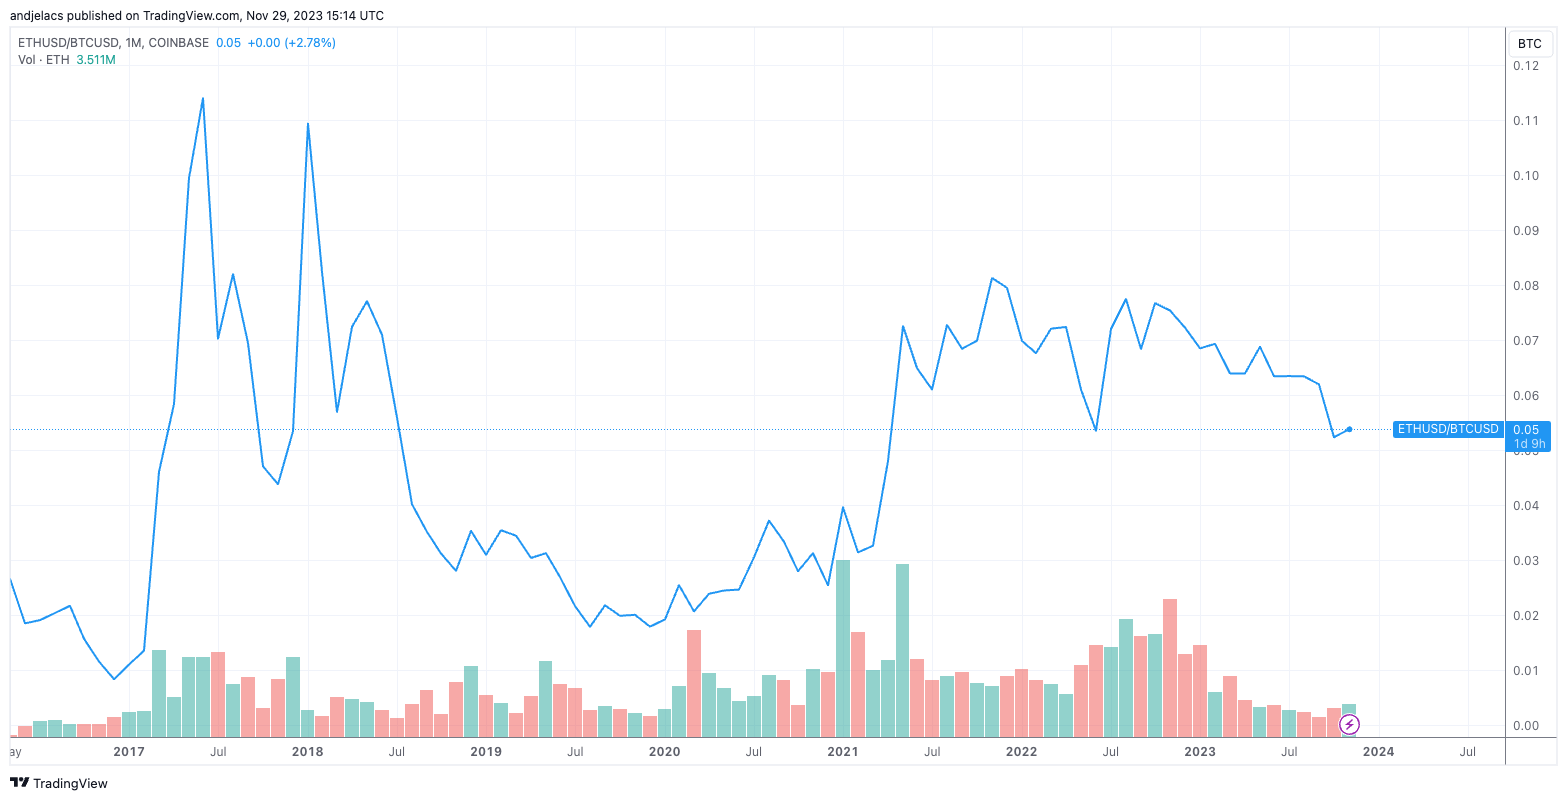
However, the overall volatility of this ratio, as measured by the standard deviation of past closing prices, is relatively modest. This indicates that BTC and ETH generally mirror each other’s market trends, so their prices often move in parallel.
The synchronized movement of BTC and ETH is the decisive factor behind the observed stability of the ETH/BTC ratio. When both cryptocurrencies experience similar bullish or bearish trends, their ratios remain balanced, highlighting the interdependence of market movements. This phenomenon is evidence of the interconnectedness of cryptocurrency markets, with major currencies often sharing similar market sentiment and external influences.
From January 2020 to October 2022, the ETH/BTC ratio was on the rise, largely due to expectations surrounding the merger that would see Ethereum transition to a proof-of-stake consensus mechanism. This significant upgrade to the Ethereum blockchain was seen as a pivotal step toward improving efficiency and scalability, potentially increasing its value compared to Bitcoin.
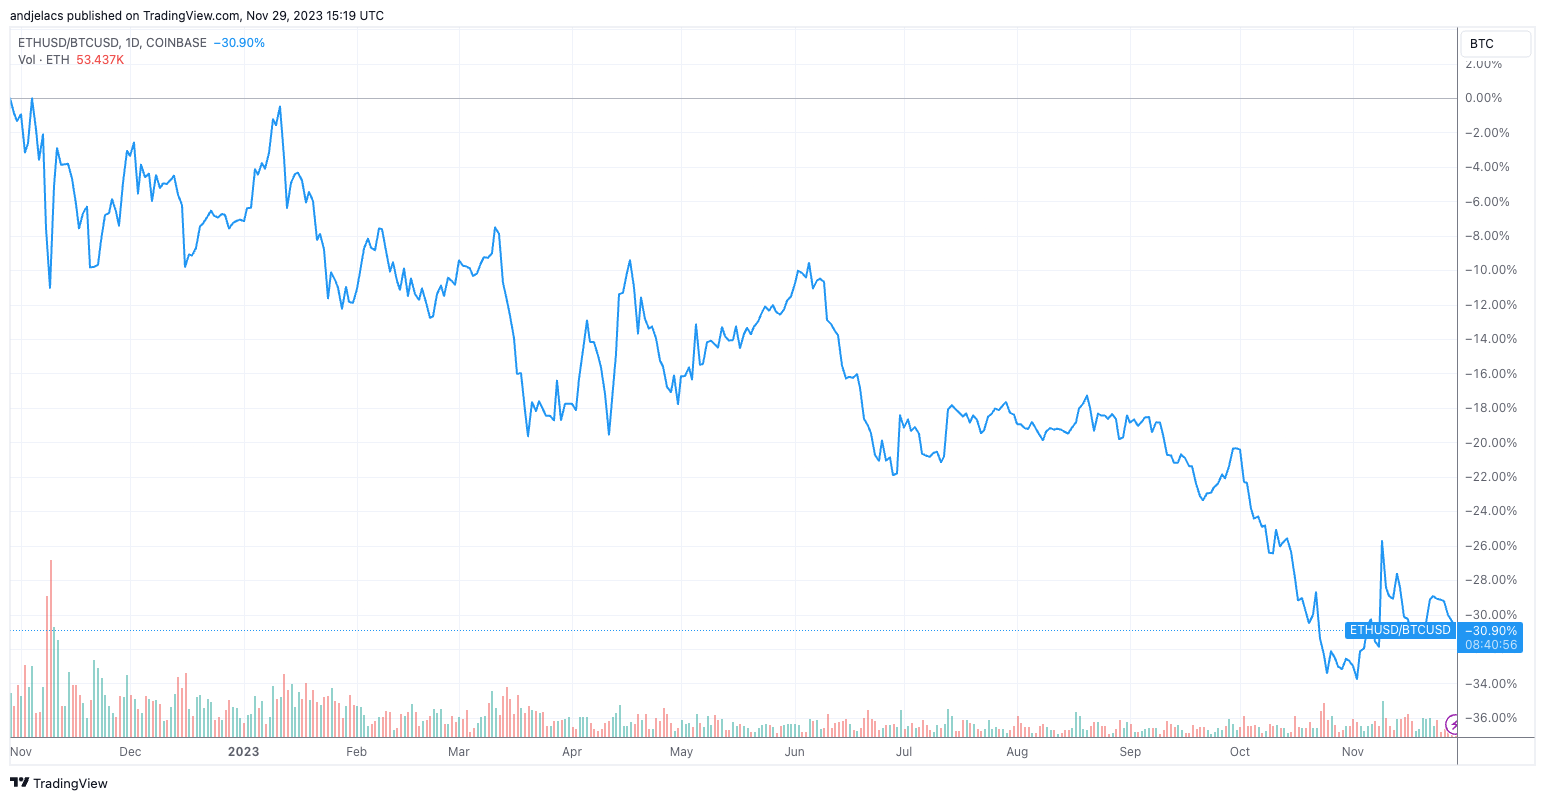
However, after October 2022, the ratio showed a decreasing trend. This decline may be a market correction following high expectations for the Merge, or it may be a reflection of broader market trends affecting both cryptocurrencies. Additionally, Ethereum’s growth or decline in value during this period was not as pronounced as Bitcoin, showing a decline in its relative value.
The ETH/BTC ratio provides important insights into the current dynamics of the market. The relatively low ratio can be mainly attributed to the larger price appreciation of Bitcoin than Ethereum. YTD, Bitcoin is up 126%, while Ethereum’s growth, while noticeable, is relatively low at 69%. This growth rate differential has been a key factor in suppressing the ETH/BTC ratio.
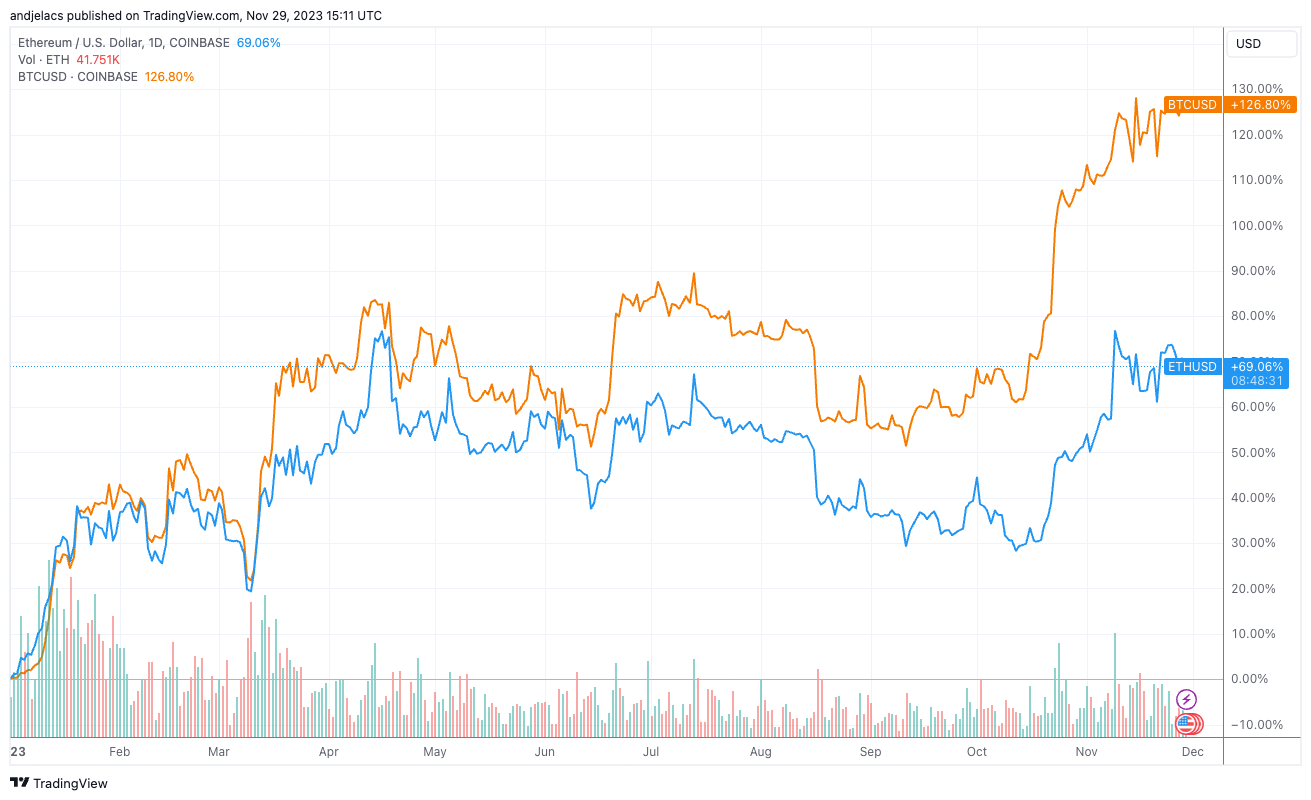
The different trajectories of the price show that Bitcoin’s market power is increasing. While Ethereum continues to play an important role in the cryptocurrency ecosystem, particularly as a home for DeFi, Bitcoin’s larger price increases are becoming more prominent and highlight greater investor confidence. This trend is reflected in the ETH/BTC ratio, which serves as an indicator of Bitcoin’s stronger position compared to Ethereum.
The movement in the ratio clearly indicates that the balance of power within the cryptocurrency market is changing, with Bitcoin currently playing a more dominant role.
The post ETH/BTC Ratio Declines Shows Bitcoin’s Rising Market Dominance appeared first on CryptoSlate.
, 이더리움과 동등하다고 알려진 ‘타입 1 증명자’ 출시")


