A Litecoin bear flag could cause a 41% crash to this level, explains the analyst.

One analyst explained that a bearish flag is potentially forming in Litecoin, and if confirmed, LTC could fall to this level.
There is a risk that Litecoin will fall significantly due to this bear flag.
in post At X, analyst Ali pointed out the possibility of a bearish flag forming for Litecoin. A “bear flag”, as the name suggests, is a pattern in technical analysis that looks like a flag on a pole.
A pattern is formed when an asset observes a sharp downward movement followed by a period of consolidation. This consolidation occurs towards an overall slight upward trend. That is, upper levels are created by connecting higher highs and lower lines are created by connecting higher lows.
Before consolidation, the downtrend complements the poles and the channel looks like a flag. Inside the flag, price is naturally likely to feel resistance at the top and support at the bottom.
Bearish flags are generally considered continuation patterns. This means that the downward trend continues even after the pattern is formed. This continuation occurs when the price finally ends its consolidation and breaks through the lower level of the flag.
Similar to bear flags, there are also ‘bull flags’ that form in the opposite situation. This pattern occurs when prices rise sharply after a period of downward consolidation.
Now, here is a chart shared by an analyst that highlights a bearish flag that could be forming in Litecoin’s 3-day price.
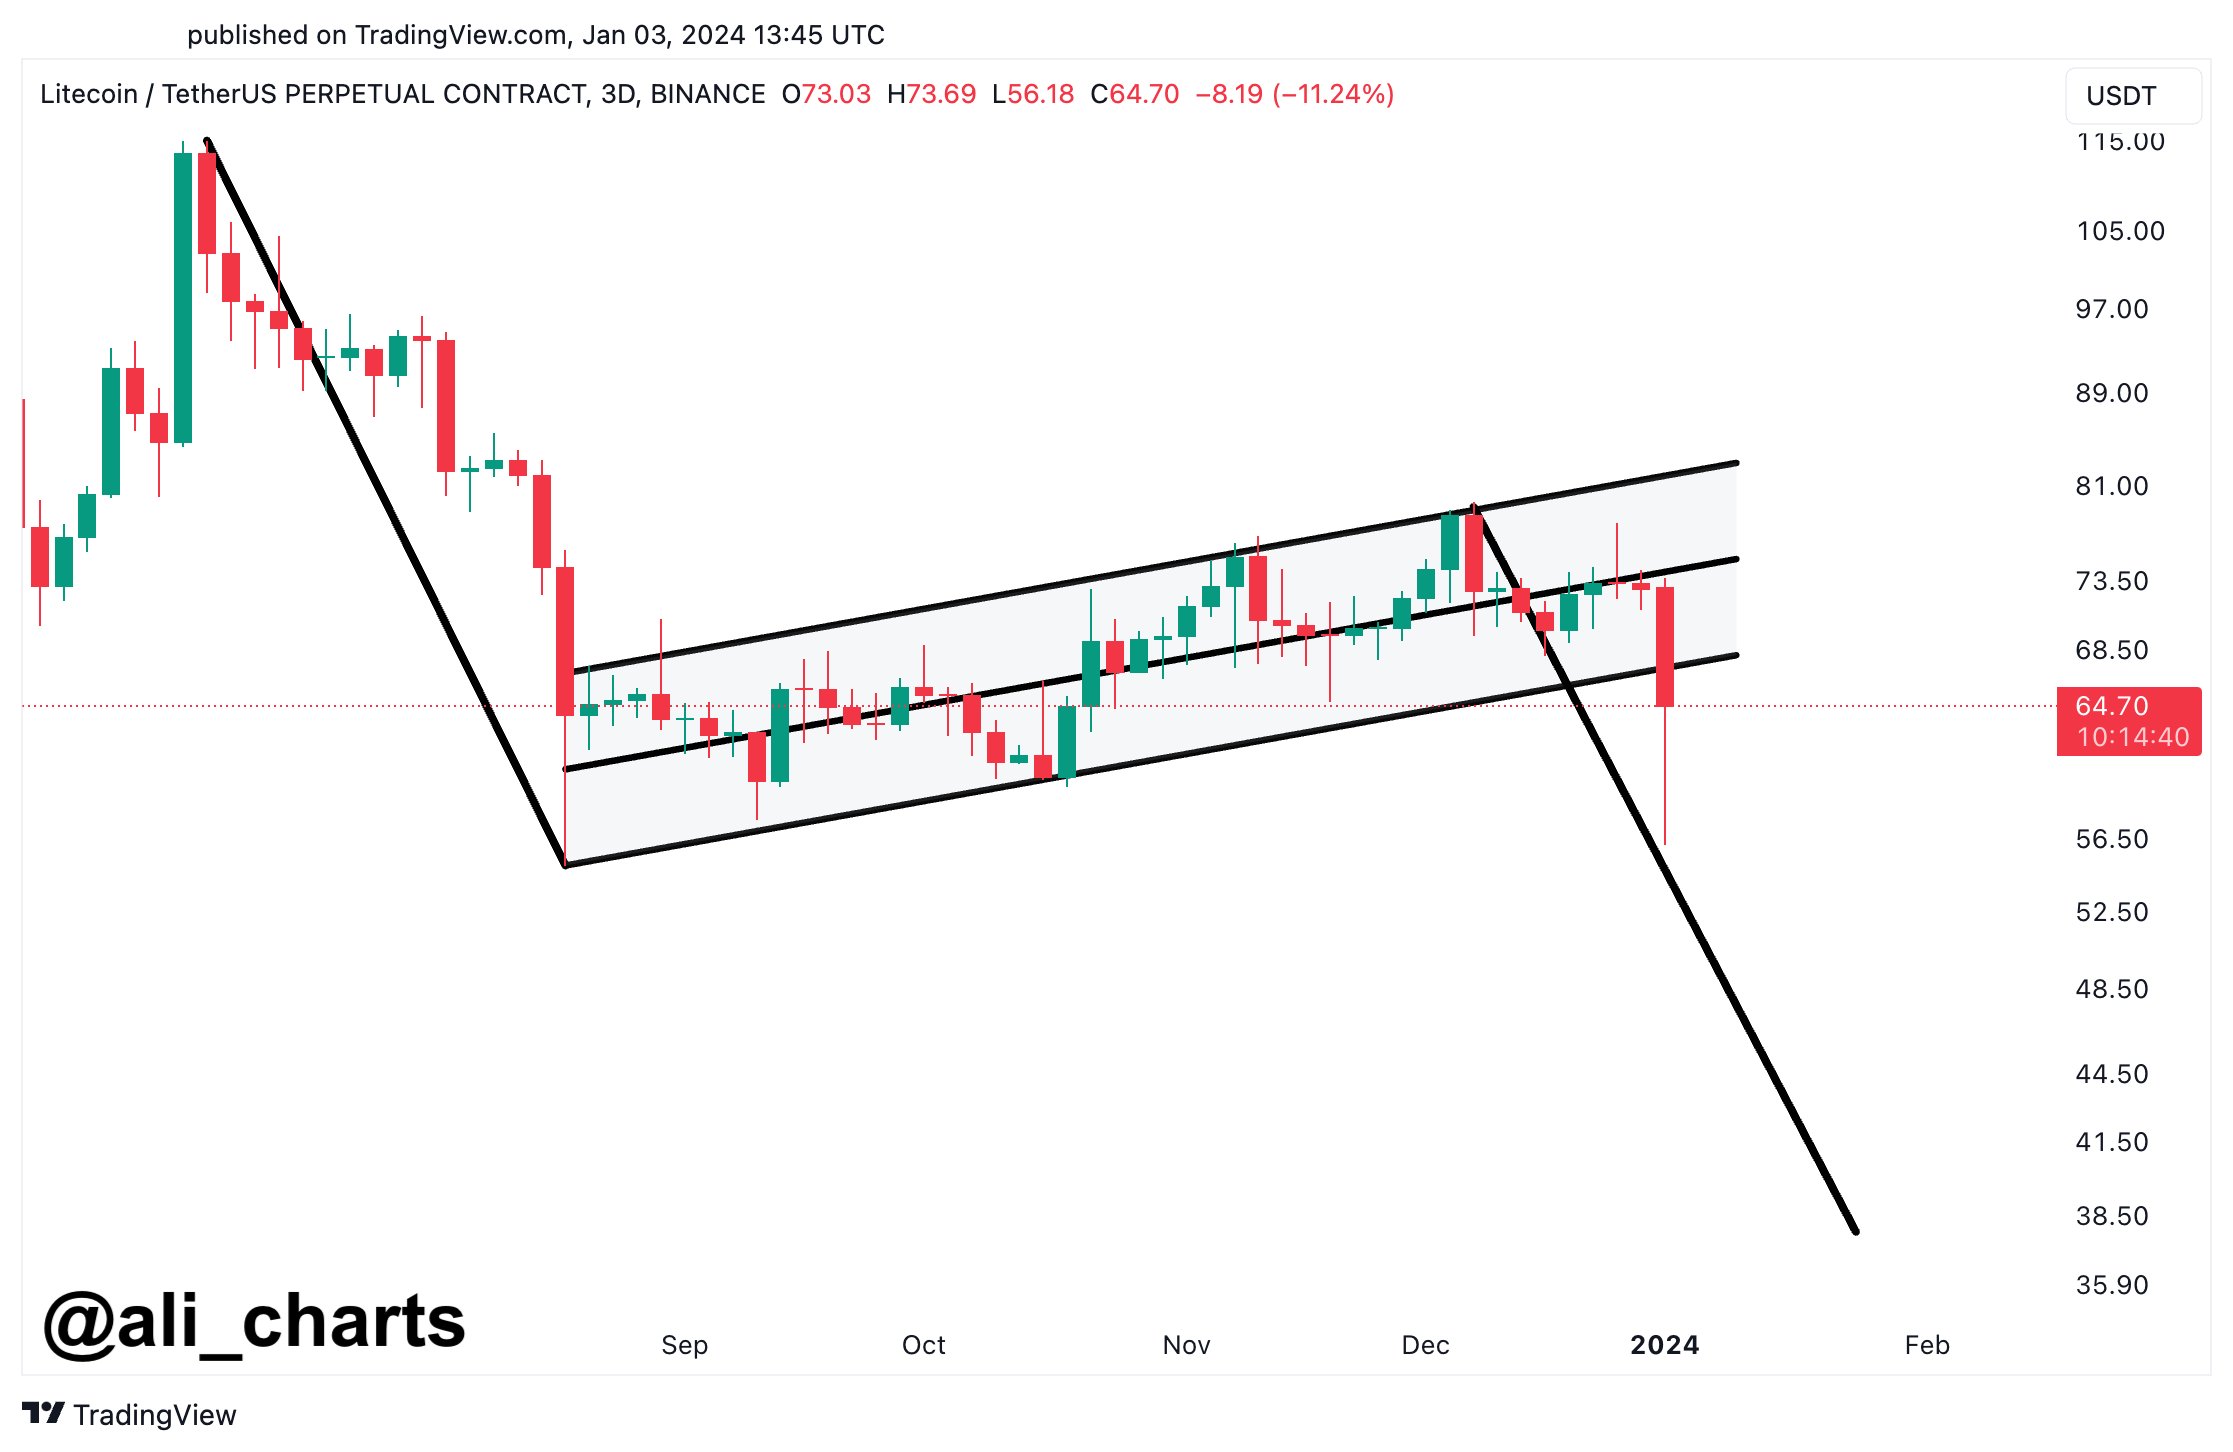
The pattern currently forming in the 3-day price of the cryptocurrency | Source: @ali_charts on X
Looking at the graph, we can see that Litecoin’s 3-day price has likely been consolidating within a bearish flag over the past few months. However, with the recent selloff in the asset, prices appear to have finally broken out of the pattern in a downward direction.
The coin’s plunge came as the collapse reverberated through the rest of the cryptocurrency sector. However, the plunge was particularly damaging to LTC because, unlike many other assets, it had never enjoyed such a sharp rally to start the year.
“Litecoin outlook after recent dip It seems challenging,” says Ali. “If selling pressure continues, LTC will A drop to $38 could potentially confirm the formation of a bearish flag.”
Typically, the breakout of any flag pattern is approximately the same length as the previous pole, which is why analysts chose this target. If Litecoin’s potential decline were to proceed this way, the asset would be down more than 41% from its current price level.
LTC price
Litecoin had previously surpassed the $73 mark, but after this 11% plunge, the coin has now fallen to $65.
Looks like the price of the coin has been moving sideways since the plunge | Source: LTCUSD on TradingView
Featured image by Kanchanara on Unsplash.com, chart by TradingView.com
Disclaimer: This article is provided for educational purposes only. This does not represent NewsBTC’s opinion on whether to buy, sell or hold any investment, and of course investing carries risks. We recommend that you do your own research before making any investment decisions. Your use of the information provided on this website is entirely at your own risk.


