Abiroid Quarters Scanner Description – Trading Systems – September 20, 2024

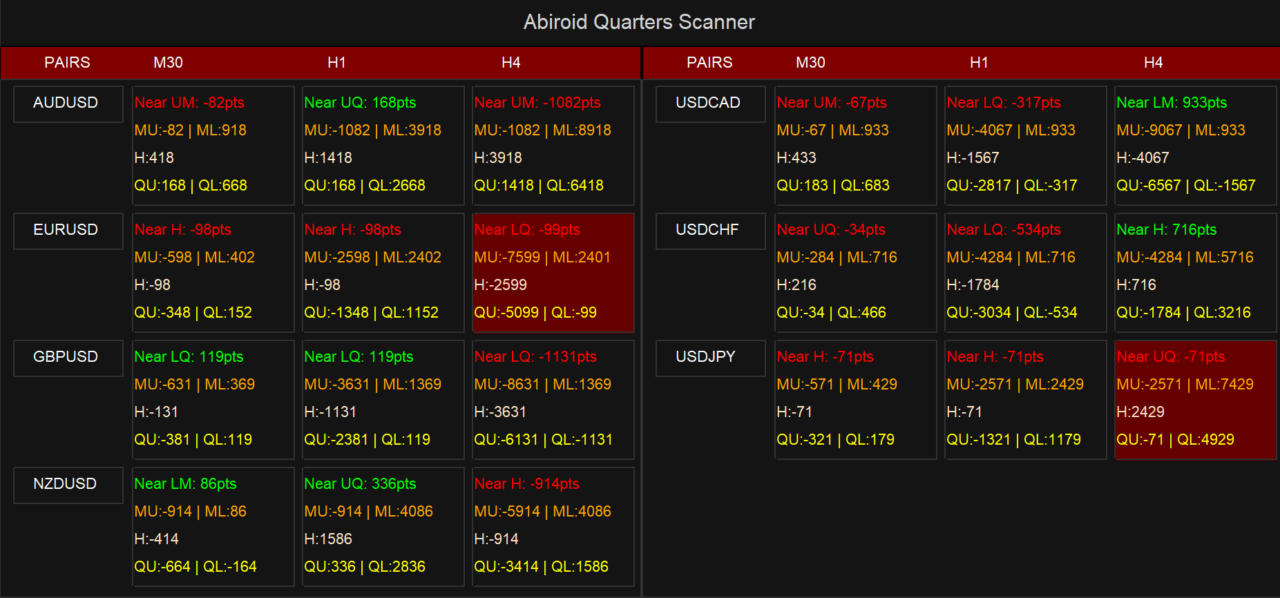
This scanner uses the quarter theory. It finds the quarter closest to the current price. And when the price gets within a few points, it highlights it and sends an alert.
https://www.mql5.com/en/market/product/114996
characteristic:
- Define major branching distances for each time zone.
- Usage Options:
- Midway point between majors
- Quarter between half point and major point
- Find the nearest 1/4 location and prices
- Highlight and send notifications
- Show/Hide Quarter Lines
- Show/Hide Price and QP Distance
Additional Notes:
The divergence indicators for individual charts are as follows:
https://abiroid.com/download/quarters-theory-zip/
Show only the closest QP:

All QP distances turned on:

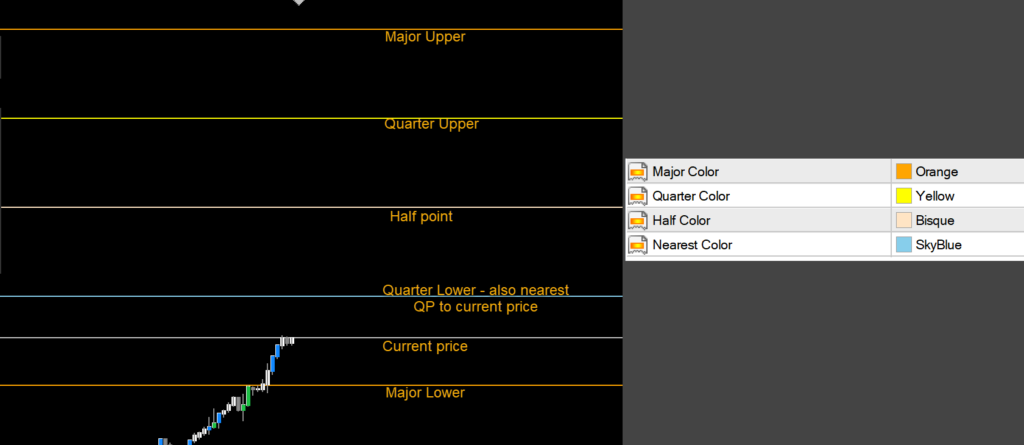
MU = upper major, ML = lower major
H = midpoint
QU = 1/4 upper, QL = 1/4 lower
How the calculation works:
QP = Quarter Point. This scanner finds five quarter points.
Two majors (upper/lower), one half-point between the majors, and two quarter-points (upper/lower) between the half-points and the majors.

Additionally, you can choose different distances between majors depending on your time zone.

Let’s say the M30 distance is 1000. And if the price of the EURUSD pair is 1.12406, the major distance remains at 1000 points. The upper major distance is 1.13000 and the lower is 1.12000.
Halfpoint will be 1.12500. The upper quarter will be 1.12750 and the lower quarter will be 1.12250. Now the price is closest to the Halfpoint. That’s why it is highlighted in SkyBlue.
And the scanner shows:

And for H4, the distance is 10000, so the upper major key becomes 1.20000 and the lower major key becomes 1.30000.
All distances are in points. Note that 10 points = 10 pips = 1 pip.
setting:
General scanner settings:
https://www.mql5.com/en/blogs/post/747456
Refresh after tick refreshes the dash based on the number of ticks the chart indicator has been loaded for. Points are calculated based on the distance between major QP points.

How to use:
The price uses quarter points as support/resistance levels. These are like magnetic levels. The price slows down around these points and ranges a bit. Then the price breaks through and continues the trend or bounces and reverses. And the high volume bar breakout is also important because it is likely to continue moving in the direction of the breakout.
These levels can be used for validation. Prices usually move in the direction of the overall upper time frame trend.


