Bearish Harami Cross Candlestick Pattern

Bearish Harami Cross Candlestick Pattern: Traders use technical analysis to analyze and predict future movements in market prices. Candlestick patterns are a part of technical analysis favored by traders to understand and predict future price movements of securities.
Here in this article we will discuss what the bearish harami cross candlestick pattern means, its formation, and how to set up a trade along with the pattern formation.
Bearish Harami Cross Candlestick Pattern – Definition
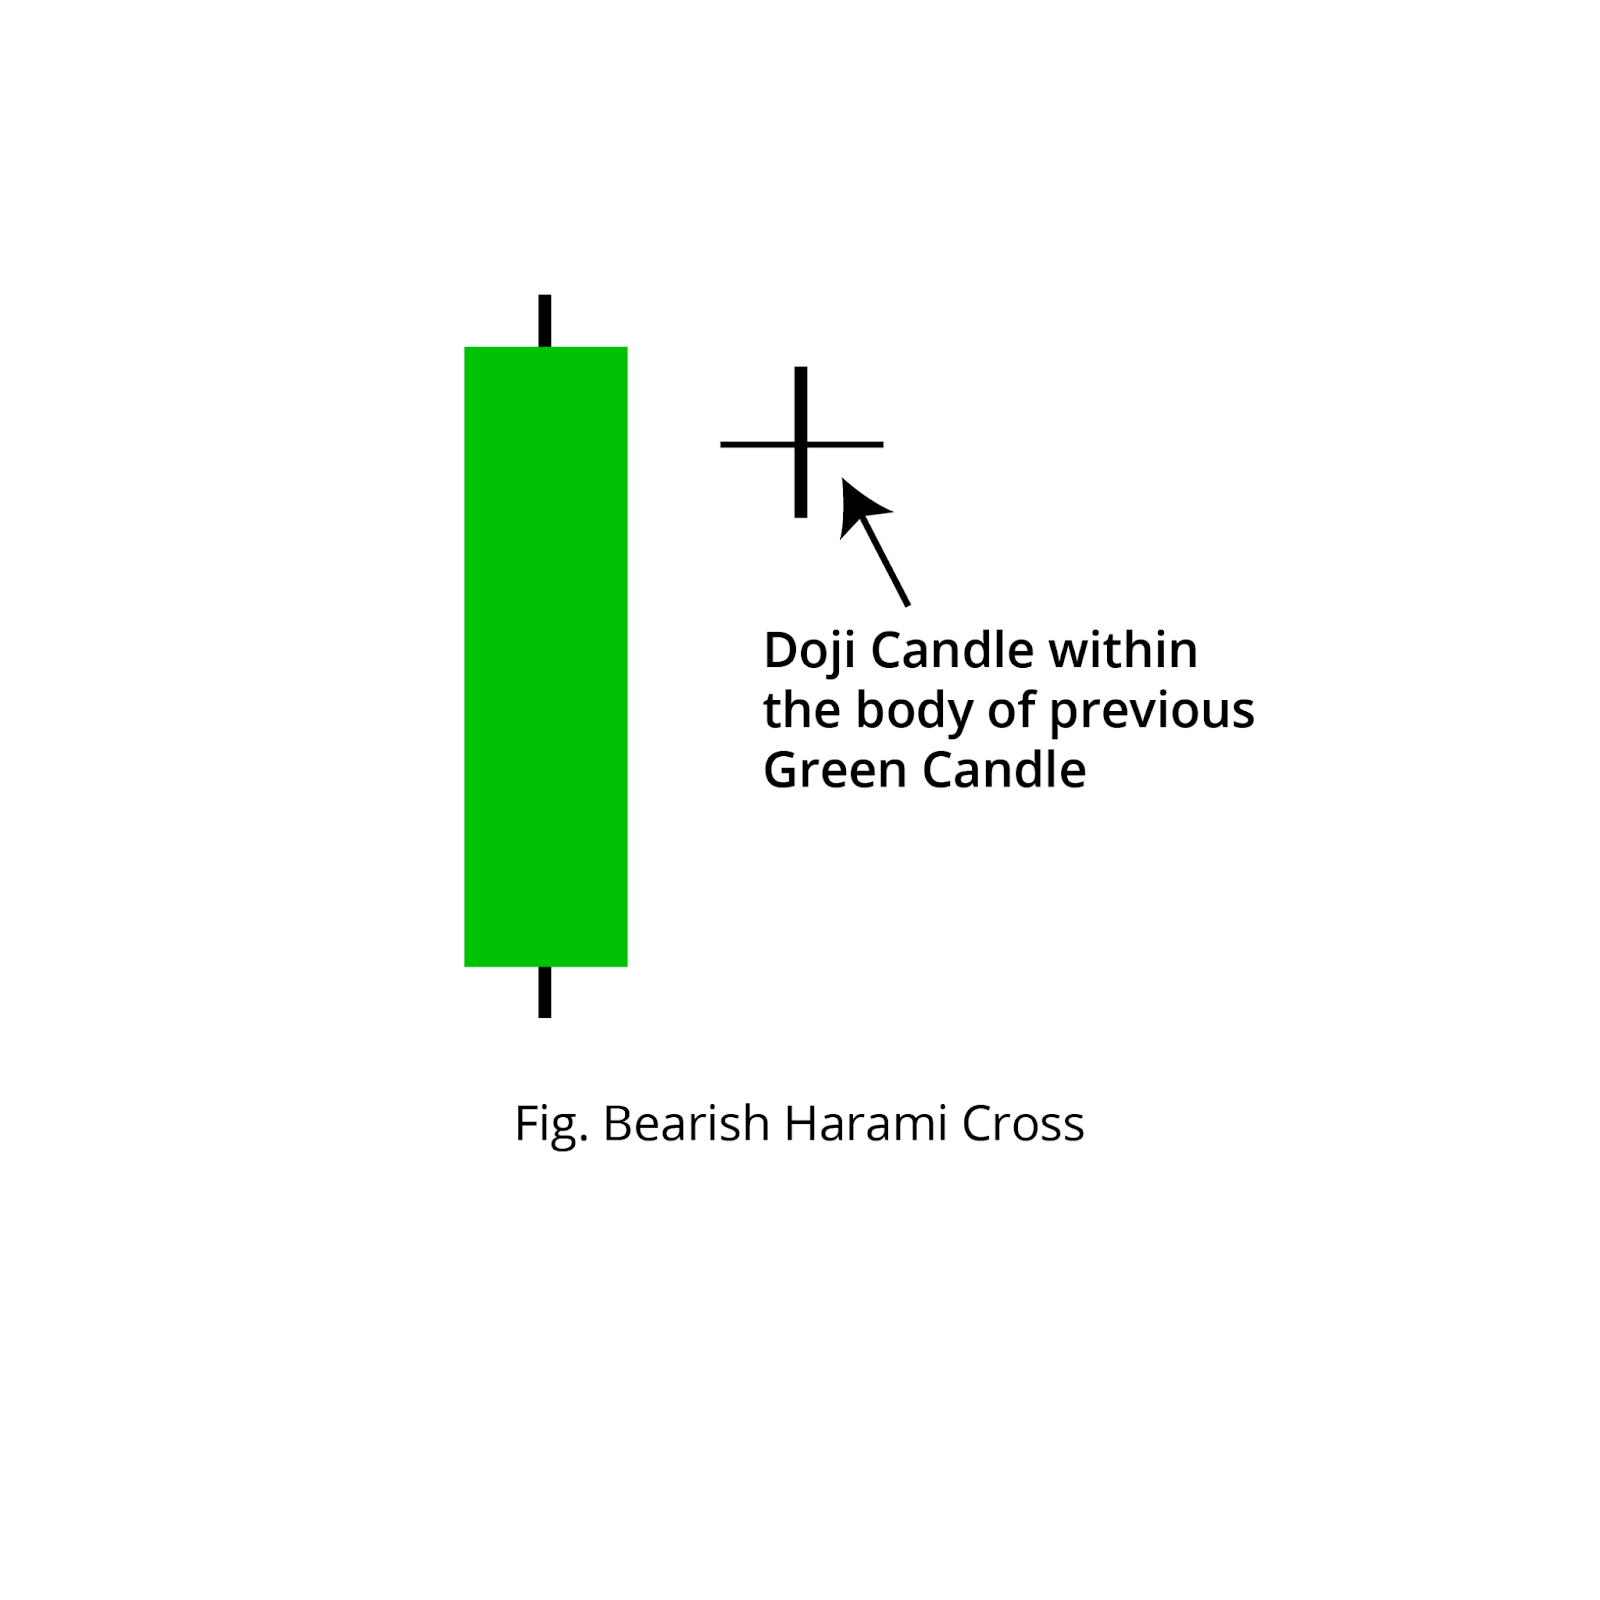
The bearish Harami Cross candlestick pattern is a two-candlestick pattern that indicates a possible bearish reversal in the security. This pattern consists of a large bullish candle (green candle) and a doji candle.

The doji candle in this pattern is formed within the body of the first candle. This means that the high and low prices of the Doji candle are within the range of the opening and closing prices of the first candle. It is desirable that the stock’s previous trend was an upward trend and the subsequent appearance is more indicative of a bearish reversal.
Note: If you want to learn candlestick and chart trading from scratch, here are some of the best books available on Amazon! Get the book now!
Bearish Harami Cross Candlestick Pattern – Meaning
The bearish harami cross candlestick pattern is desirable to appear during an uptrend as it signals a bearish reversal. Here, the first candle formed in this pattern is a long green candle, indicating a strong buying trend in the security.
After that, the second candle opens at a lower price than the closing price of the first candle. Here, the opening and closing prices of the second candle are close to each other. doji candle. Moreover, during that period, the stock price will never be higher than the closing price of the first candle, nor will it be lower than the opening price of the first candle.
The formation of a doji on a bearish harami indicates indecision in the market as it means that the buying and selling pressures are equal. This indecisiveness can cause participants to start booking profits and, as a result, attract more sellers. Therefore, the formation of this pattern is usually associated with bearish momentum in the stock price.
Bearish Harami Cross Candlestick Pattern – Strengths
There are several situations where the formation of the Bearish Harami Cross candlestick pattern provides a stronger bearish reversal signal.
- If it forms near a resistance zone: The formation of this pattern near a resistance zone is a strong signal that the price of the security is about to fall. This is because there will already be several sell orders in that zone and as this pattern forms, more sellers will come in.
- Formed when the price is at an all-time high: This is also a strong sign that the price is likely to decline in the short term or enter a downtrend entirely. This is because if the price reaches an all-time high, there may be anxiety in the market and people may want to close the trade, retaining the profits they have already made. This emotion is triggered when this pattern is formed when the price reaches an all-time high.
- When RSI is configured to be in overbought territory: This is a strong indication as the RSI is in overbought territory and when this pattern forms it means there are more sellers in the market. Therefore, the price may show downward momentum.
Bearish Harami Pattern and Bearish Harami Cross Pattern – Differences
The second candle formed in the bearish Harami candlestick pattern is a proper red candle formed within the body of the first candle. The second candle is a Doji candle with a bearish Harami Cross candlestick pattern.
The formation of a bearish Harami candlestick pattern provides a slightly stronger bearish reversal signal. The second candle formed on that candle is a proper red candle, indicating higher selling pressure, while the Doji indicates equal buying and selling pressure, providing a bearish reversal signal.
Also read…
Bearish Harami Cross Candlestick Pattern – Trading Ideas

- entry: In this pattern, if the price of the security falls below the opening price of the first candle, the trader can make a sell entry.
- Target: Traders can exit a trade when the security’s price reaches near an immediate support zone. Once this level is reached, you can also book a partial profit on the trade and hold the remaining position until the next support level.
- Stop Loss: Traders can set a stop loss near the closing price of the first candle in this pattern.
Bearish Harami Cross Candlestick Pattern – Example
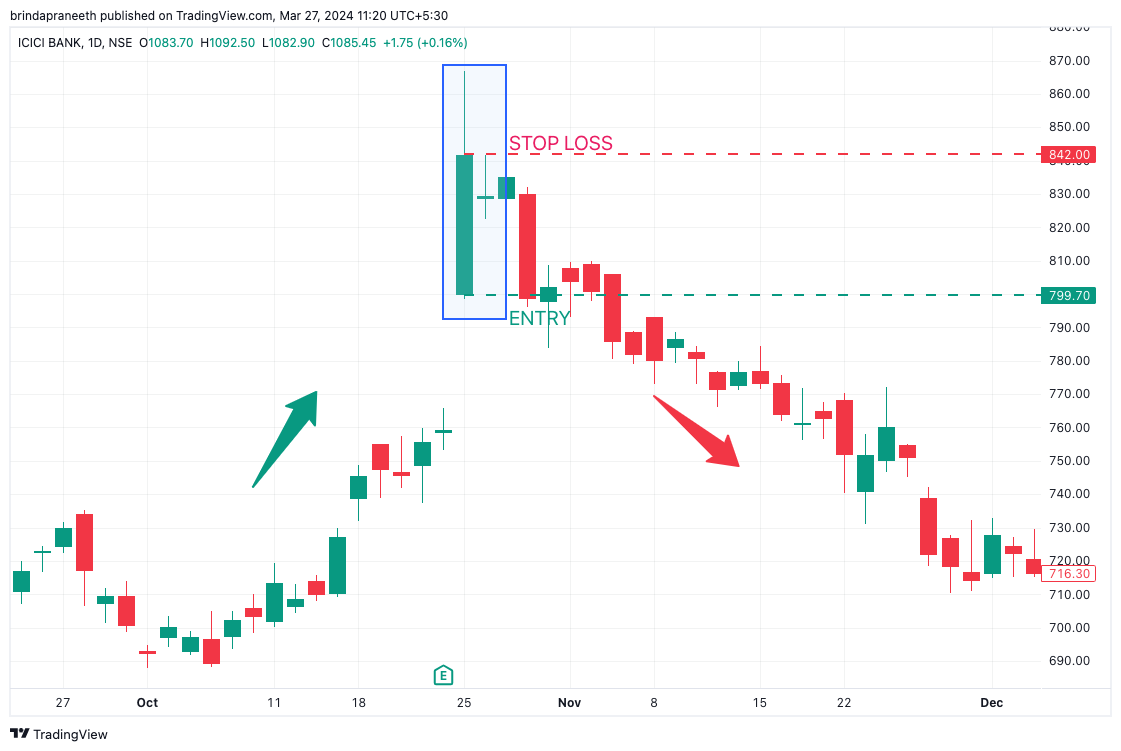
In the ICICI BANK chart above, the period is 1 day. Included in the two candles is a bearish Harami Cross candlestick pattern. As you can see, a pattern was formed at the top of an uptrend, and after this pattern was formed, the price entered a downtrend.
A trader could enter a sell entry for Rs. 799.70 and the stop loss was Rs. 842
Bearish Harami Cross candlestick pattern combined with RSI indicator
Traders can get an even stronger indication of a trend reversal by combining the formation of a bearish Harami Cross candlestick pattern with the RSI indicator. If RSI is also in overbought territory when this pattern forms, this is a stronger signal of bearish momentum than a simple pattern formation. Therefore, if both indicate bearish momentum, a trader can take a sell entry.

As seen in the ICICI BANK chart above, RSI was also in overbought territory when the bearish Harami Cross candlestick pattern was formed and the price was falling as indicated. This would have been a stronger sign and confirmation. merchant When this pattern was formed.
Bearish Harami Cross Candlestick Pattern – Limits
The formation of a Doji candle indicates weakening buying pressure and market indecision. This indecision is not the same as selling pressure overcoming buying pressure. So prices may rise again. Therefore, market participants must set appropriate stop losses to minimize losses in such scenarios.
Read More: Best Ethanol Stocks with High FII Holdings
conclusion
In this article, we understood what the bearish harami cross candlestick pattern is, its meaning and characteristics, and how traders can trade it. The bearish harami cross provides a strong bearish indication and traders should combine it with the RSI indicator to confirm bearish movements.
Traders are also advised to set an appropriate stop loss to minimize losses if a trade goes against their analysis.
Written by Praneeth KadaGI
By leveraging the Stock Screener, Stock Heatmap, Portfolio Backtesting and Stock Comparison tools on the Trade Brains portal, investors have access to comprehensive tools to identify the best stocks, stay updated and informed with stock market news. invest.

Start your stock market journey now!
Want to learn stock market trading and investing? Check out exclusive stock market courses from FinGrad, a learning initiative from Trade Brains. You can sign up for free courses and webinars from FinGrad and start your trading career today. Sign up now!!


