BP: Refueling The Cash Engine (Rating Upgrade)
Leon Neal
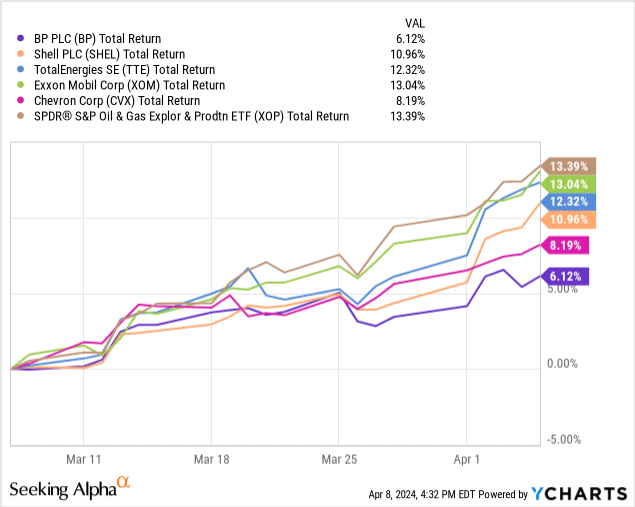
I recently published my first research on British Oil & Gas Supermajor BP p.l.c. (NYSE:BP) in which I offered a deep dive into its US upstream subsidiary bpx. Given the asset’s disadvantage to key US E&P peers in terms of reserve makeup and cost competitiveness, I initiated BP at Underweight. Since then, shares have underperformed its US and EU Supermajor peers, delivering ~6% total returns, around half of the low to mid-double digits achieved by peers ex-CVX where I estimate the legal dispute regarding the Hess acquisition to have created a significant overhang. Notably, E&Ps have outperformed all of the supermajors with US onshore unconventional producers (bpx’ main peer group) able to highly capitalize on the recent rise in oil prices, indicating BP’s comparably weaker position as outlined in my first note.
Following this underperformance, I see favorable recent management communication backed by a peer-leading shareholder distribution framework as key potential near and mid-term catalysts to propel the stock higher. With a well communicated plan in place regarding the pace of BP’s energy transition and a highly supportive valuation at ~40% discount to peers, I view BP as the most enticing play in the sector at the moment, especially after the recent runup for peers. Raise shares to Overweight with a price target of $60 per US ADS (~54% price upside), making it the stock with the most favorable risk/reward outlook among my coverage of integrated oils.
Company Overview
The currently smallest of the five Supermajors by market cap, UK-headquartered BP is active along the global Oil & Gas value chain from exploration and production to fuel refining and marketing. As of 2024, the company has significant operations and asset bases in Europe, the US, the Middle East and South East Asia and operates across 3 segments with the upstream business split between liquids-focused and gas-focused plays.
Next to Oil & Gas BP also has significant operations among lower carbon and “net zero” businesses including EV charging, renewable power generation and biofuels which supports the company’s goals to eventually transition from an IOC (International Oil Company) to an IEC (Integrated Energy Company).
bp Global Operations (bp IR)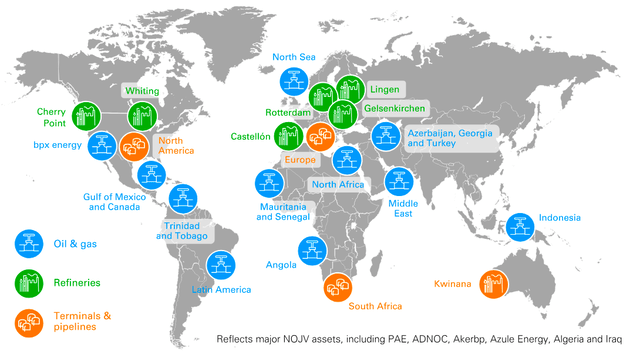
Oil Production and Operations – The oil/liquids component of BP’s upstream business, including its US E&P subsidiary bpx energy (see here for my deep dive). The division produces hydrocarbons globally with a focus on offshore exploration in the North Sea, the Gulf of Mexico, Brazil’s Pre-Salt basins as well as the Caspian Sea. FY23 average daily production stood at ~1.4Mboe of which 73% were comprised of liquids (mainly crude) with ~5.1Bboe of proved reserves providing a production coverage (R/P) of 10.3 years.
Global Liquids Production Footprint (bp IR)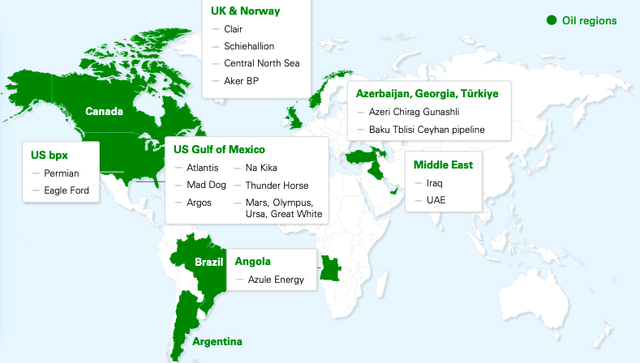
Gas and Low Carbon Energy – Multifaceted segment comprised of both BP’s gas business including gas-focused upstream, integrated gas and gas trading as well as its low carbon business which produces and distributes renewable electricity. FY23 hydrocarbon production for the segment was ~0.9Mboed (89% gas) with a significantly lower reserve depth of just 4.8 years R/P.
Among integrated gas, strong YoY growth in LNG capacity from 19 to 23 Mtpa driven by additional investments and start-ups puts BP well on track to reach its 2030 target of ~30Mtpa. Net installed renewable capacity at YE23 was 2.7GW with 6.2GW currently under FID and ~58.3GW in the pipeline, heavily weighted towards solar power and with an emphasis on the APAC region. Despite the strong and very public push into renewables and power generation, the segment continues to be dominated by hydrocarbons, with ~75% of FY23 capex allocated to gas production or distribution.
Global Gas and LNG Footprint (bp IR)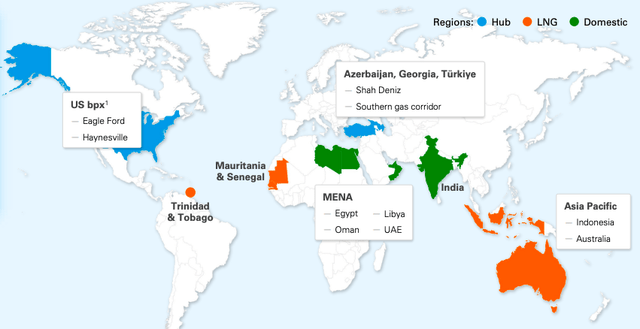
Customers & Products – The C&P segment encompasses BP’s downstream activities across the two subdivisions of customers and products. The customers subdivision is comprised of the group’s fuel marketing and retail businesses, with ~21k global retail sites as of YE23. A key growth driver and expansion focus in recent years has been the transition from a pure gas station business to a more holistic convenience business, including EV charging. This has recently been underscored by BP’s 2023 acquisition of Travel Centers America which added ~290 US locations bringing total convenience footprint to 2,850.
While the customers subdivision represents BP’s client-facing operations, the products segment is comprised of the group’s refining and chemicals businesses, complimented by product trading. As of FY23 bp held a total refining capacity of ~1.6MBoe, split roughly equal between the US and Europe with its Midwest-US Whiting refinery the largest operated at 440Kboed capacity. Total throughput in FY23 was ~1.4Mboed for a record 96.1% refining availability. Following the acquisition of Archaea Energy, the division also includes one of BP’s strategic growth pillars in biogas with current production volumes of 22Kboe per day.
FY23 Production
During 2023, BP averaged a daily production of ~2.3Mboe of which 48% or ~1.1Mboed was comprised of liquids (majority crude with ~5% NGLs mainly at bpx). The remaining 52% were contributed by natural gas at ~6.9Mcf average daily production. Overall production was roughly flat from 2022 as natural field and well declines were offset by new project startups in the North Sea, the Gulf of Mexico (“GoM”) and South East Asia.
The Americas continue to account for most of BP’s production, with the US making up the largest single-country contributor overall at ~27%. Production in the US was split 15%/12% between BP’s Lower 48 onshore E&P subsidiary bpx and its deepwater assets in the GoM. Trinidad also contributed a significant amount to group production, majority in the form of natural gas to fuel the country’s sizeable recent LNG developments.
Next to the Americas, the Middle East and North African regions represent a significant share of group volumes, with Egypt accounting for ~9% (mostly gas) and Abu Dhabi and Azerbaijan both at ~7% (liquids/gas). Compared to peers, BP has the largest share of production in MENA giving it both benefits in cheap onshore production but also exposing it to the region’s significant geopolitical risk.
Given BP’s legacy, the European North Sea across both the UK and Norwegian economic zones also continues to hold a sizeable share at ~7% of production, managed either directly or via its stake in Aker BP (OTCQX:AKRBF). APAC exposure remains lower than peers at ~5%, mainly in the form of gas developments in Australia and Indonesia. Africa also remains a smaller part of the portfolio with BP’s only sizeable asset being its 50% stake in Angola’s Azule Energy JV with Eni.
FY23 Production Split (Company Filings)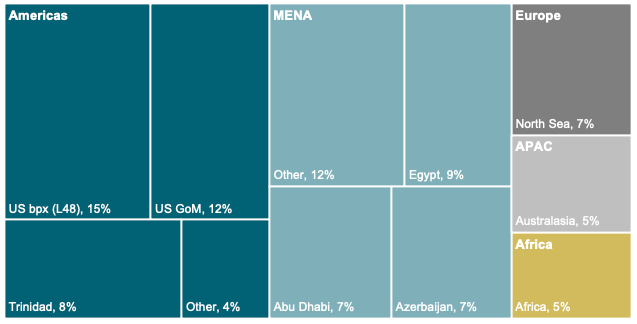
Key Investment Thesis
More resilient Upstream outlook following Looney ousting, but low reserve depth remains a risk. Under its new “pragmatism”, BP follows key rival Shell in significantly toning down its net zero and energy transition ambitions. Despite new CEO Auchincloss confirming the 2050 net zero target, he calls for BP to get there in a “pace that society demands” and “without wasting money”, clearly indicating a renewed focus on profitability and efficiency which should translate to higher returns on capital in both the company’s upstream and downstream operations.
As part of this, management now aims at keeping Oil & Gas production stable at ~2.3Mboed through 2025 and then slowly declining towards ~2Mboed by 2030 by base decline and divestments, meeting the company’s long-held target to reduce output by 25% vs 2019. Despite BP confirming this as recently as their Q4 earnings, I would not be surprised to see a further revision of this goal as the price outlook for oil & gas remains strong and estimate such an announcement could serve as a significant upside catalyst for the stock.
With production of liquids actually projected to grow at ~3% annually through 2027, I model liquids’ share of production to grow from 48% as of 2023 to 55% by 2027 after which I expect divestments, especially in oil, to lower the share to BP’s targeted 50/50 oil/gas split by 2030. With oil production rising against a flat total hydrocarbon output, I estimate BP’s upstream profitability to significantly improve in the near term as the company can take advantage of the current price environment characterized by higher liquids prices and lower gas prices. Key component of this strategy is the company’s US subsidiary bpx which, despite lagging peers in key metrics, has ample spare capacity and the ability to quickly ramp up production (Liquids output total growth 23-25E ~48%) utilizing its short-cycle shale assets in the Permian and Eagle Ford.
bp Production Forecast (Company Filings, WSR Estimates)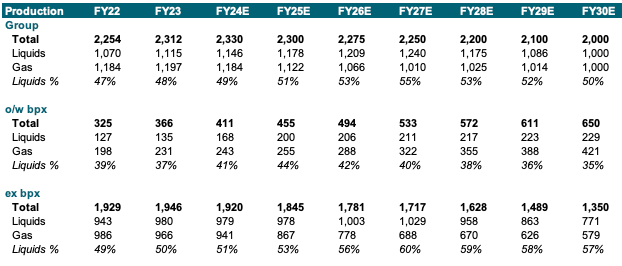
The key risk for BP’s upstream businesses remains its reserve life post-Rosneft, which, at ~8.1 years, is below all of its EU and US peers except for Equinor.
IOCs Proved Reserves (Company Filings)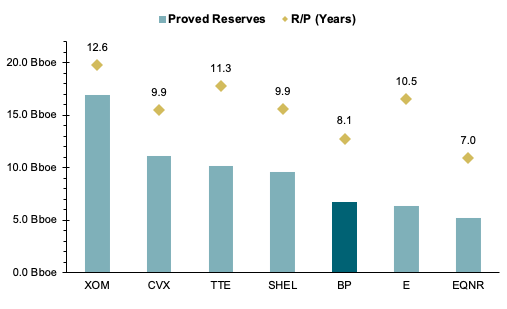
Splitting by liquids and gas reserves, BP enjoys a significantly stronger R/P coverage in liquids at ~9.3 years vs ~7 years in natural gas. While I typically value liquids reserves higher, the low reserve life specifically in gas clashes significantly with BP’s long-term ambition to scale up its LNG business and therefore remains a key item to watch.
IOCs R/P by Hydrocarbon Type (Company Filings)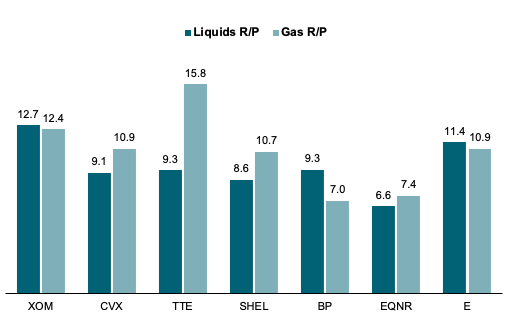
With previous years’ exploration efforts also significantly weaker than its EU peers for an average L3Y reserve replacement ratio (“RRR”) of just ~28% vs 98%, I place a high emphasis on execution in exploration and reserve additions in the first quarters under the new strategy and renewed upstream focus.
One key component of this will likely be BP’s recent discoveries in the Paleogene, a formation in the Gulf of Mexico adjacent to several already operated producing areas, which the firm estimates to hold more than 8Bboe of hydrocarbons (majority liquids) originally in place. While any major production from those fields will likely not occur before 2028, even, estimating a ~40% recovery factor could add a potential 3.5Bboe in high-liquids share reserves towards the end of the decade and help alleviate depth concerns.
After recent payout bump, BP is poised to deliver the highest distribution yield among peers. Based on current shareholder return commitments and at street consensus, I estimate BP to deliver a ~12% total distribution yield (dividends and buybacks) for 24E.
24E Total Shareholder Yield (Company Filings, WSR Estimates)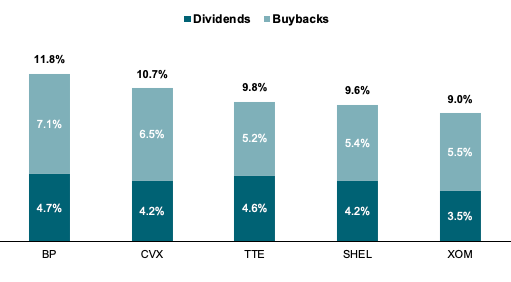
Following the recent rise in committed surplus cash flow (post-div. FCF) payout ratio from 60% to 80%, I now estimate BP to return ~$56B to shareholders over the next 5 years of which $25B in dividends (~4% targeted annual growth) and $31B in buybacks for a total of ~54% of current market cap. On an annualized basis, this implies a total 24E-28E annual yield of ~11% p.a., significantly ahead of US and EU peers with average expected across the group at ~9%.
24E-28E Annualized Total Shareholder Yield (Company Filings, WSR Estimates)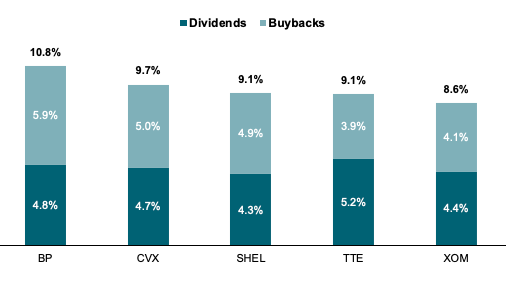
2025 EBITDA target implies current valuation at 2.5-2.7x EBITDA, ~45% below Supermajor peers. As part of bp’s 2023 Investor Update, management confirmed its 2025 EBITDA outlook to be in the range of $46-49B, of which $40-42B from Oil & Gas. Notably, those targets are based on a $70/bbl Brent scenario, which I believe too conservative given the continued strong outlook for crude prices, especially since the November Investor Day.
2025 Planning Framework (bp IR)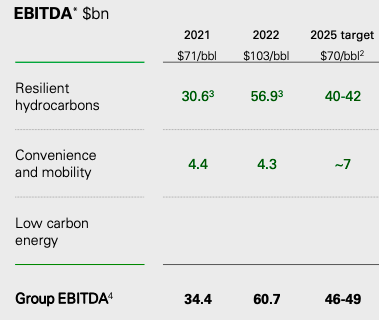
Assuming a 2025 average price of $85/bbl Brent as per the latest EIA Short-Term Energy Outlook and a $340MM uplift in EBITDA per $1/bbl rise in Brent as per BP forward modeling guidance, I estimate around $5.1B in upside potential to ~$51-54B in FY25 EBITDA all else equal. Notably, consensus still projects EBITDA significantly lower at a range from $33-54B, with analyst average at ~$42B. While commodity prices have shown strong volatility recently, I see significant potential for upgrades in the coming quarters, which could serve as key catalysts to rerate the stock.
bp 25E EBITDA (Company Filings, WSR Estimates)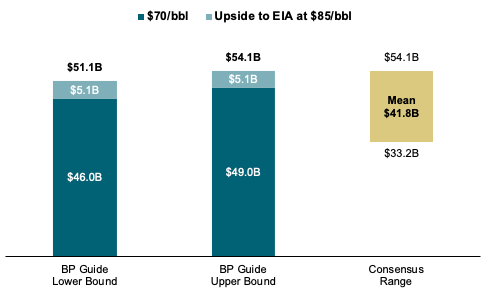
At an estimated 25E EBITDA range of $51-54B and current Enterprise Value of $136B, I find shares trading at just 2.5x-2.7x forward 25E EBITDA, significantly below its Supermajor peers which on average trade at 4.9x for an implied discount of ~45%. Even when considering just the European Supermajors of Shell and TotalEnergies, valuation discount still remains at ~36% with both trading at ~4x 25E EBITDA on current consensus estimates.
Supermajors 25E EV/EBITDA Multiples (Company Filings, WSR Estimates)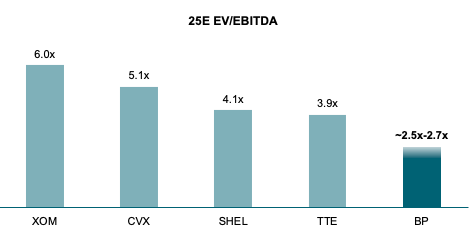
Valuation
On the back of its vertically integrated business model, I value BP on a Sum-of-the-Parts (“SOTP”) basis with separate valuations for its upstream and downstream operations adjusted for non-allocated corporate expenses.
Upstream NAV
To value BP’s upstream business, I will use a NAV approach I recently introduced in my initiation of Chevron (see here) and which I aim to implement across my entire Oil & Gas coverage. Refer to this note for more in-depth and fundamental description of the methodologies and assumptions used.
Key differentiators are a lower assumed decline rate at 8.5% for liquids and 6% for gas, as well as the removal of NGLs as a separate category since European firms do regularly report on those and incorporate them in their liquids category. Since BP does still produce some amount of NGLs (~5-10%) especially in its US onshore operations, I apply a 5% haircut to realized liquids revenues to account for lower selling prices on NGLs. On the back of BP’s FY23 realized gas price of ~$5.6/Kcf I assume a gradual rise towards a long term $8/Kcf which is slightly higher than what I used for Chevron on the back of BP’s higher exposure to European TTF pricing as opposed to US Henry Hub.
Discounting all cash flows at standard 10% cost of capital and applying a 35% tax rate as opposed to the 25% for US O&G, I calculate a total NAV of $137B for BP’s Oil & Gas producing operations.
bp NAV Model (Company Filings, WSR Estimates)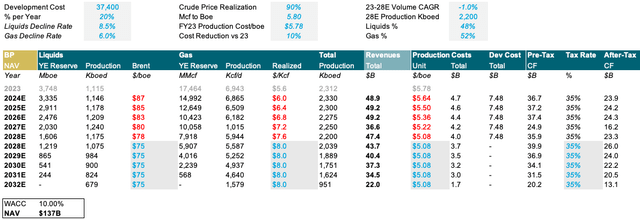
Adding current undeveloped acreage which I estimate to be worth a very conservative $2,000/acre in the US and $1,000/$5000 per acre in other Americas and RoW locations, I obtain a total EV for BP’s upstream business of $164, implying every FY23 flowing barrel to be worth ~$71 and every boe of YE23 reserves to contribute ~$16 in value.
Acreage and implied Upstream Multiples (Company Filings, WSR Estimates)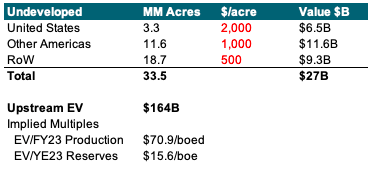
Downstream and SOTP
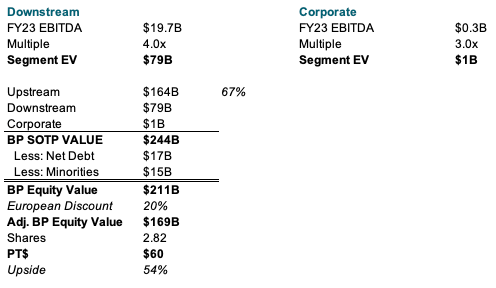
For my valuation of BP’s downstream business I use multiples on FY23 generated EBITDA with my assumption of downstream being the Customers & Products segment as well as 50% of the Gas & Low Carbon segment to account for the division’s LNG, trading and renewables businesses. Valuing the resulting $19.7B in FY23 EBITDA at 4.0x which is below what I use for peers given BP’s lower downstream profitability (1.9% net margin vs IOC average ~3%), I see BP’s downstream business worth as much as $79B.
Further valuing the corporate segment, which in FY23 generated ~$300MM, at BP’s standard 4x EV/EBITDA I calculate a total SOTP value of $244B which adjusted for net debt and minority interests yields an Equity Value of $211B. Given the regulatory and political risks associated with European oil companies as well as the general lower scope of Oil & Gas institutional investment in Europe, I assign a 20% fair value discount for an adjusted Equity Value of $169B or $60 per US ADS (~54% current upside).
bp SOTP (Company Filings, WSR Estimates)