Costco Stock: Should The Magnificent 7 Be Expanded? (NASDAQ:COST)
ablokhin
The Market Loves Costco
Although not mentioned in the same breath as the “Magnificent Seven”, Costco (NASDAQ:COST) deserves to be in their esteemed company based on the outstanding total shareholder returns that it has consistently delivered to long time stockholders:
Author’s compilation using daily pricing data from Yahoo Finance.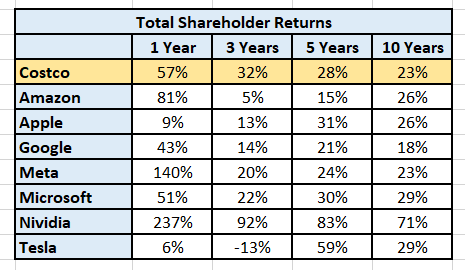
Every year I develop an intrinsic value for Costco. Here is a link to my last valuation Costco: Great Company but Expensive.
Based on the company’s underlying revenue growth and operating margins I found that Costco was significantly over-priced. I am reminded of Benjamin Graham’s classic quote “in the short run, the market is a voting machine, but in the long run it is a weighing machine”.
In the case of Costco, great companies can remain over priced for long periods of time.
The market, particularly since the COVID correction, appears to be driven more by momentum than value. Costco has exceptional momentum and my call to SELL based purely on valuation a year ago was a mistake.
My approach to intrinsic valuation has not changed but my recommendations on how to act on the valuation have changed and now incorporate the near term effects of price momentum.
It’s time to revisit Costco’s fundamentals and see if anything has changed over the last year.
Business Overview
Costco’s value proposition has not changed. It is based on retailing good quality goods and services at competitive prices. It strives to be recognized by its customers as the price leader in its categories.
Costco continues to expand its warehouse numbers both internationally in existing countries and in new countries. Since 2017 the rate of expansion of warehouse numbers is evenly split between the US and the rest of the world and this is reflected in the following chart which shows the net sales by division:
Author’s compilation using data from Costco’s 10-K filings.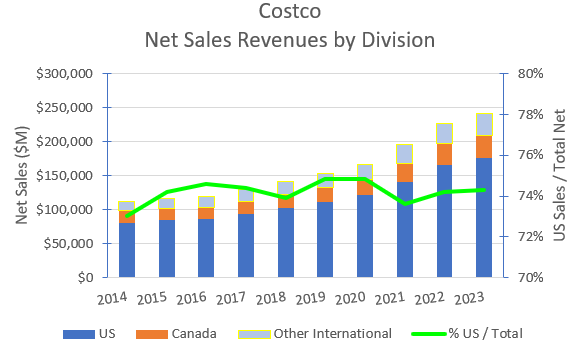
The territory expansion has had no significant missteps or costly asset write-downs. This particularly shows the benefit of expanding organically and not through acquisition.
Costco has been providing an ecommerce offering since April 2001 and its reach is limited to a few countries. Unfortunately, the company does not provide any detailed information about the size of this operation.
Addressable Market
It is difficult to get a single measure of the size of Costco’s addressable market because of its diversified product focus (fresh food, groceries, and general merchandise). These markets are relatively mature.
I have developed a method for estimating the size of a market by using a company screening tool. This tool enables me to select a market sector and generate a complete list of all the public companies in those sectors by country headquartered location (and download all their financial data).
Although Costco is categorized as being in the Discount Stores sector, I have elected to combine this sector with the Grocery sector to get a larger list of global companies to compare.
These 2 sectors are characterized as having a large tail of relatively small companies (many of which are private) competing against some very large companies. To make the data easier to manage I eliminated public companies with annual turnover less than $US 100M.
The screen identified 95 companies that met these criteria.
The FY2023 sales turnover for this group was $US 2,320M. In terms of sales turnover Costco was 2nd largest with Walmart (WMT) being the largest.
It is noted that e-commerce companies such as Amazon (AMZN) were not included in this analysis as they are classified as Internet Retailers. This means that my estimate for the size of the addressable market will be significantly lower than many published estimates, but it does allow me to compare the relative performance of companies within my sample group.
The following chart shows an estimate of the sector’s revenues for the last 10 years and the year-on-year growth rate:
Author’s compilation using data from GuruFocus.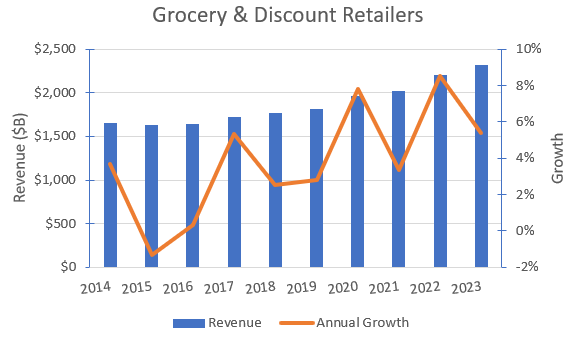
The sector’s compound annual growth rate over the last 10 years has been slightly lower than 4% (confirming the sector’s maturity) whilst Costco has been growing closer to 9% per year.
Clearly Costco’s model has enabled it to gain significant market share over the last few years.
Costco’s Strategy
Costco’s strategy has been in place for many years with very little change to the focus on a limited range of high-volume turnover goods with the aim to be the market price leader for these items. The narrow range of goods allows for a streamlined inventory management system and the high volumes provides Costco with leverage over its suppliers.
A unique aspect of Costco’s strategy is the requirement for customers to be members which provides a cost-free source of revenues generated by membership subscriptions.
Costco’s strategy has provided for the significant expansion in warehouse numbers (particularly internationally) and for incremental additions to its product offering.
The success of the strategy to date can be observed through the following chart which shows the historical growth rate in Net Sales and Membership Revenues:
Author’s compilation using data from Costco’s 10-K filings.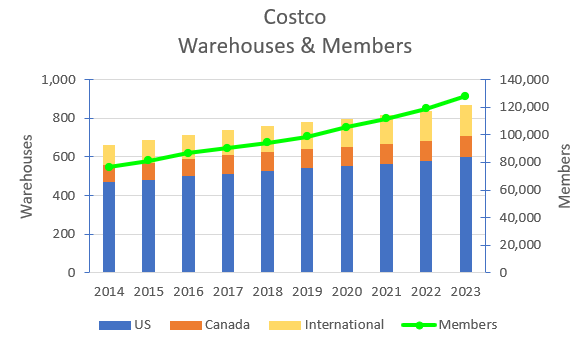
Over the last 10 years warehouse numbers have been growing at 3.2% per year whilst membership numbers have been growing at 6% per year. This indicates that Costco is growing by building new warehouses and by attracting more customers to existing warehouses.
Costco’s Historical Financial Performance
Revenues and Operating Margins
Costco’s consolidated historical revenues and operating margins are shown in the chart below:
Author’s compilation using data from Costco’s 10-K filings.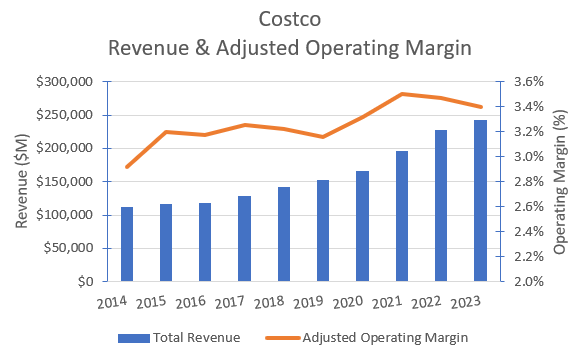
It should be noted that I have adjusted Costco’s reported Operating Income by converting operating leases to debt and removing the impact of pre-opening expenses (I have capitalized them).
The key takeaway from this chart (besides the impressive year on year revenue growth) is the steady increase in operating margins, particularly post-COVID.
Costco’s operating margins are significantly lower than my estimate of the sector’s median margin of 4.4%. In fact, Costco’s margins are closer to the sector’s lowest 25th percentile than the median.
The proof that Costco is true to its core promise of being the price leader in each category is reflected in its reported gross margin. Costco’s gross margin has been declining for several years as shown in the following chart:
Author’s compilation using data from Costco’s 10-K filings.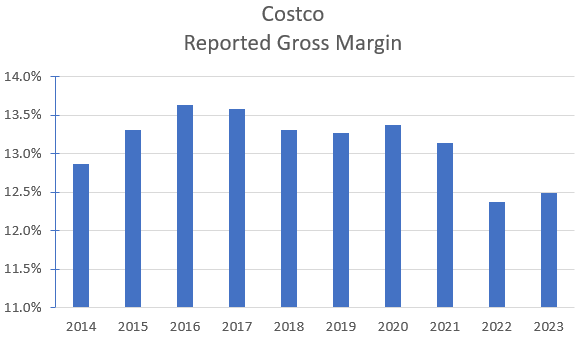
I estimate that the sector’s median gross margin is currently 26.8% and that Costco is in the sector’s lowest decile of gross margins.
Over the last 2 years Costco’s gross margin has taken a significant step lower. I previously thought that this was a function of higher supply chain costs being absorbed by Costco, but I no longer hold this view. This appears to have been a strategic decision to lower prices to promote higher revenue growth.
Cash Flows
The following table summarizes Costco’s cash flows for the last 10 years:
Author’s compilation using data from Costco’s 10-K filings.
Over the last 10 years Costco has generated $35,417 M of free cash following reinvestment. It has relatively modest reinvestment needs of about 2 cents in every dollar of sales. It is a very modest user of debt (which is unusual for a retailer) with debt only increasing by $1,701 M.
Over this period Costco has generated $33,742 M for potential redistribution back to shareholders. It prefers dividends over stock buybacks with $20,010 M being paid out in dividends and $4,152 M used for buybacks. The remaining cash has been retained in short-term investments.
Costco has increased its dividend every year since FY2004, and I see no reason why this won’t continue. Usually, a special dividend is paid every 2 years to drain the company’s excess cash reserves. Earlier this year shareholders were paid a special dividend of $15 per share (in FY2021 the amount was $10).
Very few large companies return such a high proportion of their free cash flow back in dividends (it is thought to rob the company of flexibility because if the company at some time in the future lowers its dividend rate it is seen as a bad financial signal to the market).
Capital Structure
The following chart shows the history of Costco’s capital structure over the last 10 years:
Author’s compilation using data from Costco’s 10-K filings.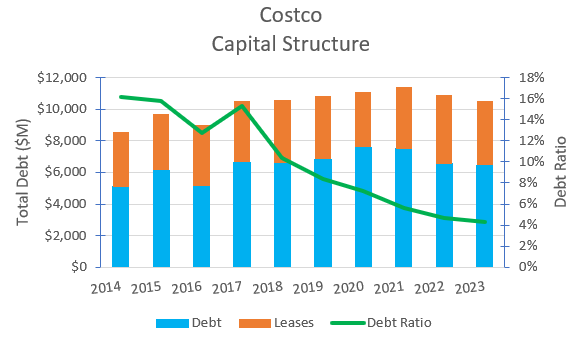
Costco manages its capital structure extremely conservatively. The sector’s median debt ratio is 28% and Costco is in the sector’s lowest decile.
I can’t explain the rationale behind management’s thinking, but I can identify that this approach results in a higher cost of capital. A high debt ratio could potentially release a one-off amount of additional cash which could be used to fund share buybacks.
Interestingly Costco’s management is undergoing a generational change. Long time CEO, Craig Jelinek retired earlier this year after 29 years in the role and the CFO, Richard Galanti, is also retiring after 31 years in the role.
Will the next generation of executives share the same conservative values as those in the past?
Return on Invested Capital
The following chart shows the history of Costco’s return on invested capital over the last 10 years:
Author’s compilation using data from Costco’s 10-K filings.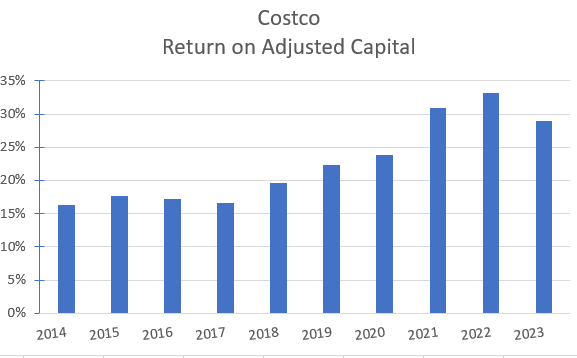
This chart confirms that Costco is potentially the world’s most capital efficient retailer. I estimate that Costco’s ROIC is in the sector’s highest decile where a typical retailer in this sector has an ROIC of 11%.
My Investment Thesis for Costco
At this time of writing this report Costco has released its FY2024 2nd quarter financial statements and current trailing 12-month (TTM) revenues are $248,828 M (6.2% higher than the prior year) and the TTM operating margin is 14.6%.
The current consensus revenue forecast for FY2024 is $254,050 M and it is projected that the FY2025 revenues will be $272,260 M. This equates to a 6% growth per year.
My scenario for Costco is:
Growth Story
The sector is mature and my estimate for mature economic growth is 4.3% per year. Costco has been growing revenues at 9% per year for the last 10 years but more recently the TTM growth rate is closer to 6% (in line with the consensus forecasts).
At the divisional level I think that maintaining a high US and Canadian growth rate will become more difficult over time simply due to the law of large numbers, but Costco’s low pricing policy will enable market share growth to continue over the medium term. International markets offers the biggest opportunities over the long-term due to Costco’s lower market share in these countries.
I am forecasting the following divisional revenue growth rates for the next 5 years:
- US : 7% per year.
- Canada : 5% per year.
- International : 10% per year.
Margin Story
Costco’s low margins are an outcome of its value proposition. I don’t expect that this will change much in the future and as a result I am forecasting that long-term operating margins will be around 3.4%.
Growth Efficiency
Costco’s reinvestment back into its business is relatively frugal compared to its competitors. I measure capital efficiency as revenues divided by invested capital. Costco’s historical ratio has been rising over the last few years and at the end of FY2024 Q2 was 12.5 (every one dollar of investment generates $12.50 in revenues). The global sector’s median ratio is currently 3.1 (Costco generates 4 times more revenue per dollar of investment).
For my scenario I have tapered Costco’s growth efficiency to the sector’s 90th percentile as I suspect international capital investments will be more expensive, but it is still significantly more efficient than its competitors.
Risk Story
My scenario for Costco is very bullish. Costco is not immune to the global economic cycle and revenues will probably stagnate or even decline temporarily if the economy were to enter a recession.
Costco’s balance sheet is significantly stronger than its competitors and has much lower leverage. I estimate that Costco’s current cost of capital is 7.3% relative to the median cost of capital for all listed US companies of 8.3%.
Over the long term I have forecast that Costco’s cost of capital will stay reasonably constant reflecting the low risks associated with their strategy.
Competitive Advantages
Costco’s operating model is significantly different to its competitors and is characterized by high revenue growth, low operating margins and high returns on invested capital.
There is strong evidence to suggest that Costco has a sustainable competitive advantage which would allow its terminal ROIC to remain above its cost of capital at around 15%.
Valuation Assumptions
The following table summarizes the key inputs into the valuation:
Author’s valuation model inputs.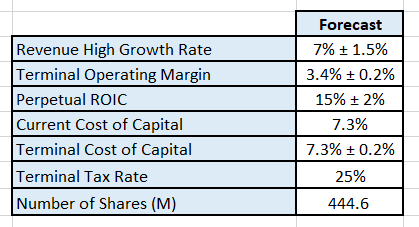
The current and terminal cost of capital estimates are based on a Capital Asset Pricing Model approach using the current 10 year US Treasury yield as the estimate for the terminal growth rate.
Discounted Cash Flow Output
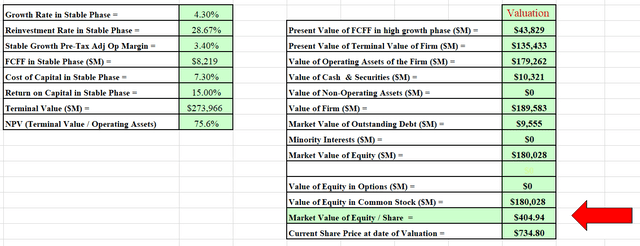
The output from the DCF is in $USD:
Author’s valuation model output. Author’s valuation model output.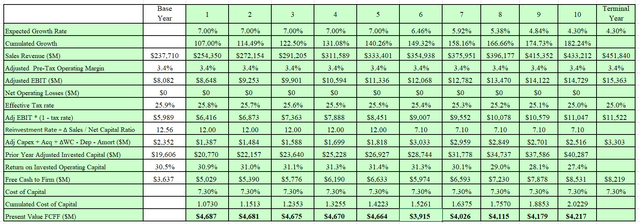
I also developed a Monte Carlo simulation for the valuation based on the range of inputs for the valuation. The output of the simulation was developed from 100,000 iterations:
Author’s Monte Carlo valuation simulation output.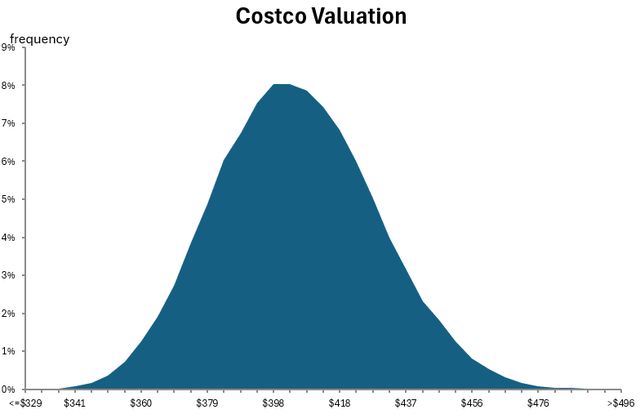
The simulation can help identify the major sources of input sensitivity in the valuation. In this scenario, the valuation is particularly sensitive to changes in the cost of capital and the expected revenue growth.
The simulation indicates that at a discount rate of 7.3%, Costco’s current intrinsic value is between $328 and $497 per share with an expected value of $405.
Based on my scenario, Costco appears to be currently priced significantly above its intrinsic value.
How is Costco currently priced relative to other traditional retailers?
The following table shows the relative pricing metrics for Costco, its major competitors and the sector median:
Author’s compilation using data from Yahoo Finance.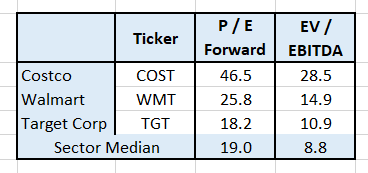
The data indicates that Costco’s relative market pricing is significantly different to the ratios which are typical for this sector.
This may not be surprising given that Costco’s total shareholder returns are more closely aligned with the “Magnificent 7” (as previously shown). So it also would not be surprising that Costco’s relative market pricing multiples do not look out of place in this group:
Author’s compilation using data from Yahoo Finance.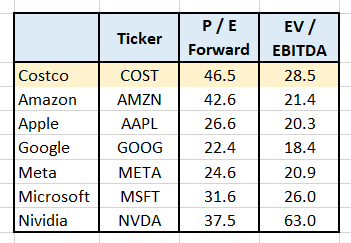
The table highlights that Costco’s relative market pricing is comparable to the highest levels of the “Magnificent 7”.
Perhaps the Magnificent 7 should be renamed the Magnificent 8.
Recommendation
The report has highlighted Costco’s exceptional financial metrics relative to its peers and how it has richly rewarded both recent and long-term shareholders.
If my valuation is correct there may come a time when the share price takes a significant tumble for the price to converge on the valuation or alternatively the price will move sideways for a long period of time which would allow the valuation to “catch up”.
Does Costco really fit in to the same group as the Magnificent 7?
Costco is fundamentally a narrow focused bricks and mortar retailer. As a result of its strategic positioning and value proposition it is able to grow revenues at almost double the rate of its underlying mature market.
Costco operates in a market which generates high volumes, low margins and low reinvestment requirements. Its market is very fragmented and mature.
The Magnificent 7 operate in markets which have low / moderate volumes, high margins and high reinvestment requirements. The markets have relatively few competitors, are very concentrated with generally high expected growth rates (except for Apple).
This leads me to conclude that Costco doesn’t have the same characteristics as the Magnificent 7 and potentially doesn’t deserve the high relative pricing multiples that the market currently applies to the stock.
What could cause the share price to significantly decline?
Costco’s share price is subject to general market volatility. For instance, the price dropped 34% between 7th April 2022 and 20th May 2022 (the price fell from $612 to $407). Over this same period the SPY only fell 13%.
There are also risks specific to Costco. The company has recently undergone a generational change in leadership. Time will tell whether this has been well handled and that the new leadership shares the core values and execution experience of the prior leadership group.
What should existing shareholders do?
The current price action for the Costco remains reasonably bullish but at some point the rising price momentum trend will break down (gravity inevitably influences all stocks even if only for a short period of time).
For that reason I am not recommending that any stock should be sold immediately.
As a result of the exceptional performance of the stock there is a possibility that long-term holders of Costco stock may be very overweight within their portfolio.
I recommend that holders:
- Ensure that their Costco allocation is appropriately weighted within their portfolio.
- Make the required adjustments (sell stock) to bring the holding back to your maximum target allocation if necessary.
- Do not add to your holdings at these prices.
- In the meantime, HOLD on to your stock and enjoy the ride while it lasts.
- Once the current trend breaks I would be aggressively selling as the stock’s price may rapidly fall back towards its intrinsic value.


