dYdX Price Prediction for Today, December 3, 2023 – DYDX Technical Analysis

join us telegram A channel to stay up to date on breaking news coverage
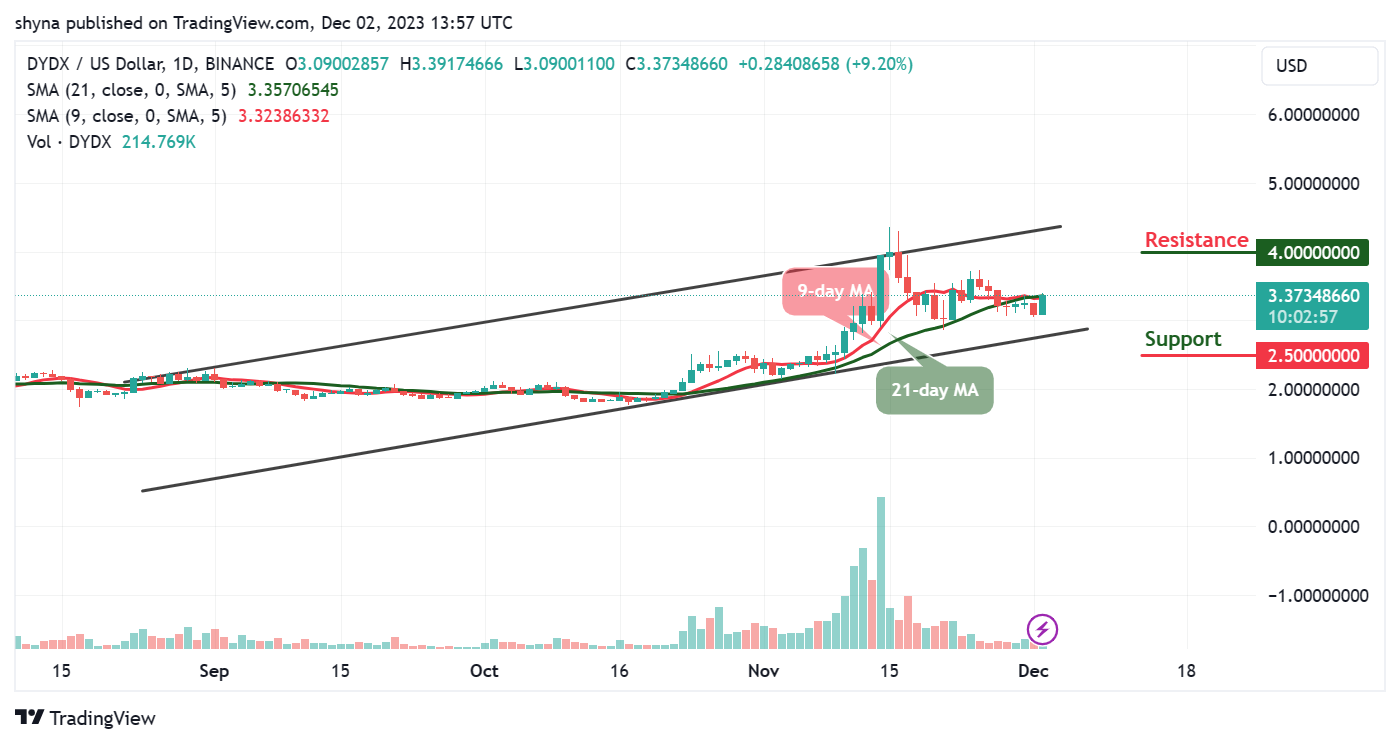
The dYdX price prediction shows that DYDX is poised for an uptrend as it trades near $3.40 resistance today.
dYdX predicted statistical data:
- Current dYdX price – $3.37
- dYdX market cap – $629.5 million
- dYdX circulating supply – 183.7 million
- dYdX total supply – 1 billion
- dYdX CoinMarketCap Ranking – #79
DYDX/USD Market
Main level:
Resistance levels: $4.00, $4.20, $4.40
Support levels: $2.50, $2.30, $2.10


DYDX/USD is likely to break above the $3.50 resistance level to increase the bullish move. Meanwhile, if the market price trades near the upper boundary of the channel, the cryptocurrency may see strength again above the $3.40 level. As a result, additional upside reversals are needed for the coin to move higher. Nonetheless, DYDX/USD needs to break the $3.50 level before reaching the $3.80 resistance level.
dYdX Price Prediction: dYdX (DYDX) Could Gain More Upside
Looking at the daily chart, dYdX price is currently above the 9-day moving average and the 21-day moving average. If buyers continue to hold higher levels, the first resistance level could be located at $3.40, followed by $3.50. However, additional resistance levels can also be seen at $4.00, $4.20, and $4.40, respectively. On the other hand, if DYdX price heads towards the channel, it may reach the first support level at $3.00.
However, further bearish moves could lead the coin to important support levels of $2.50, $2.30, and $2.10. The 9-day MA may need to break above the 21-day MA, which could mean buyers may start to dominate the market, which could also mean that DYDX/USD could soon push towards the resistance level of $3.50.
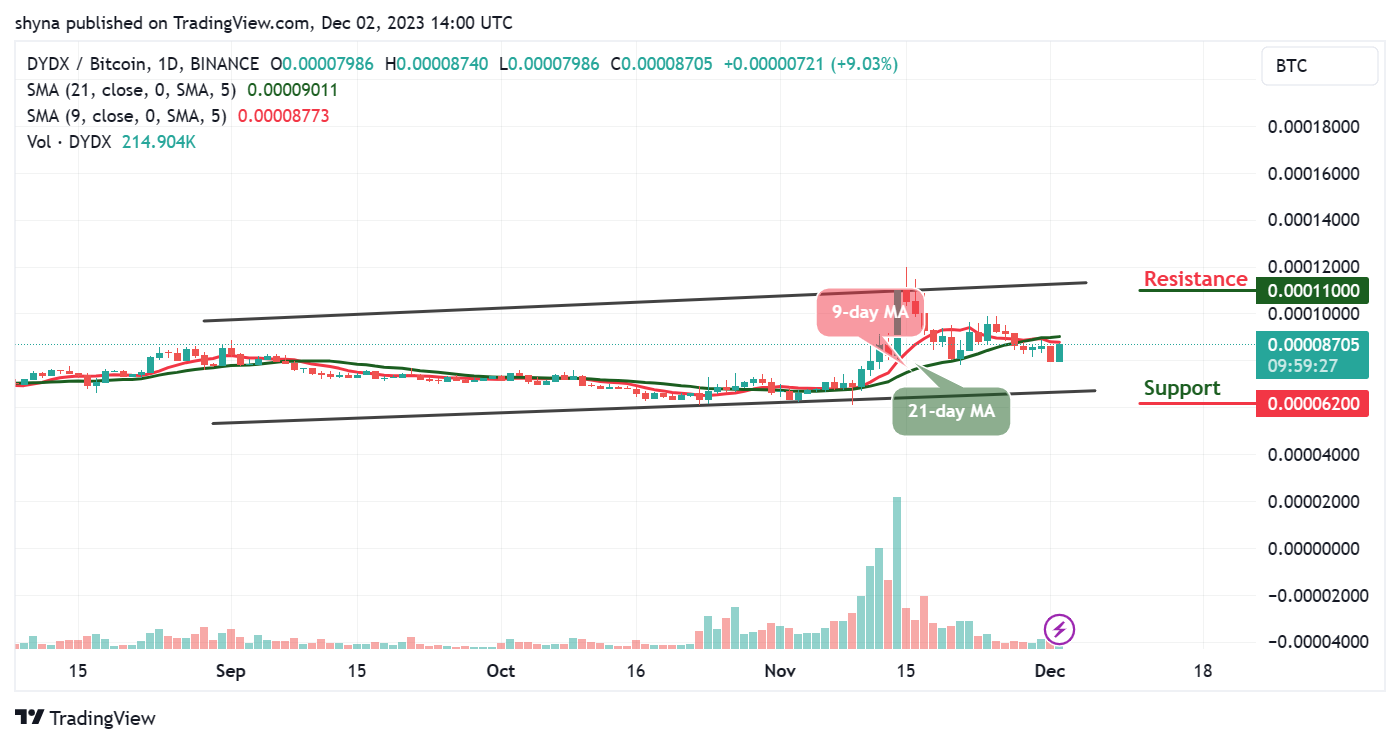
DYDX/BTC May Continue Sideways Movement
For Bitcoin, the daily chart shows dYdX price attempting to break above the 9-day and 21-day moving averages. If the price stabilizes above this barrier, there is potential for further profits. So, the next resistance level is close to the 1000 SAT level. If the price continues to rise, it may break above 1100 SAT.


However, if the bears regroup and slide below the lower boundary of the channel, support at 6500 SAT may appear before rolling into significant support below 6200 SAT. Meanwhile, the 9-day moving average remains below the 21-day moving average, suggesting bearish movement within the channel.
Alternatives to dYdX
According to the daily chart, if the buying trend increases, the dYdX price is expected to exceed the 9-day moving average line and the 21-day moving average line. Currently trading at $3.37, the bullish momentum suggests a continued upward trend. Traders can expect the coin to reach the upper channel boundary targeting the nearest resistance level of $3.40. Meanwhile, traders should keep an eye out for potential upside developments in the dYdX market.
In a surprising turn of events, Bitcoin Minetrix has emerged as a leader in the cryptocurrency space thanks to its unique cloud mining solution and highly successful pre-sale. While dYdX (DYDX) is on an upward trajectory, all eyes are now fixed on Bitcoin Minetrix, which is speculating that it will soon make a mark in the cryptocurrency space. Notably, this token surpassed all predictions, raising an impressive $4.6 million during the pre-sale phase.
A new cryptocurrency mining platform – Bitcoin Minetrix
- Thanks to Coinsult
- Decentralized, secure cloud mining
- Get free Bitcoin every day
- Native token currently in pre-sale – BTCMTX
- Staking Rewards – APY 100% or more
join us telegram A channel to stay up to date on breaking news coverage


