Ethereum Evening Star Could Mean Lights Out on Bull Run

Over the past few weeks, Ethereum has finally started to gain some strength against Bitcoin and other top-performing cryptocurrencies. But over the past few weeks, the upside has almost completely disappeared.
The price action of rising and then immediately falling formed a potential bearish Japanese candlestick reversal signal. Will ETHUSD continue to decline, or will it begin an upward trend again? We will explore technical signals to watch for.
Ethereum ETHUSD reversal signal possible
Bitcoin and Ethereum, the top two cryptocurrencies by market capitalization, have seen unusual differences between the two assets in terms of price action. Ethereum bottomed in early 2022, but Bitcoin found its bottom in late November of the same year. However, in 2023, BTC significantly outperformed ETH.
This all started to change recently, as spot BTC ETF news began to cool off and ETH ETF rumors began to swirl. Among other things, the post-approval selling of BTC caused Bitcoin and Ethereum to correct by more than 20%. However, the price action of ETHUSD formed an evening star candlestick pattern.
In Japanese candlestick analysis, the Evening Star pattern is a bearish reversal pattern with enough potential to turn a bull market into a bear market.
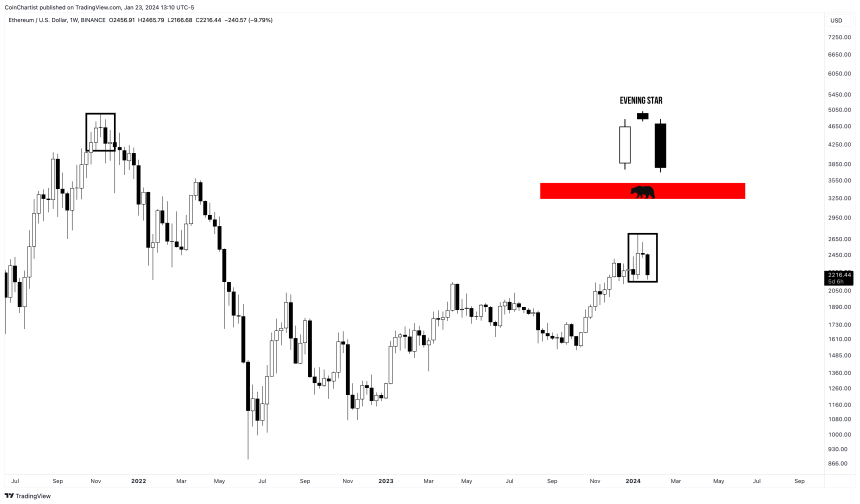
Is this an evening star pattern? | ETHUSD on TradingView.com
All About Evening Star Patterns
The Evening Star is a three-candlestick pattern consisting of a large white candle, a doji, and a large black candle that extinguishes at least 50% of the first white candle. The more white candles engulf, the stronger the Evening Star signal can potentially be.
Patterns help reveal underlying market sentiment. Large white candles show the bulls’ increased enthusiasm and strength in the face of resistance and confusion. Eventually the selling begins, the bears regain control and show surprising strength against the bulls.
In Japanese candlestick patterns, context is important. Reversal signals and bearish technical indicators occurring at the peak of a rally can be given more meaning. The same signals were seen at the peak of the 2021 bull market, when it began an 82% decline.
Candlestick patterns are only confirmed after the weekly close. Additionally, a weak follow-up was needed, pushing ETHUSD to 2024 lows. This signal could be nullified if the bulls take a stand and are able to take back more than 50% of the candle.
Disclaimer: This article is provided for educational purposes only. This does not represent NewsBTC’s opinion on whether to buy, sell or hold any investment, and of course investing carries risks. We recommend that you do your own research before making any investment decisions. Your use of the information provided on this website is entirely at your own risk.


