Gains held after RBA near 1.0725-30 area and lack of follow-through.

- AUD/NZD is showing a slight decline after the RBA announced its policy decision this Thursday.
- Expectations that the RBA’s tightening cycle is over will inhibit further gains for the cross.
- The technical setup favors bearish traders and supports the outlook for higher near-term losses.
The AUD/NZD cross rose more than 30 pips from its Asian session low around 1.0700 after the Reserve Bank of Australia (RBA) announced a policy decision and reversed much of the previous day’s losses. The spot price is currently trading in the 1.0730 area, up only 0.20% for the day, but still within a familiar range it has maintained for the past four days.
The Australian dollar (AUD) strengthened broadly after the RBA decided to leave the official cash rate unchanged and maintain its hawkish stance, saying the board needed assurances that inflation was continuing to move towards its target range. In an accompanying policy statement, the central bank noted that inflation continued to ease in the December quarter but remained high at 4.1%. The RBA added that service price inflation has declined at a gradual pace and remains rising.
The RBA also published updated economic forecasts for 2024 and 2025, which showed slightly downward revisions to expectations for GDP and consumer inflation. The central bank now expects the economy to grow by 1.8% in 2024 and CPI to grow by 3.2%, compared to earlier projections of 2.0% and 3.5%. The favorable inflation outlook suggested the RBA’s tightening cycle was over and its next step would be downwards. This acts as a headwind for Australia and inhibits further upside in the AUD/NZD cross.
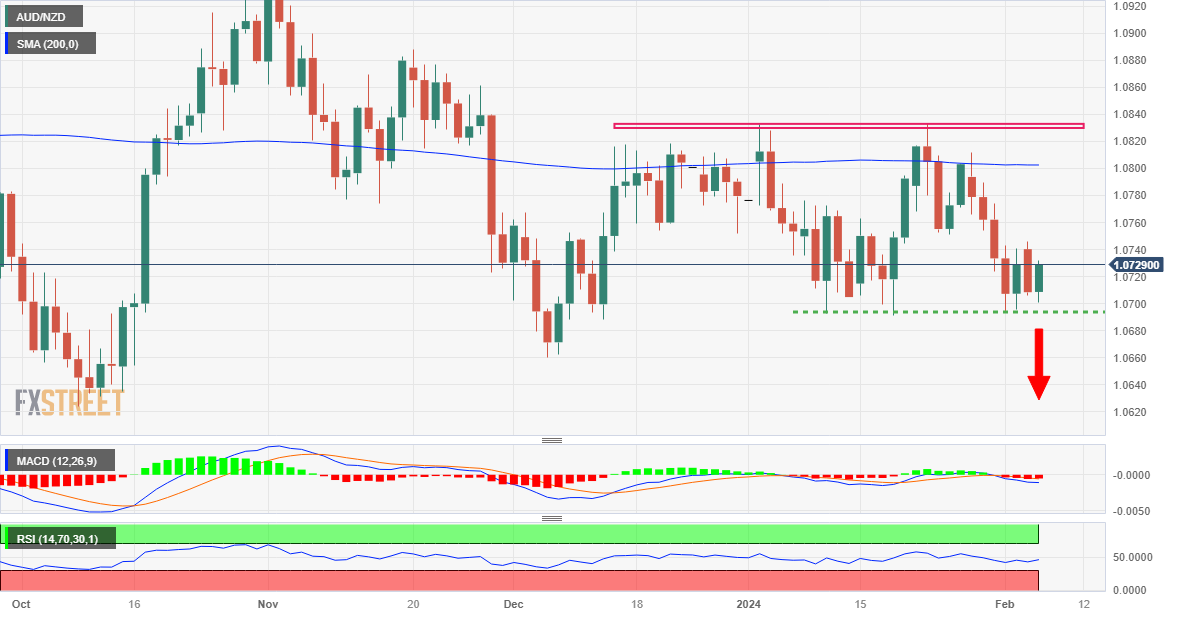
From a technical perspective, the recent decline in the 1.0830-1.0835 area indicates the formation of a bearish double top pattern on the daily chart. Moreover, repeated failure to find acceptance above the 200-day simple moving average (SMA) makes it a favorite for bearish traders. This, combined with the fact that the oscillators on the daily chart are just starting to drift into negative territory, suggests that the path of least resistance for the AUD/NZD crossover is to the downside. Therefore, any further upside is likely to be sold off.
That said, it would still be prudent to wait for a sustained decline below the 1.0700 line before expecting further downside. The AUD/NZD cross could then accelerate its slide towards the December 2023 swing low around 1.0660-1.0650 before falling towards the 1.0625 area and the 1.0600 roundoff figure.
On the other hand, the 1.0740-1.075 area, i.e. the upper end of the multi-day trading range, may continue to act as an immediate obstacle. However, continued strength could trigger a short-term rally and allow the AUD/NZD cross to reclaim the 1.0800 point, which is currently in line with the 200-day SMA. This is followed by the 1.0830-1.0835 supply zone. A decisive clearing of this zone could shift the bias in favor of bullish traders and pave the way for meaningful upside in the near term.
AUD/NZD daily chart
Skill level to watch
Source: https://www.fxstreet.com/news/aud-nzd-price-analytic-sticks-to-post-rba-gains-near-10725-30-area-lacks-follow-through-202402060526