Global Gold Analyticals November 2, 2024 – Analysis and Forecasts – February 11, 2024

Weekly Technical and Fundamental Analysis of Gold – February 11
Looking at the weekly time frame for gold, it is clear that global gold ounces did not make much progress last week, ending the week with a loss of around 0.75%.
With the lack of momentum in foreign exchange markets last week, all eyes are now on the important US inflation report due out next week.
The US Consumer Price Index (CPI) report is the main driver for gold this week.
Events in the gold market last week:
On Sunday, Federal Reserve Chairman Jerome Powell reiterated in a television interview with 60 Minutes CBS that a rate cut at the March Fed meeting is very premature and that he is not yet confident about it.
However, Chairman Powell emphasized that interest rates could begin to be lowered if the weakening labor market or inflation is deemed compelling enough.
U.S. 10-year Treasury yields strengthened more than 3% on Monday on the back of last week’s strong U.S. jobs report, while gold prices closed near the $2020 level.
Meanwhile, Qatar, which is acting as a mediator in the Middle East conflict, announced late Tuesday that Hamas had responded “generally positively” to a proposed ceasefire with Israel.

But the positive news did not ease concerns about a deepening crisis in the Middle East, as an Israeli official told Channel 13 that some of Hamas’ demands were completely unacceptable as a counteroffer.
An interesting event occurred, with global gold falling again as the 10-year US Treasury yield rose above 4.1%. The reason for this increase was the sale of 10-year Treasury bonds at a U.S. Treasury auction with a yield of 4.09%.
On Thursday, markets awaited the U.S. Department of Labor’s first weekly jobless claims report.
The U.S. Department of Labor reported Thursday that 218,000 initial unemployment claims were filed for the week ending February 3, compared with 227,000 the previous week (remember that lower numbers strengthen the dollar and lead to lower gold) do it).
Since this press release, the US dollar has remained strong compared to its peers and global gold has faced challenges.
Meanwhile, Richmond Federal Reserve President Thomas Barkin told Bloomberg that there is plenty of time to be patient with interest rate changes and that he and his colleagues should see inflation decline significantly.
Finally, on Friday the U.S. Bureau of Labor Statistics (BLS) announced that it had revised its monthly forecast for December consumer price index (CPI) growth from 0.3% to 0.2%.
The department announced that it expects the core CPI to be released at a rate of 0.3%, the same as the previous figure.
In the end, global gold ended the trading week by falling to the $2020 level as the 10-year government bond yield rose again.
What’s happening next week in the Forex and Gold markets:
On Tuesday, the US Labor Department is scheduled to release an important US inflation report.
If this number drops to zero for any reason, market traders will start speculating that the Fed’s rate-cutting process will start early, surprising the markets.
If this scenario becomes a reality, the yield on US 10-year Treasury bonds will fall below 4%, causing global gold prices to rise.
There is an 82.5% chance the Fed will keep rates unchanged at its March meeting, according to CME Group’s interest rate forecasting tool.
Current market conditions also suggest that there may not be enough room for the US dollar to rise further if inflation is higher than expected.
However, if inflation exceeds expectations, Treasury yields will rise, causing the price of gold to fall significantly.
Additionally, the United States is scheduled to release its important January retail sales report on Thursday. Because these data are not adjusted for price changes, they are unlikely to attract significant market attention.
Instead, traders can focus on developing their skills in gold for short-term trading opportunities.
Weekly technical analysis of gold:
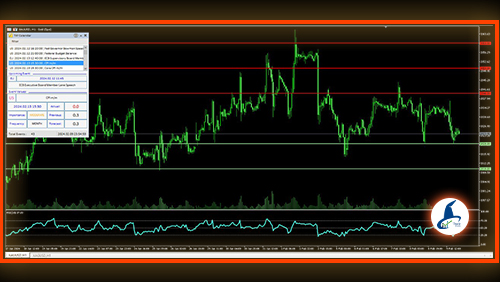
Last week, the lower and upper bounds for gold prices were 2014 and 2044, respectively. If we now open a daily gold chart and plot the RSI indicator, we can see that the high point of the indicator is pointing downwards and showing a value of 47.
This means that control is currently in the hands of market bears, remember that the upward trend in global gold on daily time frames remains intact and the price is currently hovering above the 50-day moving average.
From a technical perspective, this 50-day moving average has acted as a support for global gold for several months, providing excellent support.

Key support levels in global gold analysis:
If gold falls, the first important support level will be the important area of $2020. If gold falls below this area, the next major price level is $2010. If market weakness pushes gold lower, the next important level would be $2000.
Key resistance levels in global gold analysis:
If gold prices rise, the first important resistance level will be $2030. If gold successfully breaks through this area, the next major level is $2040. If market strength pushes gold higher, the next resistance levels would be $2050 and $2060.
disclaimer: This article is for informational purposes only and should not be considered financial advice. Please consult a qualified financial advisor before making any investment decisions.
May Pip be in your favor!


