Here’s what ETH implied volatility tells us:

The cryptocurrency market has recently seen a stark difference in the behavior of two major assets: Bitcoin and Ethereum. While Bitcoin appears to be entering a phase of relative stability, Ethereum’s journey presents a contrasting picture of continued uncertainty, especially in the options markets.
This difference is highlighted by the continued high levels of implied volatility associated with Ethereum options, signaling a cautious outlook among investors regarding future price movements.
Ethereum Sustained Volatility: Comparative Analysis
Implied Volatility (IV) serves as an important indicator in the options market and provides insight into the expected price movement of an asset over a specific period of time. It measures the strength of potential price movements that traders expect, reflecting market temperature.
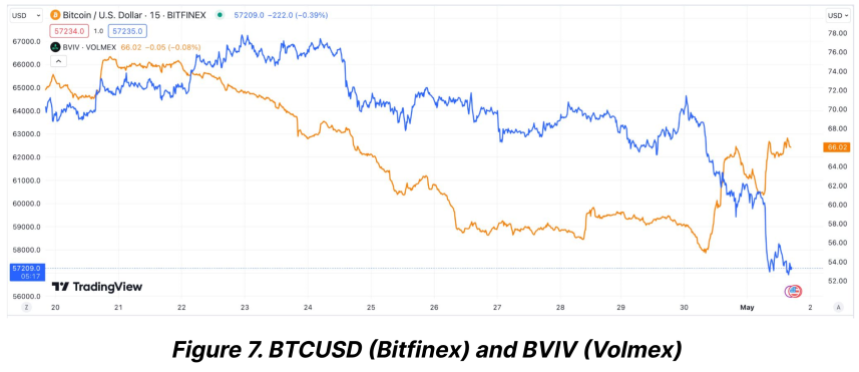
A recent analysis found that while Bitcoin’s implied volatility stabilized significantly after the halving, Ethereum did not follow suit. While Bitcoin’s IV has fallen to multi-month lows, indicating a calming of the market, Ethereum’s IV remains high.
Unlike the calming waves of the Bitcoin market, Ethereum is struggling with heightened volatility. According to data from the Bitfinex Alpha Report, Bitcoin’s volatility index decreased sharply from 72% at the time of the recent halving to around 55%.
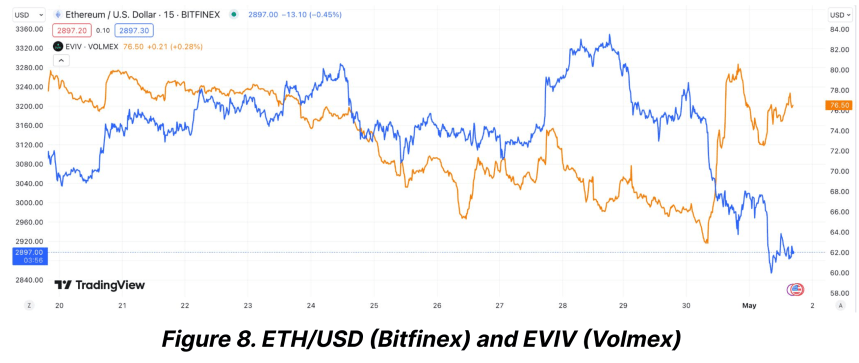
On the other hand, Ethereum’s volatility index decreased slightly from 76% to 65% over the same period. This continued volatility in the Ethereum market is primarily caused by uncertainty surrounding important upcoming regulatory decisions and their broader market implications.
The Ethereum market is particularly nervous in anticipation of the U.S. Securities and Exchange Commission’s (SEC) impending decision on two spot Ethereum ETFs, scheduled for late May 2024.
Upcoming regulatory milestones are considered significant events that could spur major market movements or worsen current volatility.
The Bitfinex Alpha report highlights that regulatory uncertainty is a key driver of the less significant decline in Ethereum’s Volatility Risk Premium (VRP) compared to Bitcoin.
ETH and BTC show signs of recovery amid volatility
Ethereum and Bitcoin showed signs of recovery in terms of trading performance last week. Bitcoin rose 4.1%, while Ethereum reported a slight increase of 2.4%.
However, over the past 24 hours, Ethereum has seen a slight decline of 0.7%, highlighting continued volatility and investor caution.
Moreover, Ethereum’s network dynamics reflect suppressed activity, with a significant decrease in ETH burn rate due to lower transaction fees.
These technical aspects further complement the cautious Ethereum market narrative, with potentially significant changes likely to occur following external regulatory action.
Despite all this, analysts like Ashcrypto propose The current volatility could set the stage for a strong rebound in the third quarter of this year. Based on historical patterns, speculative predictions for Ethereum could potentially reach the $4,000 mark if market conditions align favorably.
Featured image by Unsplash, chart by TradingView
Disclaimer: This article is provided for educational purposes only. This does not represent NewsBTC’s opinion on whether to buy, sell or hold any investment, and of course investing carries risks. We recommend that you do your own research before making any investment decisions. Your use of the information provided on this website is entirely at your own risk.

 fell to ,000, leading to a liquidation of 0 million.")

