Here’s why trading expert John Bollinger warns against buying Litecoin.

In a recent analysis, legendary trader John Bollinger expressed concern about Litecoin’s performance, especially compared to Bitcoin. Bollinger, known for developing the popular technical analysis tool Bollinger Bands, highlighted a worrying pattern in the Litecoin market.
that Advert, “I was asked to do an analysis on LTCBTC. My biggest concern is its underperformance compared to Bitcoin. From a price perspective, the feature that controls LTCUSD is a 2-bar reversal below the lower Bollinger Band, which is generally viewed by traders as a bearish signal.”

Bollinger’s Bearish Litecoin Prediction Explained
November 28, 2023 LTC/USD pair chart provided by Bollinger shows Litecoin’s price movement relative to Bollinger Bands on a daily and weekly basis. The price is currently hovering around $69.566, significantly below the upper Bollinger Band, suggesting a lack of bullish momentum.
Bands are usually formed by marking a range of standard deviations above and below a simple moving average that encompasses the price movement. The daily and weekly candlestick charts on this chart show that LTC/USD price is struggling below the midpoint of this band, indicating weakness. The current price near $69.566 is well below the upper band level around $90, which represents a potential resistance level.
The Bollinger Bands (BB) on the chart are set to a 20-day moving average with a range of 2 standard deviations. Bollinger’s analysis points to a ‘two-bar reversal’ pattern in the lower band. This pattern occurs when a bar reaches a high higher than the previous bar and then closes below the close of the same previous bar, suggesting a possible reversal in an uptrend. This pattern occurred near the lower band, indicating that efforts to push the price higher are meeting resistance and general selling pressure is maintaining.
The Bollinger %B indicator is also important here as it compares the price of Litecoin to the range defined by Bollinger Bands. A %B value below 0.5 means that Litecoin’s price is closer to the lower band than the upper band, potentially indicating weakness. The chart shows the indicator plummeting towards 0 and then failing to break above the 0.5 level, indicating that the price frequently touches or falls below the lower band.
LTC Price Under Pressure
Bollinger Band Width (BBW) serves as another indicator to measure volatility by evaluating the Bollinger Band width. As you can see in the second half of the chart, narrowing bands indicate reduced volatility and often occur before significant price movements. In this context, a narrowing BBW on a Litecoin chart could indicate that the market is nervous and bracing for an imminent breakout or collapse.
When Bollinger mentions Litecoin’s underperformance compared to Bitcoin, it is important to note that Bitcoin often drives cryptocurrency market trends. If Litecoin fails to keep up with Bitcoin’s movements, this could suggest a lack of trader confidence or interest in altcoins (as evidenced by the current rise in Bitcoin dominance) and Litecoin in particular.
In summary, Bollinger’s technical analysis indicates that Litecoin is in a precarious position. Price action in the lower Bollinger Bands, a bearish ‘2-bar reversal’ pattern, Bollinger %B values below 0.5, and a narrowing BBW all suggest that Litecoin may continue to face downward pressure in the near term.
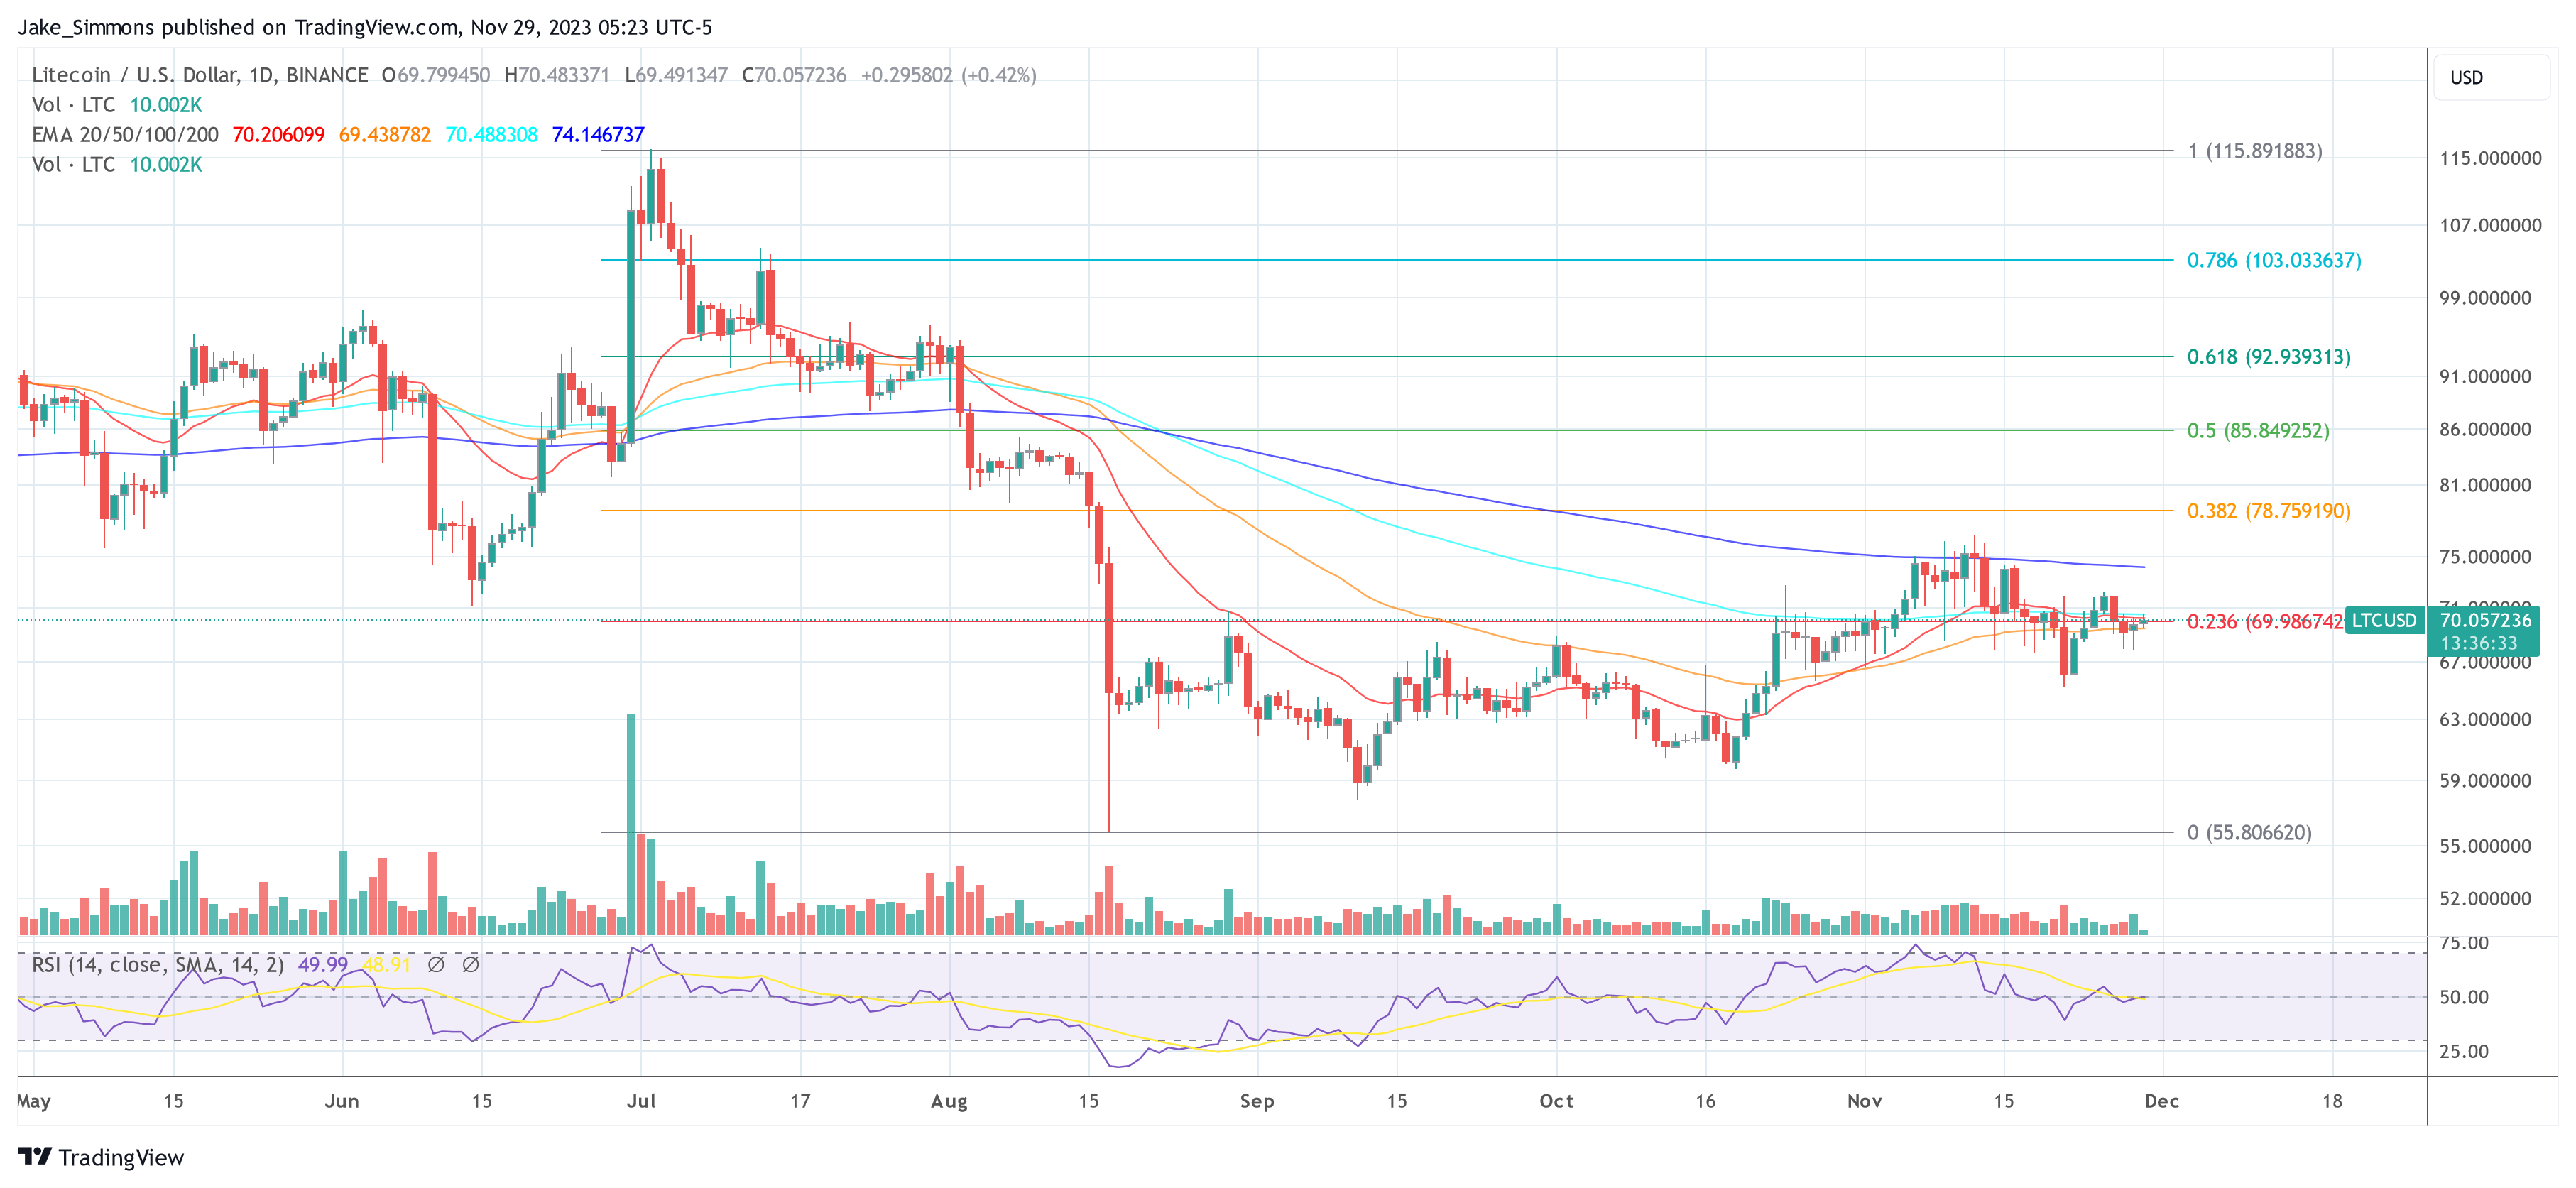
At press time, Litecoin was trading at $70.05. Looking at the 1-day chart of LTC/USD, we can see that the altcoin has fallen below the key support line of the 0.236 Fibonacci retracement level, which was $69.98 two days ago. A retest is currently underway, and a daily close above this is most important for the Litecoin price.
Featured image by Unsplash / Kanchanara, chart by TradingView.com


