ICT Series: Liquidity, Power of 3 and Sessions – Trading Systems – June 19, 2024

What is ICT Series?
The Well ICT series focuses on using all the different tools ICT teaches, simplified for use by everyone. This way we can see the market from a different perspective and ease the decision-making process. Of course, there are so many concepts to use, so in this particular article I will focus on the ones I consider the most important.
- trading session
- power of 3
- liquidity
Let’s go to the chart.
Let’s start next trading session, why is it so important? We all know that markets consist of the exchange of assets between buyers and sellers. Logically, this transaction occurs at a specific time. Now why is session timing important? Well, banks, funds, governments and companies that exchange certain assets are likely to do this during working hours because they need to be present during the transaction. For this reason, it makes sense for all actions and movements to occur during banking hours in the country where the currency in question is used.
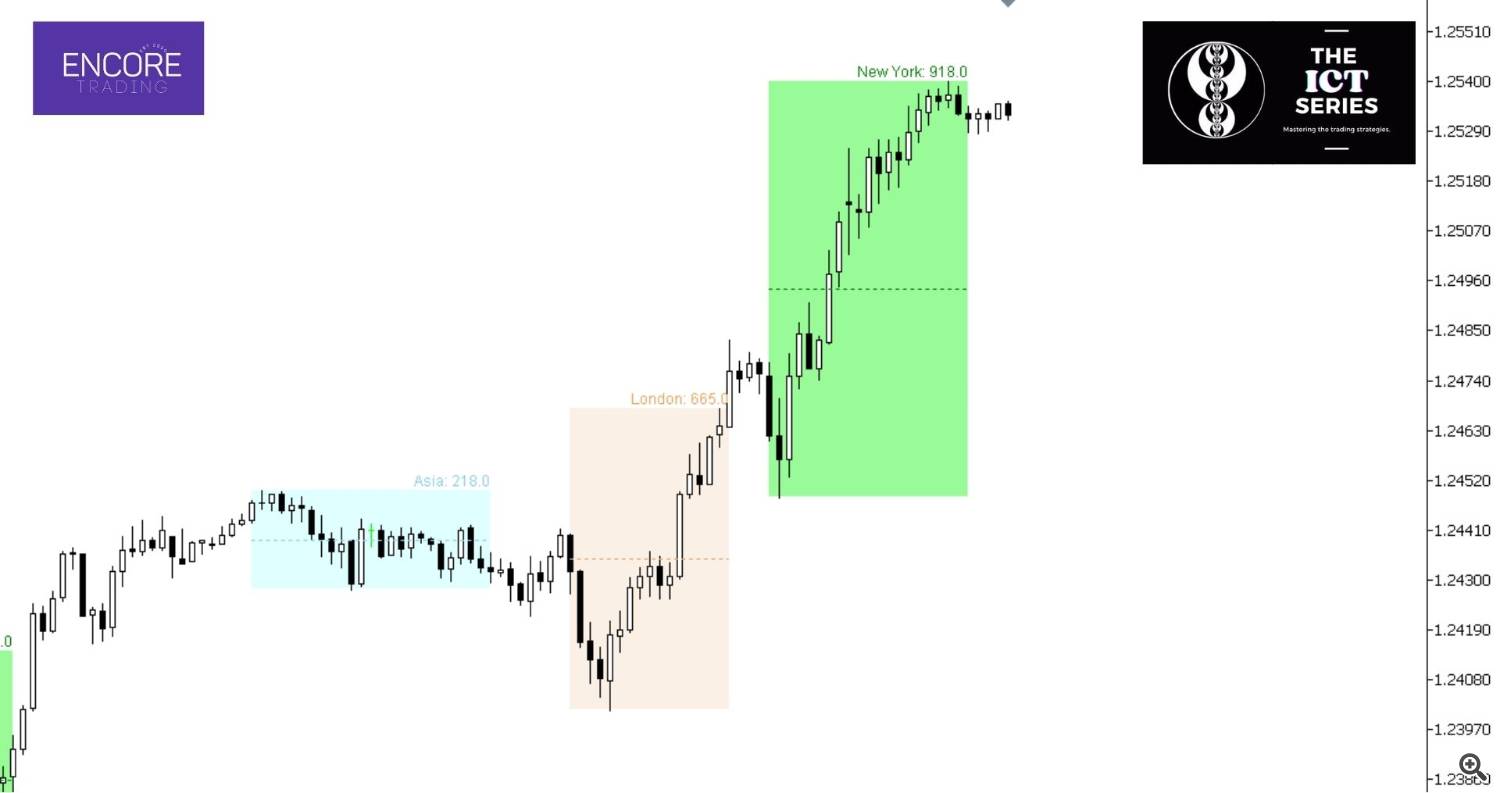
As you can see in the figure, EURUSD’s movements are greatest in London and New York, while they are somewhat slower in Asia.
If not, I’m glad you learned it here. We all probably knew that this was the simplest explanation you would get. Session indicators not only tell you when to trade, but also how much the market has moved previously. This gives you an expectation of what today’s moves will be and gives you an idea of where the midpoints are. During that session, there are cheap and expensive levels. It also has an alarm, so you don’t have to sit in front of your computer waiting for a session to start or set an alarm yourself. The indicator does it for you.
But now… What is a good entry area for us? Well, this is technical analysis and power of 3 It’s useful.
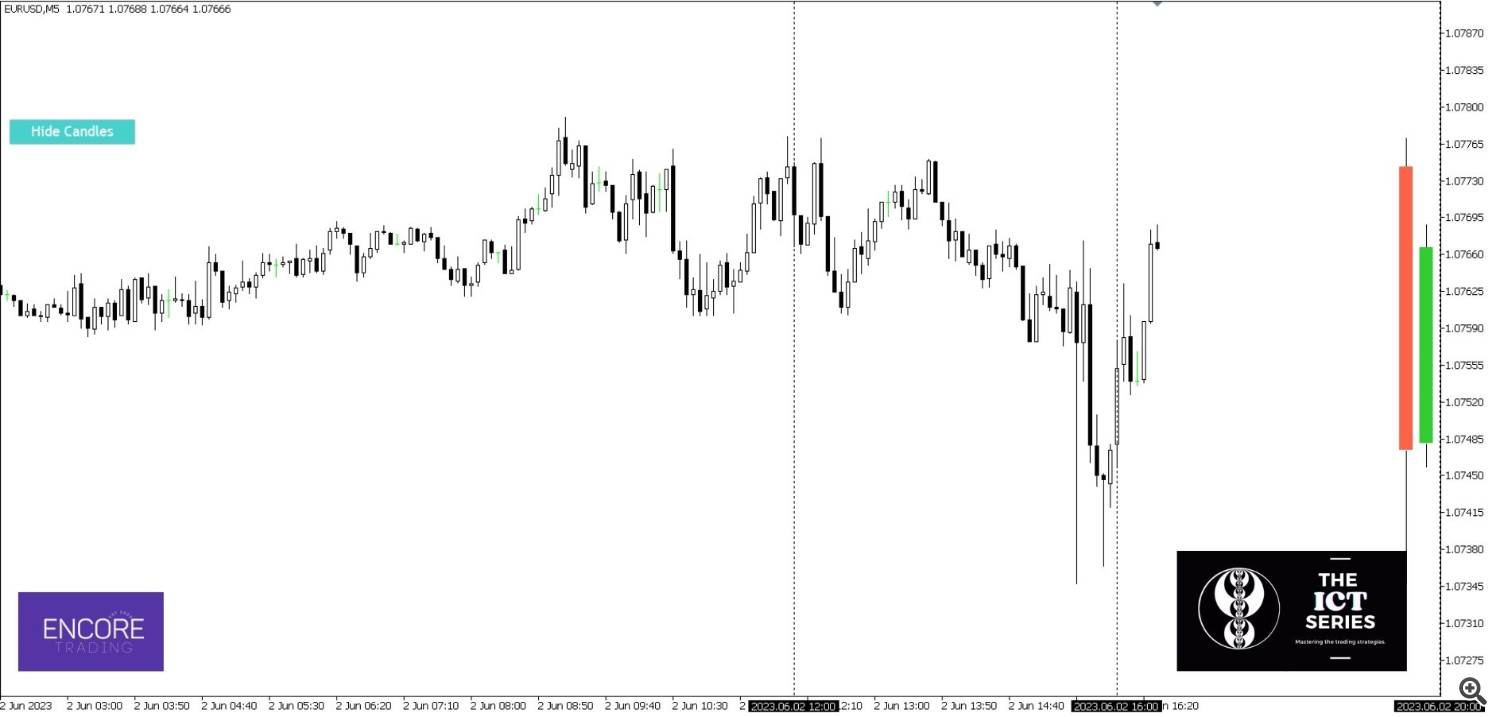
By analyzing the chart as shown above, you can determine the expected direction based on the previous day’s price movements (tools for this are currently being developed!) and decide which scenario you like best. This is what we are trying to enter. As above, we are clearly expecting a bearish move after a strong sell candle in HTF and as expected, it would have taken the right direction as can be seen in the picture below.
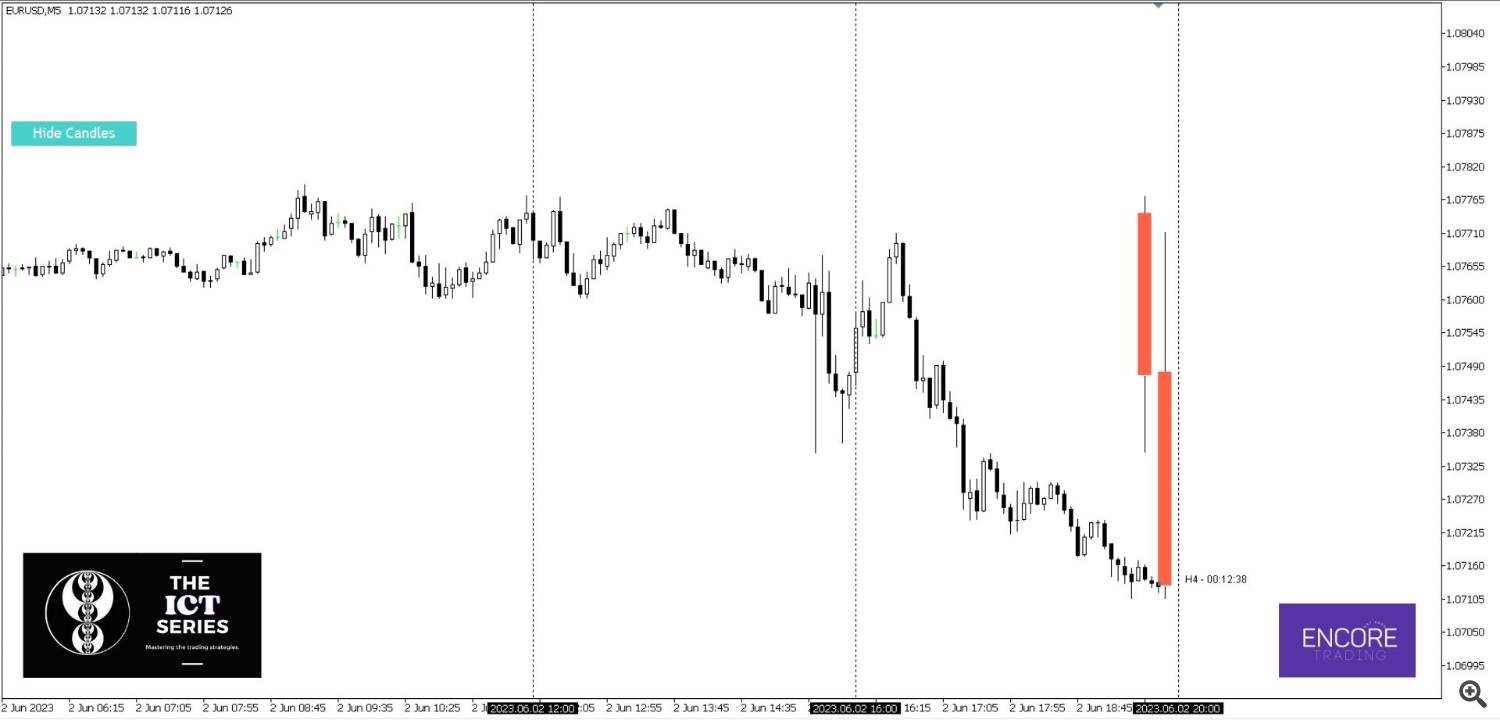
The power of three will help us keep an eye on larger time frames and catch good prices based on expected bias. As we know, every candle has a wick, and using powers of 3 will not only help you know what the expected range of your candle is, but will also help you grab the wick and get the best price possible. This tool also has a feature that shows us the most likely forecast for the current candle, and we can use this along with our own confluence to make good trades.
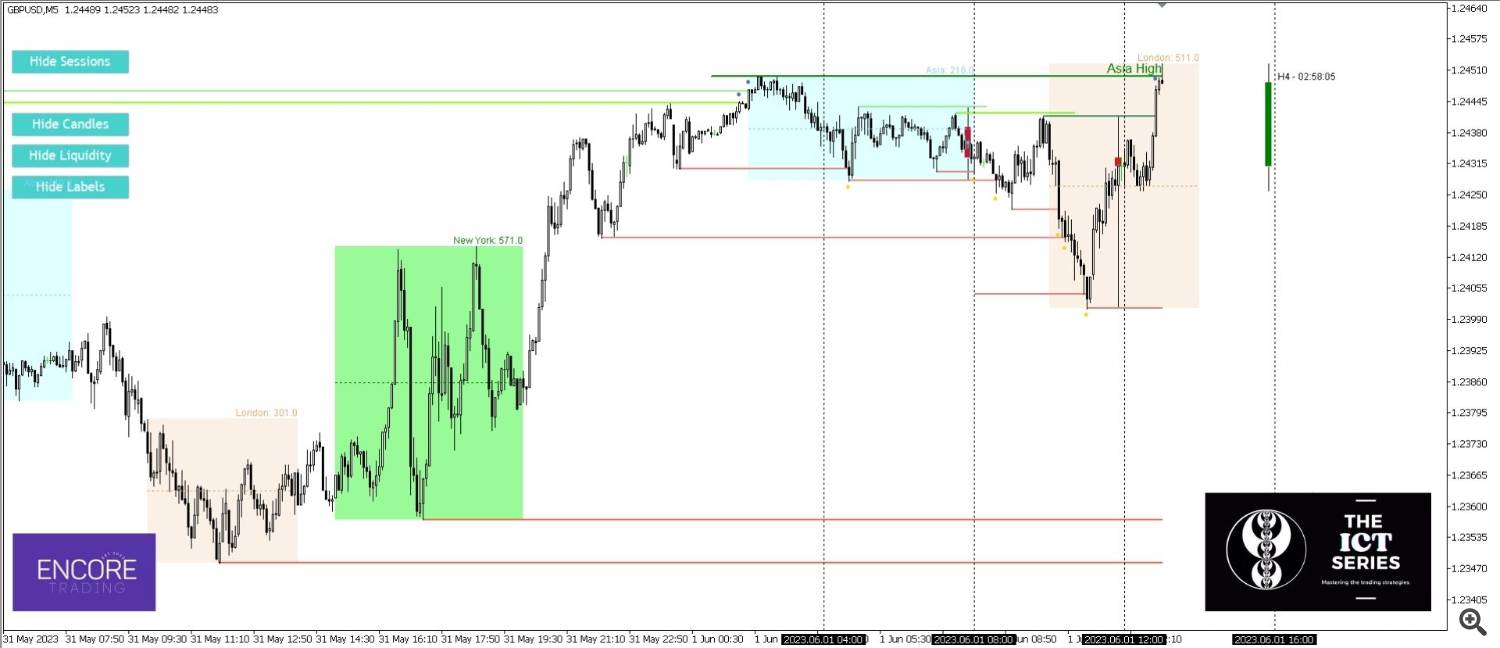
Now we have the time to find our entry point, the area we are interested in trading and our ideal direction. And this is where our most important tool comes into play. Liquidity indicator. This amazing tool shows you the most likely reversal areas. This creates high-potential trades by tapping at the right time with the right HTF bias and momentum.
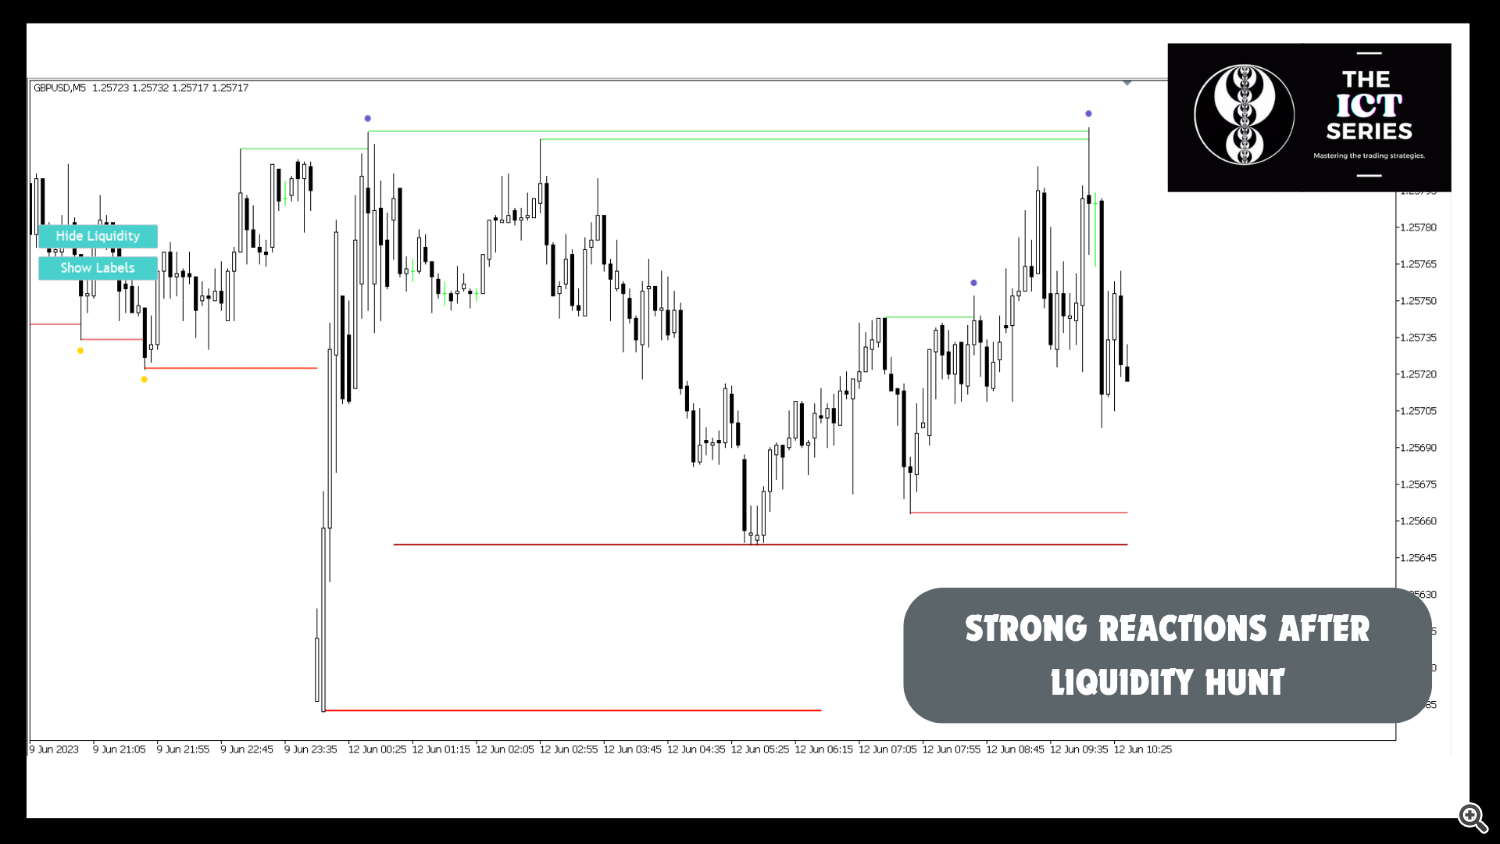
When the liquidity pool is tapped, as you can see in the picture, you will see a point below the candle indicating a potential reversal, aligning this with the LTF’s external entry model and incoming momentum to create a successful trade. Why? Well, the liquidity indicator shows the price at which large players can fulfill their orders, triggering the next expansion leg.
There are several entry models, depending on your risk and preference. We are currently developing indicators that will show you some of the best entry patterns to ease your decision-making process. If you find this indicator useful, please let us know!
Now, all these ICT tools are a great help in trading, but the most important thing to always keep in mind is how to use them together. Because therein lies the key. They are tools for reading the market, but each reads different things, so it’s important to keep them all aligned together.
What’s next?
Now, it’s time to try out the tool. All tools can be found at the following links and in my profile: Test your concepts and start trading the right ICT right away. This is just the beginning of the series, and there are many more tips and tools to come to help you analyze the market (including EA’s doing what ICT suggests as the best strategy).
If you like these concepts and have a tool or idea you’d like to see, let us know and we’ll work to make it a reality and test the concept together. Let’s do better together.
Any questions, feedback or conversation is also welcome. Please leave a message in the comments section and we will get back to you as soon as possible.


