KRE’s imminent crash: What this new crisis means | Don’t ignore this chart!

key
gist
- SPDR S&P Regional Banking ETF (KRE) is trading within a fairly wide upward trend channel.
- KRE’s momentum for discovering short-term trading opportunities appears to be waning.
- Many local banks may face increasing debt delinquencies and may face bankruptcy.

Full disclosure: There are many ways to look at what follows, but this article will intentionally look at the issue from a bearish angle.
While some investors are looking at KRE, the SPDR S&P Regional Banks ETF, as a possible “long-term” outlook, it is important to consider the bearish case, which opens up opportunities on the near-term side, especially if the Federal Reserve begins to cut interest rates.
According to Bloomberg’s terrifying bombshell in February:, investors seem to be ignoring the “brutal reality” of delinquencies in the commercial real estate (CRE) market. Consider this:
- Community banks’ exposure to CRE can be as high as 28.7%, compared to just 6.5% held by large banks (according to JPMorgan).
- The CRE market is worth a whopping $5.7 trillion, with community bank portfolios accounting for 54% of loans.
- According to the National Bureau of Economic Research (NBER), approximately 385 community banks could fail if CRE loan defaults continue at current interest rates.
Technical Situation: Bullish Recovery or Lehman Moment?
KRE’s recovery began as soon as the Federal Reserve intervened to quell last year’s banking crisis using its Bank Term Funding Program (which expired on March 11). KRE’s dismal performance against the S&P 500 and Dow Jones U.S. Bank Index ($DJUSBK) reflects the dire situation facing regional banks due to their CRE exposure (see chart below).
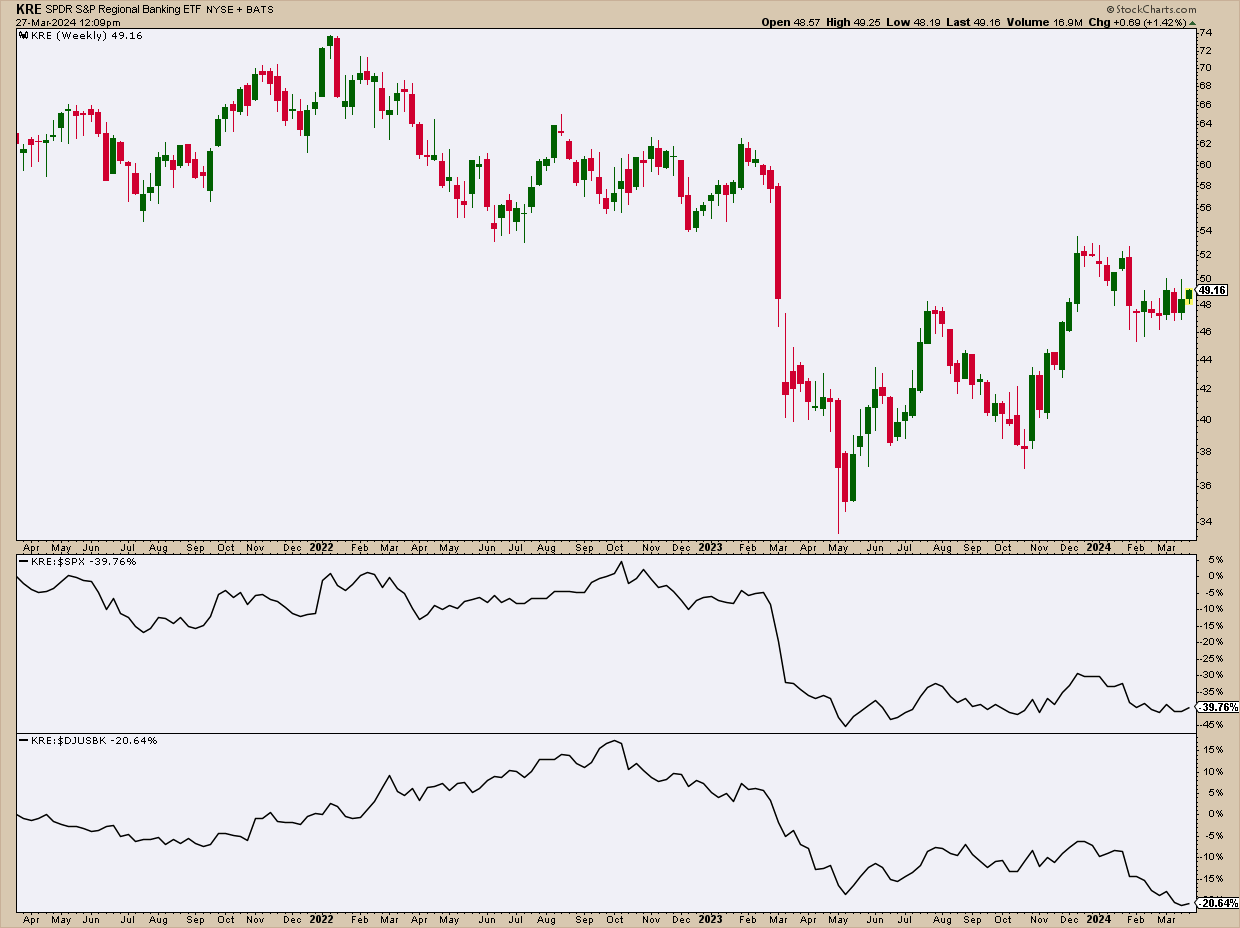
Chart 1. KRE’s weekly chart. Note KRE’s underperformance compared to the S&P 500 and Dow Jones US Banks Index.Chart source: StockCharts.com. For educational purposes.
short term perspective
The price of KRE is rising within an upward trend channel (see the black dotted line on the daily chart below), but momentum appears weak.
falling Balance Volume (OBV) The line indicates that the negative amount exceeds the positive amount. Chaikin Money Flow (CMF) fell below the 0 line. This indicates that selling pressure has created a void below the KRE rising base.
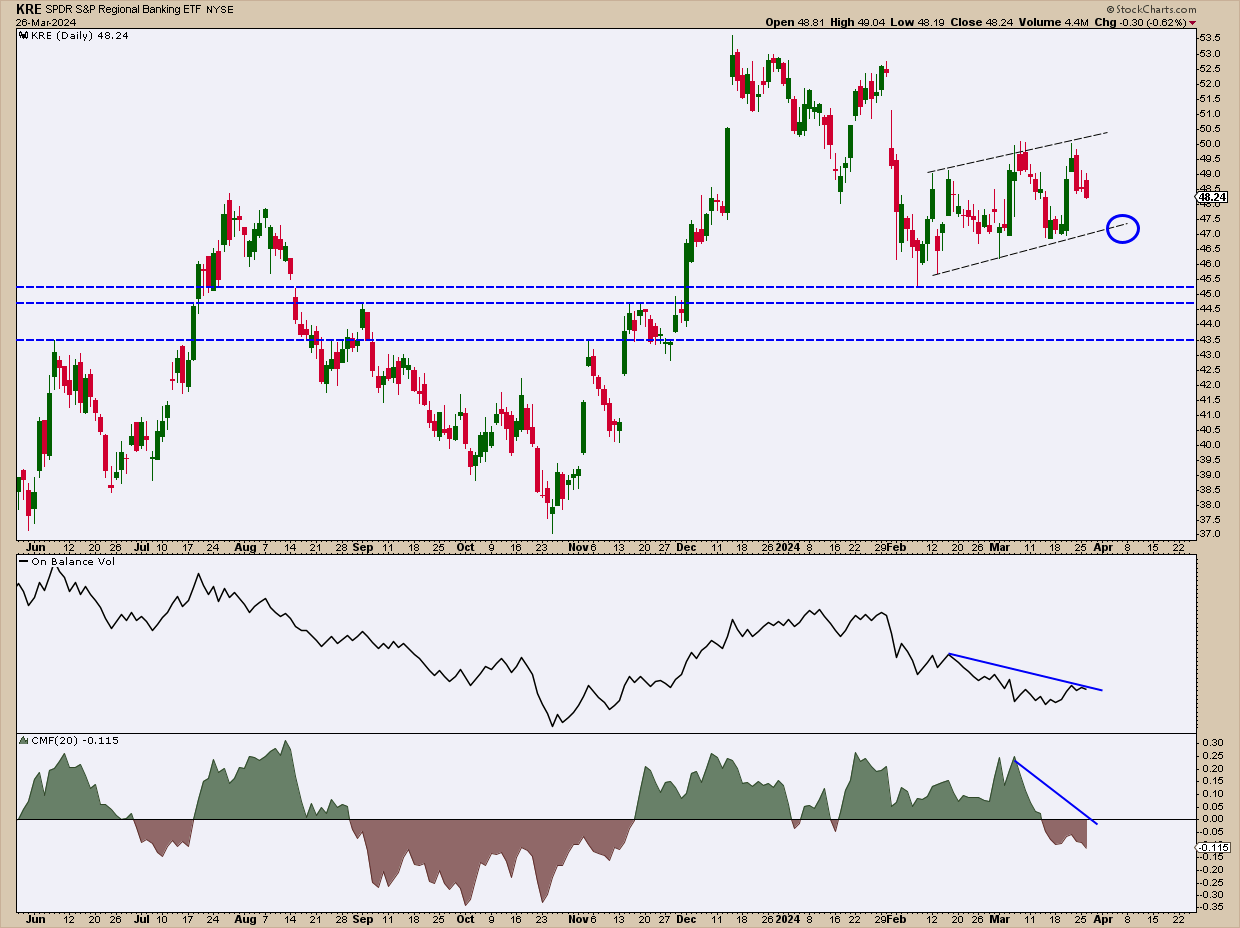
Chart 2. Daily chart of KRE. KRE’s rise within the trend channel may look like a steady yet cautious recovery after the most recent pullback, but a look at momentum indicators shows intensifying selling pressure that could curb the bullish momentum.Chart source: StockCharts.com. For educational purposes.
If you want to go short, you need to wait for the price to break through the channel bottom (see blue circle) before going short. When taking a short position, the three targets must be cleared immediately (the stop loss must be placed at the top of the channel).
- Target 1. Most recent swing low $45.31
- Target 2. Previous resistance at $44.75 (could become support)
- Target 3. Previous resistance at $43.50

These levels do not reflect the bleak underlying figures if the very bearish forecasts unfold. This represents low hanging fruit ideal for a bearish swing trade. If the sub-sector develops as the Ultra Bears envision it to do, you can look at the weekly chart and mark targets based on long-term support or resistance levels. There are no charts for KRE yet, so it might be a good idea to stick to easy targets.
conclusion
KRE’s case may or may not be clear evidence of the folly of mainstream optimism. With the Federal Reserve acting as a puppet master and investors ignoring the looming disaster for commercial real estate (CRE) delinquencies, the scenario appears quite predictable. If bearish fears are correct, those betting on a bullish resurgence are playing with fire.
Actual play here can be a bit on the short side. If a systemic crisis develops with extremely bearish forecasts, positioning yourself on the right side of the market means harnessing the destructive power of the trend rather than becoming its victim.
disclaimer: This blog is for educational purposes only and should not be construed as financial advice. You should not use any of our ideas and strategies without first evaluating your personal and financial situation or consulting a financial professional.

Karl Montevirgen is a professional freelance writer specializing in finance, cryptocurrency markets, content strategy, and art. Karl works with several organizations in the equities, futures, physical metals and blockchain industries. He holds a FINRA Series 3 and Series 34 license in addition to a dual MFA in Critical Studies/Writing and Music Composition from the California Institute of the Arts. Learn more


")
