Lessons Learned: Designing A Crack-Free REIT Portfolio

BanksPhotos
My life was drastically different three decades ago.
There are plenty of personal changes I can point to – including an ever-growing grandson who’ll be hitting the big 2 soon enough! – but let’s focus on the professional for this particular article.
Three decades ago, the housing market was still busy bubbling. So I was still busy building commercial real estate (“CRE”) shopping centers.
Back then, I was a developer who would scout out suitable retail locations… secure the proper permits… hire competent construction companies… and oversee everything until there was a brand-new stand-alone store or strip mall ready to open its doors.
Sometimes, I did all this on my own terms before I had a tenant. Other times, specific companies contracted me to build to their particular specifications, also known as “to-spec.”
That was the case with a PetSmart job I accepted about 27 years ago in Spartanburg, South Carolina. I remember the place well considering the specific instructions it came with.
PetSmart wanted its new location to be built on a “crack-free slab,” which wasn’t the norm at the time. So, I had to do some extra work in order to meet the requirements – both in terms of research and effort.
But what the customer wants (and pays for), the customer gets. So, I did as instructed.
Today, that PetSmart still stands, reminding me every time I pass it that a crack-free foundation is possible.
And, for the record, your portfolio can do the same 27 years down the road.
X (rbradthomas)
There’s Concrete and Then There’s Type K
Don’t worry if you don’t understand the concept of a crack-free slab. Like I already said, it was a concept I had to look into as well.
Obviously, nobody wants a cracked building or base. But there are some separations to be expected and dealt with accordingly.
To explain, here’s a really interesting (at least to me) Komponent article from August 2007:
“Control joints normally required in concrete slabs can be eliminated by the use of shrinkage-compensation concrete made with Type K expansive cement. Control joints are usually necessary to manage the cracking that accompanies drying shrinkage. However, since Type K negates the stresses induced by shrinkage, it can prevent cracks, achieving a jointless floor that performs better and saves money for building owners over a long service life…
“Since its development, the material has established a track record for successful use as a structural material on projects ranging from Naval facilities in Maryland to parking structures in California. Only recently, however, has Type K come into its own as a standard solution for large interior floor slabs.”
Which means whoever was making ultimate decisions for that PetSmart was about a decade ahead of the times. Don’t ask me how he knew, but somehow he understood that this crack-free concept “answers a broad range of application issues” large projects can too often face.
The article goes on to explain how:
“All concrete shrinks as it dries… As a slab-on-grade shrinks, it attempts to move, creating friction with the subgrade and producing tensile stresses. If these stresses exceed the concrete’s tensile strength, the slab cracks. Control joints are cut to create weak points, which encourage cracks to occur in straight lines at evenly spaced intervals.”
That’s what I was used to. But there’s always an opportunity to live and learn!
REITs That Expand as You Go Along
Here’s a bit more of that article’s explanation (for those of you I haven’t bored to tears yet):
“Invented in 1960, shrinkage-compensating concrete contains a small percentage of special expansive cement that causes the concrete to expand prior to drying, relieving the tensile stress caused by drying shrinkage. Alleviating the stress virtually eliminates drying shrinkage cracks…
“Typical uses (for shrinkage-compensating concrete) include retail spaces, warehouses, factory floors, and parking garages where jointing is unsightly, causes a nuisance, or creates safety problems with equipment moving over it.”
The list goes on from there, but I’ll curb my CRE enthusiasm to get to my real estate investment trust point… including the four specific REITs I’m recommending today.
Not everything can be perfectly positioned and prepared when you’re constructing a building. Paint will eventually chip. Upgrades will eventually need to be made to change with the times. And even then, the ground could open up and swallow your property whole down the road.
However, you can commit to using quality materials and build far from fault lines to boost your chances against catastrophe.
Structures tend to hold up and pay off when the men and women behind them follow such common-sense rules.
The same applies to constructing a portfolio. You want the assets within it to be high-quality companies with proven track records.
That’s not to say every single stock you hold has to be half a century old. Only that you should have a good idea of how they’re going to perform because you have a solid grasp of where they’ve been.
In other words, own companies with strong foundations and clear purposes – that, of course, pay steady, growing dividends along the way. In which case, I’d call the four REITs below about as “crack-free” as you can find.
Realty Income Corporation (O)
I consider this real estate investment trust (“REIT”) one of the most “crack-free” publicly traded companies.
There are no cracks in the company’s business model, no cracks in its portfolio of net lease real estate, no cracks in its balance sheet or earnings history, and no cracks in its dividend history.
In the simplest of terms, Realty Income employs a spread business model. The company invests in commercial properties at its cost of capital and receives a cash yield from the rent checks received on the leased properties.
The company acquires commercial real estate through portfolio acquisitions, one-off transactions, and corporate sale leasebacks. It then leases the properties to tenants operating across multiple industries on a long-term, triple-net basis.
Due to the nature of O’s net leases, the tenant is responsible for property operating expenses including taxes, insurance, and property maintenance. Escalations are typically embedded in the net lease agreement to provide internal growth and new property investments are made to promote external growth.
In 2023, the company invested more than $9.5 billion in commercial real estate at a weighted average cash yield of 7.1%. On the 4Q-23 earnings conference call management disclosed that it had achieved an investment spread of roughly 120 basis points during 2023, implying a 2023 average cost of capital of 5.90%.
O – IR
There are no cracks in Realty Income’s portfolio, as the company owns or has an ownership interest in approximately 15,450 commercial properties covering 272.0 million SF across all 50 states, the United Kingdom, Germany, France, Italy, Spain, Ireland, and Portugal.
The company invests in single-tenant, freestanding commercial properties which are primarily leased to tenants operating in the retail industry. In addition to its retail properties, the company owns industrial and gaming properties. At the end of 2023, retail properties made up 81.8% of the company’s portfolio while industrial and gaming made up 12.7% and 3.9% respectively.
Subsequent to the end of 2023, the company closed its acquisition of Spirit Realty (SRC), which will increase O’s industrial holdings to represent roughly 15% of its portfolio.
While the majority of O’s properties are used in the retail sector, the company looks to acquire properties operated by tenants doing business in industries which are resilient to e-commerce such as non-discretionary, service-oriented, and low price point retail.
The company’s top tenant is Dollar General (DG), which makes up approximately 3.8% of its annual rent and its top industry is grocery, followed by convenience and dollar stores.
O – IR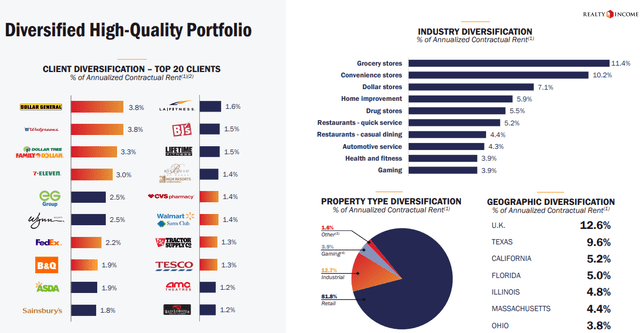
There are no cracks in Realty Income’s balance sheet. The company is investment-grade with a credit rating of A- from S&P Global and has strong debt metrics including a net debt to pro forma EBITDAre of 5.5x, a long-term debt to capital ratio of 36.90%, and a fixed charge coverage ratio of 4.7x.
The company’s debt is 96% unsecured and 94% fixed rate and has a weighted average term to maturity of 6.7 years. Additionally, at the end of 2023 the company reported $4.1 billion of liquidity.
O – IR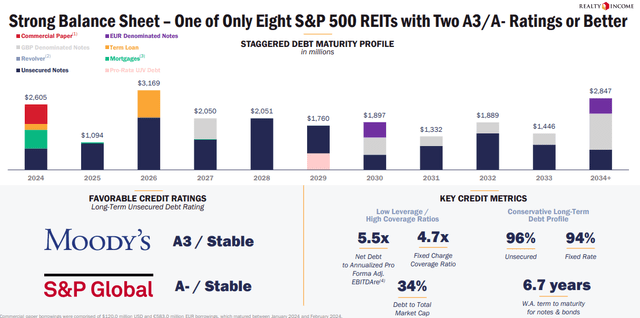
And there are no cracks in Realty Income’s earnings or dividend history. The company was founded in 1969 before going public in 1994. O has achieved positive adjusted funds from operations (“AFFO”) growth in 27 out of the last 28 years and a median AFFO growth rate of 5% since 1996.
The company has delivered a 13.9% compound annual return since its IPO with only half the volatility of the broader market with a Beta of 0.5 compared to the S&P 500 (SP500).
Finally, the company is a S&P 500 Dividend Aristocrat and has increased its dividend for 29 consecutive years at a compound annual growth rate of 4.3%.
Realty Income is about as “crack-free” as they get with a large, diversified portfolio of quality real estate, a fortress-like balance sheet, and earnings and dividend history that would be envied by most companies.
Currently the stock pays a 5.91% dividend yield that is well-covered with a 2023 AFFO payout ratio of 76.27% and trades at a P/AFFO of 12.92x, compared to its average AFFO multiple of 18.41x.
We rate Realty Income a Strong Buy.
FAST Graphs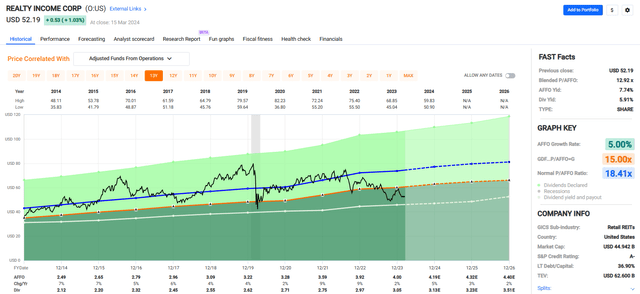
Public Storage (PSA)
Public Storage also is an S&P 500 company that has been doing business since 1972 and is currently the world’s largest operator and owner of self-storage properties.
The company has a market cap of approximately $48.9 billion and a 243.0 million SF portfolio made up of 3,368 properties with ~2 million customers in place.
In the United States, the company has interests in 3,044 self-storage facilities totaling ~218.0 million SF and internationally the company has interests in 275 self-storage facilities located across 7 countries in Europe through its 35% common equity interest in Shurgard Self Storage.
PSA specializes in the development, acquisition, and ownership of self-storage facilities that provide storage space for personal and business use. Its storage spaces are leased on a month-to-month basis which enables the company to quickly adjust its prices to market rates.
The self-storage REIT has a multiple types of storage units which are offered in a variety of sizes. PSA has traditional drive-up self-storage, business storage, climate-controlled storage, and vehicle storage.
The company offers small units, ranging from locker size to room sized, medium units which come in 5’ x 15’ (two rooms) or 10’ x 10’ (~3 rooms), large units which range from 10’ x 15’ to 10’ x 25’, and vehicle units that range from a single car, all the way up to vehicle units that can store recreational vehicles and boats.
As of its most recent update, the company’s portfolio has a square foot occupancy of 91.6%.
PSA – IR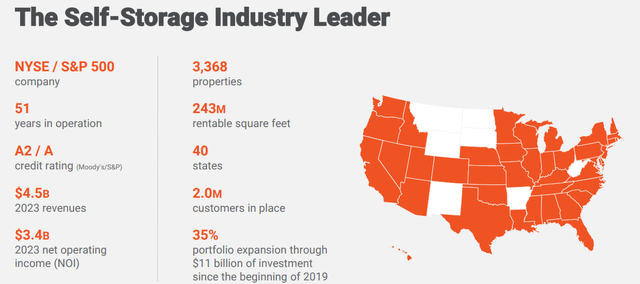
Public Storage has been modernizing its facilities by implementing a digital ecosystem which includes a mobile centric website with store locations, pricing, as well as an AI-enabled chat bot for customer convenience.
Other examples of the company’s digital transformation include digital rental agreements, digital property access, digital customer care kiosks, and smart camera security. At the end of 2023, PSA had implemented its digital property operating model in over 400 PSA properties.
PSA – IR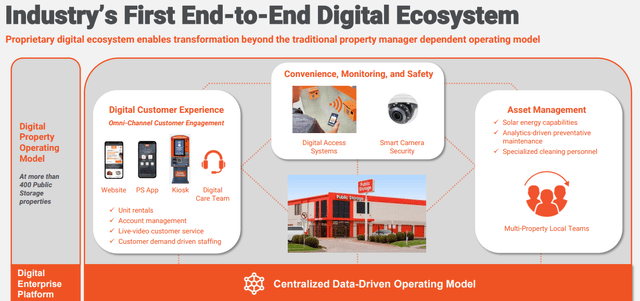
Public Storage has an investment-grade balance sheet with an A credit rating from S&P Global. For years, PSA primarily used preferred equity as its main source of capital. Recently the company has been adding debt and using it along with preferred equity to fund its external growth.
PSA has issued over $9.0 billion of debt at a blended rate of 3.0% and refinanced its preferred equity to a blended rate of 4.5%. In total, PSA’s cost of debt plus preferred equity comes to 3.5% as of its most recent update.
The company has strong debt metrics as well with a net debt + preferred equity to EBITDA of 3.9x, a long-term debt to capital ratio of 43.38%, and a debt-to-equity ratio of 90.1%.
PSA – IR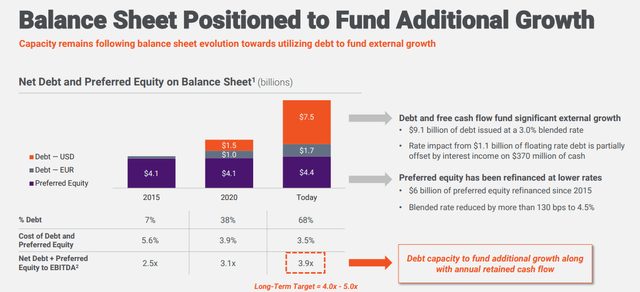
Since 2014 PSA has had an average AFFO growth rate of 6.63%. Analysts expect AFFO per share to increase by 1% in 2024 and then by 9% the following year.
The company pays a 4.33% dividend yield that is well covered with a 2023 AFFO payout ratio of 83.13%. From 2017 to 2021 PSA paid a quarterly dividend of $2.00 per share, or $8.00 per share annually.
In 2022 it maintained the quarterly dividend of $2.00 per share, but paid a special dividend of $13.15 per share, and in 2023 the company increased its dividend by 50%, from $2.00 to $3.00 per share paid quarterly.
Currently the stock is trading at a P/AFFO of 19.15x, compared to its average AFFO multiple of 22.97x.
We rate Public Storage a Buy.
FAST Graphs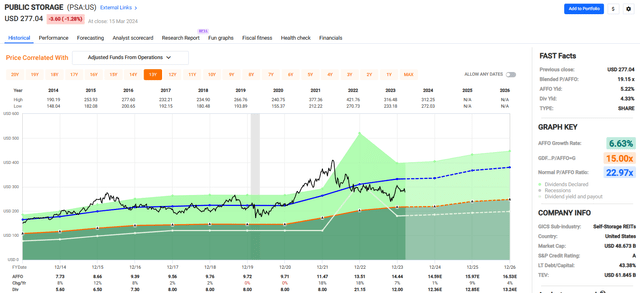
Mid-America Apartment Communities, Inc. (MAA)
MAA is a Sunbelt-focused apartment REIT that was established in 1977 and has been publicly traded since 1994.
The company specializes in the acquisition, ownership, and management of multifamily communities which are largely located in high-growth areas of the Southeast, Mid-Atlantic, and Southwest regions of the country.
The company has a market cap of approximately $15.1 billion and a multifamily portfolio consisting of 296 communities that contain 100,894 apartment homes.
In order to minimize the volatility of its operating performance, MAA’s portfolio is diversified across markets, submarkets, price points, and building styles.
70% of its properties are in large markets while 30% are located in mid-tier markets.
By submarket, 47% of the company’s portfolio is located in the inner loop, or the areas surrounding downtown, 42% is located in suburban areas, and 11% of its portfolio is located downtown within the central business district (“CBD”).
By property class, 51% of the REITs portfolio consists of class A- to B+, 38% consists of class A+ to A, and 11% consists of class B to B-.
By property type, 63% of MAA’s portfolio consists of garden style, which the company defines as 3 stories or less, 33% of its portfolio consists of mid-rise (4 to 9 stories) and only 4% of its portfolio consists of high-rise apartments.
As previously mentioned, MAA is a Sunbelt focused REIT with most of its largest markets in the Sunbelt region of the country.
By net operating income (“NOI”), MAA’s largest market is Atlanta, GA, which made up 12.7% of the company’s 4Q-23 Same Store NOI, followed by Dallas, TX and Tampa, FL which made up 9.6% and 7.2% respectively.
MAA – IR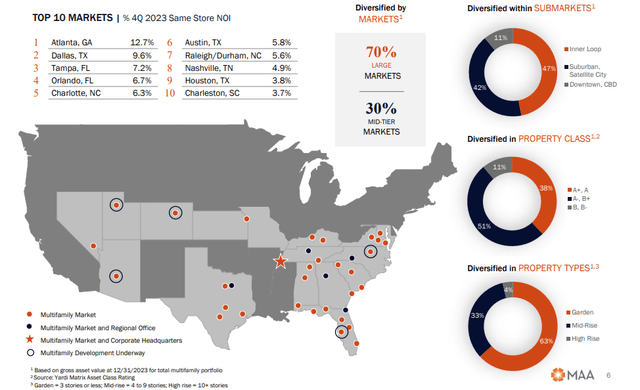
MAA’s large concentration in the Sunbelt has paid off as migration into the Sunbelt has only accelerated since the pandemic.
Multiple companies have recently moved their headquarters from non-MAA markets into markets where MAA has a strong presence, including Tesla and Oracle’s move to Austin TX, which is MAA’s sixth largest market, and Caterpillar’s move to Dallas, TX, which is MAA’s second largest market.
In addition to several prominent companies relocating to the Sunbelt, multiple investments in the region have recently been announced including Taiwan Semiconductor and Intel’s plan to build chip plants in Arizona.
Other examples include Samsung and Texas Instruments’ plan to build chip plants in Texas, Panasonic’s plan to build an EV battery plant in Kansas, and BMW’s plan to build an EV battery plant in South Carolina.
Expected production dates for many of the Sunbelt investments range from 2024 to 2026 and are expected to total over $100.0 billion and bring thousands of jobs to MAA’s markets.
MAA – IR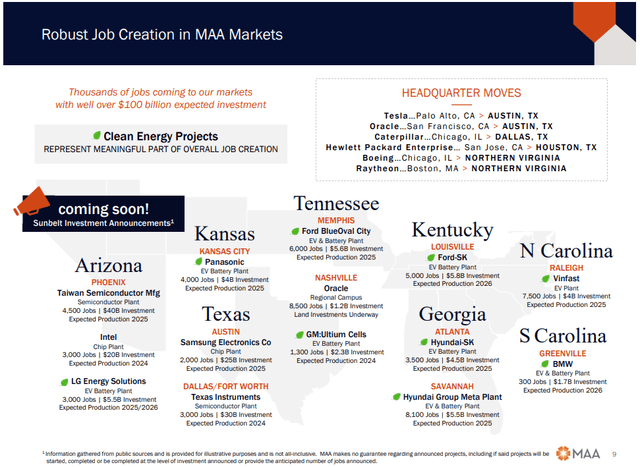
MAA has an A- credit rating from S&P Global and excellent debt metrics including a total debt to adjusted total assets ratio of 27.8%, a long-term debt to capital ratio of 34.39%, a net debt to adjusted EBITDAre of 3.6x and a debt service coverage ratio of 7.8x.
The company’s debt is 89.1% fixed rate with an average interest rate of 3.6% and a weighted average term to maturity of 6.8 years.
MAA – IR
Since 2014 the company has had an average AFFO growth rate of 5.74% and an average dividend growth rate of 7.37%. Moreover, since its IPO the company has paid 120 consecutive quarterly dividends and has never suspended or cut its dividend.
Currently the stock pays a 4.51% dividend yield that is well covered with a 2023 AFFO payout ratio of 67.96% and trades at a P/AFFO of 15.90x, compared to its average AFFO multiple of 19.18x.
We rate Mid-America Apartment a Strong Buy.
FAST Graphs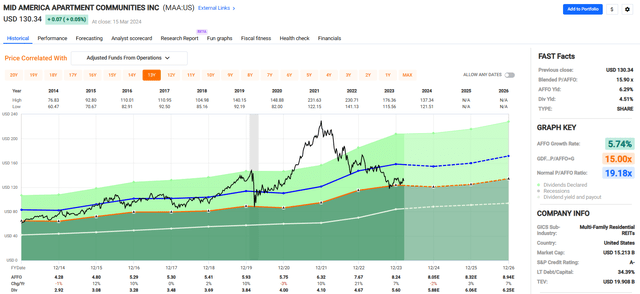
Simon Property Group, Inc. (SPG)
Simon Property is a mall REIT that has a market cap of approximately $49.5 billion and a portfolio comprised of leading retail, entertainment, dining, and mixed-use properties. The company specializes in the development and management of retail assets which primarily consist of shopping malls, The Mills, and Premium Outlets.
SPG owns or has an interest in 195 commercial properties across 37 states in the U.S. which consists of the following:
- 93 shopping malls
- 69 Premium Outlets
- 14 Mills
- 6 Lifestyle Centers
- 13 other retail properties.
Additionally, the company owns an 84% equity interest (noncontrolling) in The Taubman Realty Group, LLC (“TRG”), which has a portfolio of 24 super-regional and outlet malls located in the United States and Asia.
Adding to its international exposure, SPG has equity interests in 35 Premium and Designer Outlets located in Canada, Europe, and Asia and a 22.4% interest in Klépierre, which is a real estate company based out of Paris that owns or has an ownership interest in shopping centers located in 14 countries across Europe.
As a percentage of its net operating income (“NOI”), SPG receives 71.4% of its NOI from its U.S. Malls and Premium Outlets, 11.3% from The Mills properties, 9.4% from its international assets, and the company receives 7.9% of its NOI from its investments in TRG.
As a percentage of its U.S. Portfolio NOI, the mall REIT’s heaviest exposure is in Florida at 18.7%, followed by California at 14.1% and Texas at 10.2%.
SPG – IR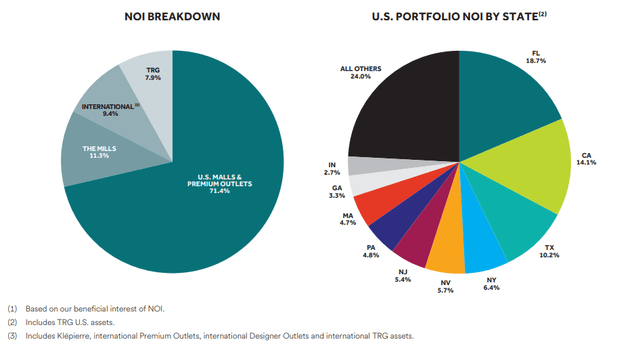
Outside of its core business of collecting rent checks, SPG engages in several activities to increase and diversify its revenue stream including:
- Equity investments in SPARC Group and J.C. Penney
- A licensing venture with Authentic Brand Group, LLC
- An e-commerce venture with Rue Gilt Groupe.
From the example below, you can see that SPG receives multiple income streams outside of its lease income.
In addition to its lease income, the company receives interest & dividend income, mixed-use and franchise operations income, its share of JV income, its share of Klépierre income, and its share of other platform investments income.
SPG – IR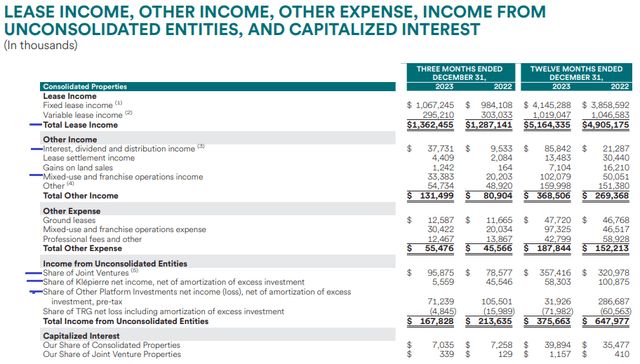
SPG has an investment-grade balance sheet with an A- credit rating from S&P Global. The company has solid debt metrics including a total debt to total assets ratio of 41.0% and a total secured debt to total assets of 18.0%.
For total assets, SPG calculates the value using NOI divided by a 7.0% cap rate, essentially using the market value rather than the book value.
Additionally, the company has a net debt to EBITDA of 6.1x and a fixed charge coverage ratio of 4.3x. 96.6% of its debt is fixed rate and has a weighted average interest rate of 3.70% with a weighted average term to maturity of 7.2 years.
Plus, as of the end of 2023 the company reported $10.9 billion of liquidity, which includes almost $3.0 billion of cash on hand.
SPG – IR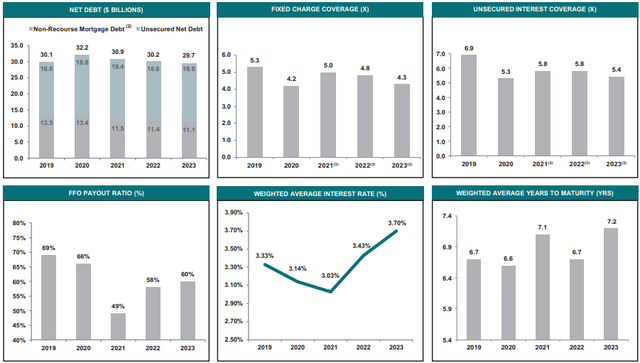
Since 2014 the company has had an average AFFO growth rate of 3.54%. Analysts expect AFFO per share to fall by -1% in 2024, but then to increase by 3% and 7% in the years 2025 and 2026 respectively.
Prior to the pandemic, SPG paid a dividend of $8.30 per share. As a consequence of the shutdowns the company was forced to cut its dividend in 2020 from $8.30 to $6.00 per share, representing a dividend cut of -27.71%.
While no income investor ever wants to see a dividend cut, it should be noted that SPG has done a nice job of getting its dividend back to pre-pandemic levels. In 2022 the company increased its dividend by 17.95% and in 2023 it increased its dividend again by 7.97%, to $7.45 per share.
Analysts expect that by 2025 the dividend rate will increase to $8.20 per share, just 10 cents off from its dividend rate in 2019.
The stock pays a 5.13% dividend yield that is well covered with a 2023 AFFO payout ratio of 67.27% and trades at a P/AFFO of 13.76x, compared to its average AFFO multiple of 15.92x.
We rate Simon Property Group a Buy.
FAST Graphs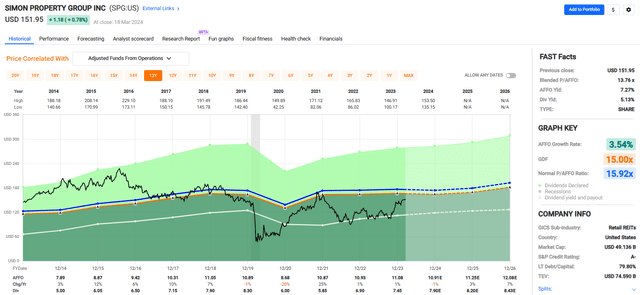
In Closing
Much like the buildings that I constructed as a real estate developer, I insist on designing quality investment portfolios that withstand the test of time.
The truth is, concrete does crack, which is the reason that I insist on using expansion joints which are gaps which allow concrete to move without breaking.
Likewise, I always insist on using a margin of safety when it comes to stocks that we recommend or purchase.
All four of the REITs referenced in this article are trading at a margin of safety which is the essence of our investment strategies which serves as a buffer for our “crack free.”
As always, thank you for reading and commenting.
Happy SWAN investing!
