Markets in “wait and see” mode: Awaiting important inflation data | chart watcher

key
gist
- Investors are anxiously awaiting PCE data for clues as to when the Federal Reserve will cut interest rates.
- Small-cap stocks seem eager to break out of their range and join the bullish stock rally.
- Bitcoin is having a strong week, with three consecutive days of significant gains, inching towards all-time highs.

This week is an important one for economic data, including durable goods, consumer confidence, GDP, and PCE.
The decline in durable goods in January had no impact on stock markets. The revised GDP figures are also slightly lower.
focus on inflation
Traders are anxiously awaiting PCE data for clues as to when the Federal Reserve will begin cutting interest rates. Treasury yields are slightly higher. This is probably due to the recent good performance of the two-year and five-year bond auctions. The US dollar is falling.
It’s as if the stock market has adopted a “wait and see” approach. We’ll have to wait until Thursday morning when the PCE is announced. Will the stock market move significantly in either direction?
Times are changing
There were some changes to the Dow Jones Industrial Average ($INDU) and Dow Jones Transportation Average ($TRAN) this week. Amazon (AMZN) has joined the Dow, replacing Walgreens Boots Alliance (WBA). It remains to be seen whether this inclusion will help the DJIA’s performance and bring it closer to that of the S&P 500. What’s interesting is that stocks to be added to the index tend to rise between announcement and inclusion. After that, stock prices often fall, and stocks that get kicked out tend to do better. Shares of AMZN closed lower today, with the Dow down about 97 points. But there will be no need to sell AMZN as there will be no trend at some point.
The addition of Uber Technologies to $TRAN is an interesting change. Because most of the companies that make up $TRAN are transportation and freight companies. The addition of AMZN and UBER to both Dow Jones indices reflects changing times.
It is interesting to see how $TRAN performed compared to $INDU (see chart below). While $INDU was hitting new highs, $TRAN was lagging. This violates one of the principles of Dow theory. In other words, if $INDU and $TRAN are trending in the same direction, the entire stock market will trend in a similar direction. While $TRAN is not hitting new highs, $INDU continues to hit new highs.
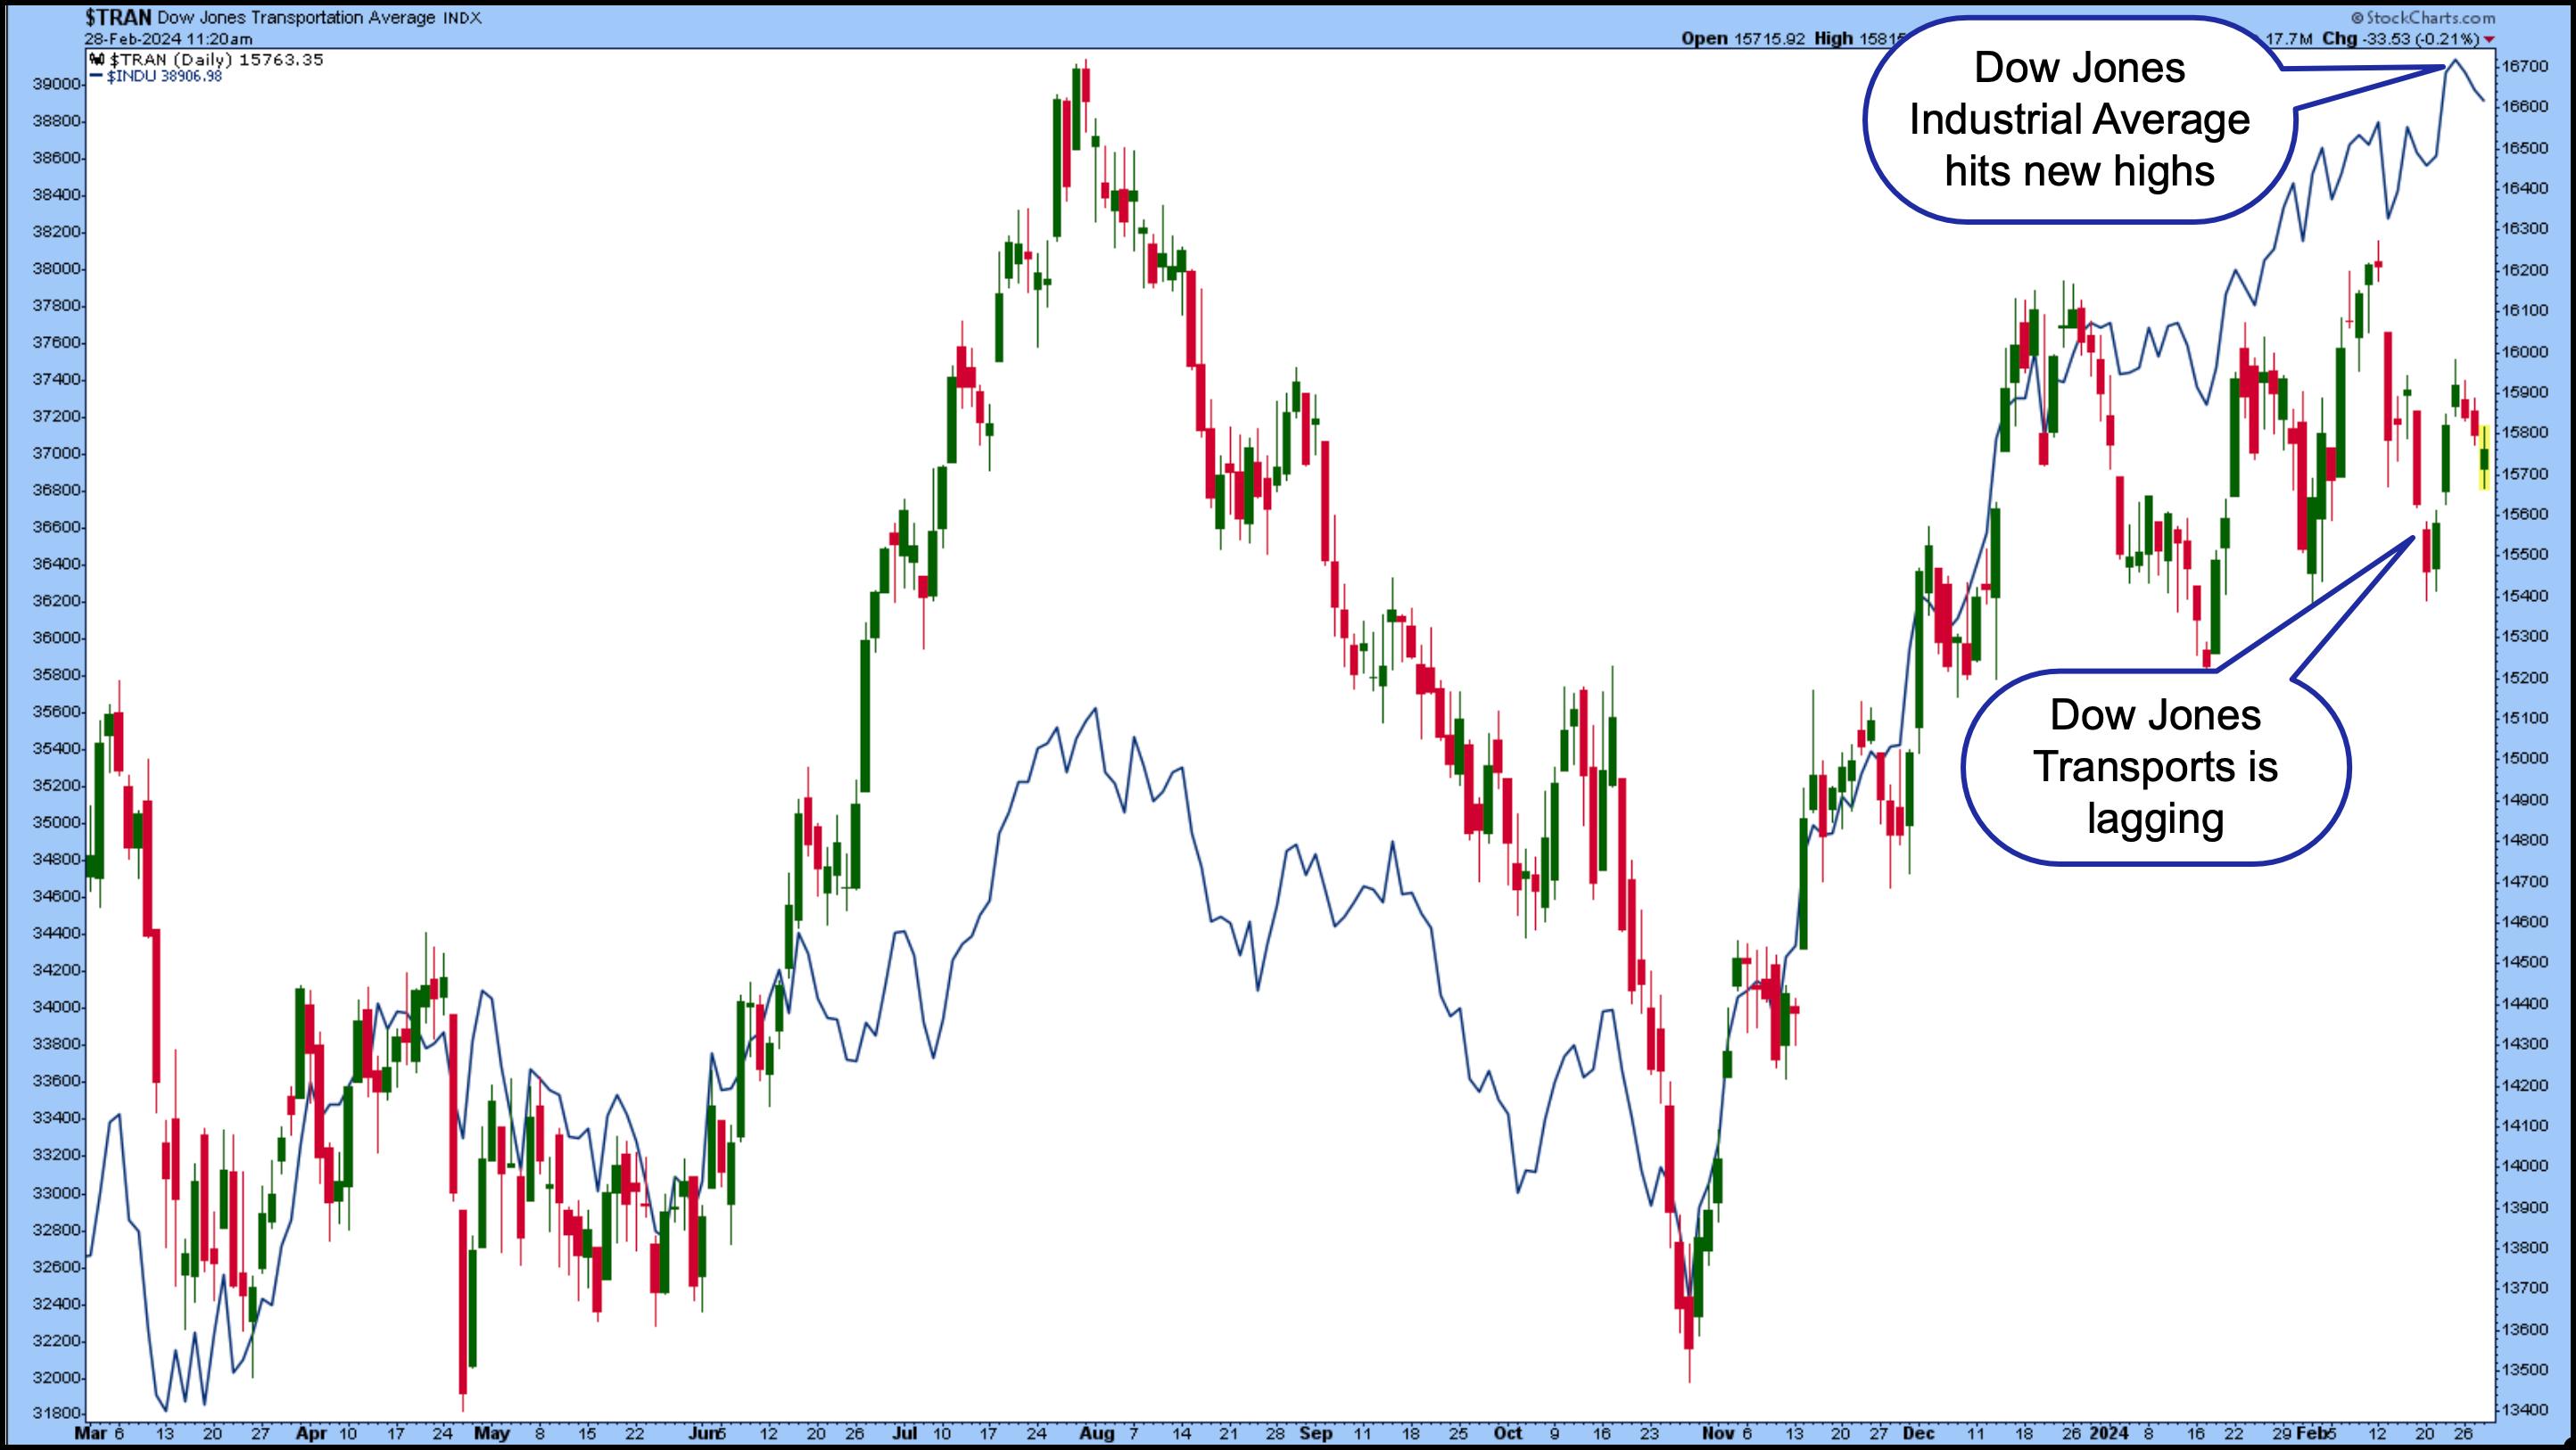
Chart 1. Compared to the Dow Jones Transportation Average ($TRAN). Dow Jones Industrial Average ($INDU). While $INDU has hit new highs this year, $TRAN has not done the same.Chart source: StockCharts.com. For educational purposes.
Meanwhile, on the equities side, chip stocks continue to outperform the broader market. It’s not just NVIDIA (NVDA). Micron Technology (MU) hit a new 52-week high on news that it will begin mass production of its high-bandwidth memory E3 chips. This chip is integrated into the Nvidia H200 graphics processing unit. Arm Holdings (ARM) is also surging this month after partnering with some large AI players.
Small cap stocks want to join the party too
As semiconductors continue to rise, small-cap stocks don’t want to be left behind. The weekly chart of the iShares Russell 2000 (IWM) shows that it is trying to break through the resistance level of its trading range (see weekly chart below). Will it succeed?
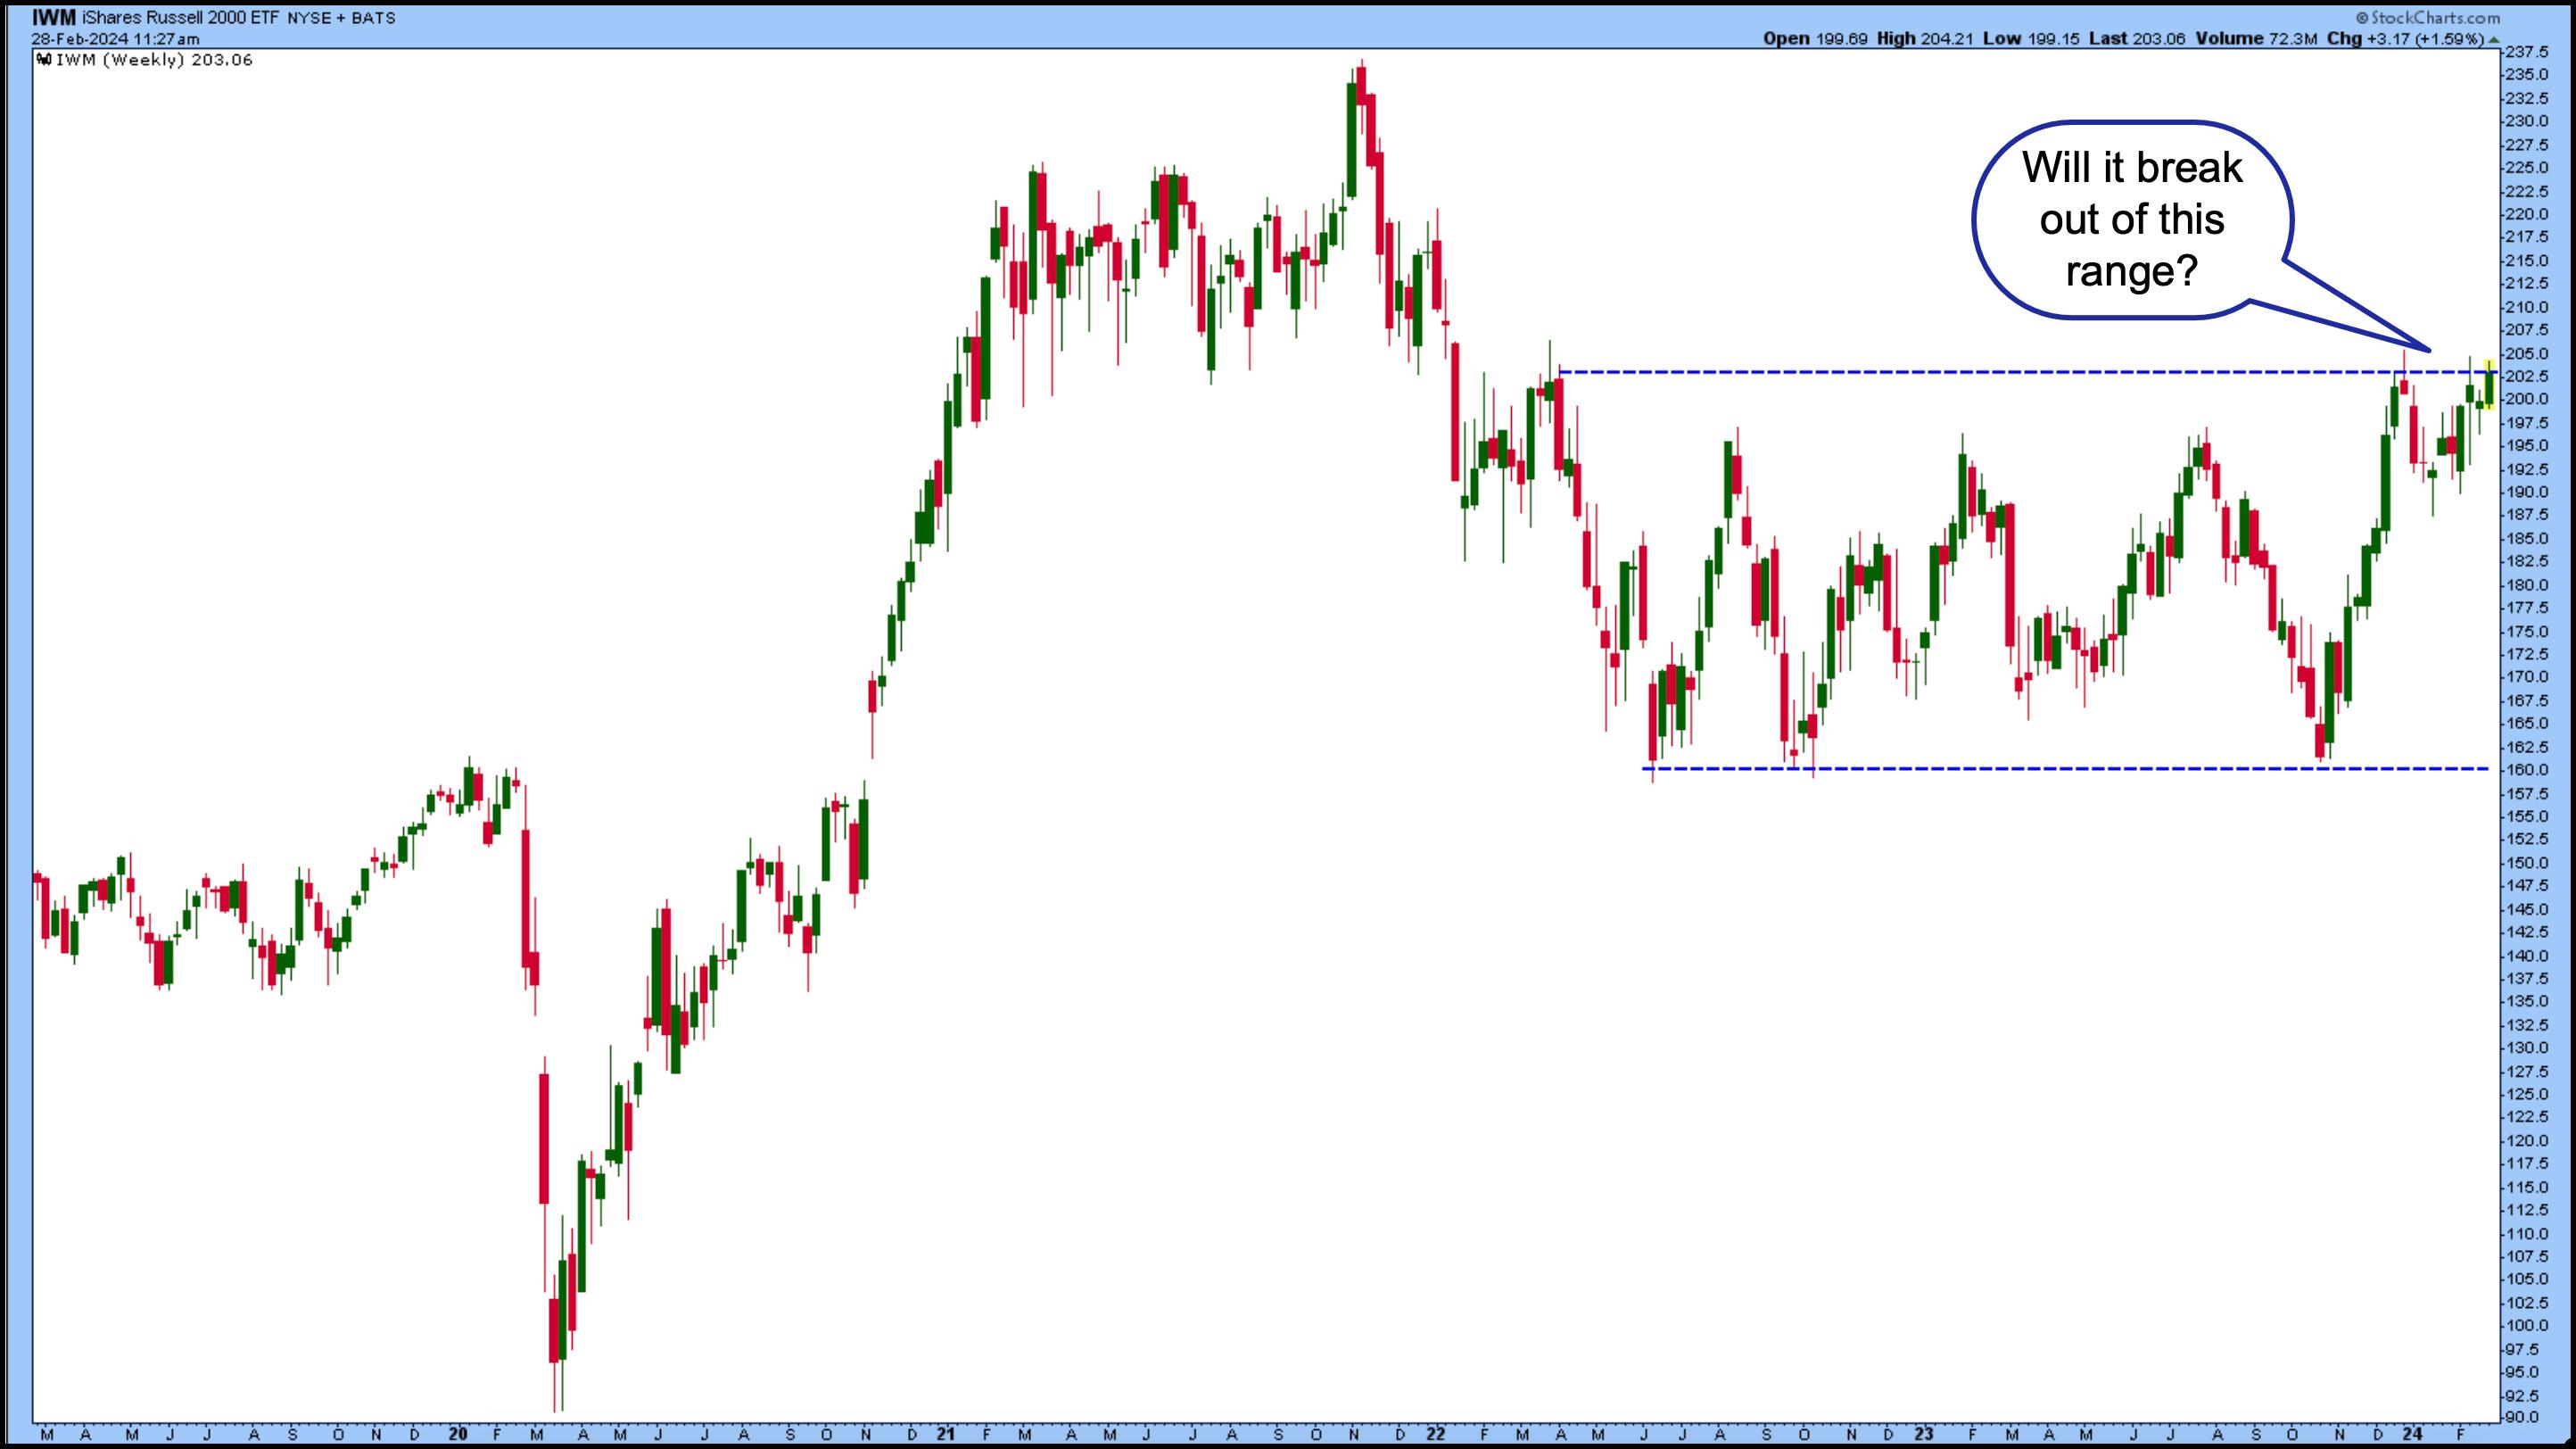
Chart 2. ISHARES RUSSELL 2000 ETF (IWM) is on the verge of breaking out of range. The big question is whether IWM will break out or retreat into its trading range. A lot will depend on when the Fed will cut interest rates.Chart source: StockCharts.com. For educational purposes.
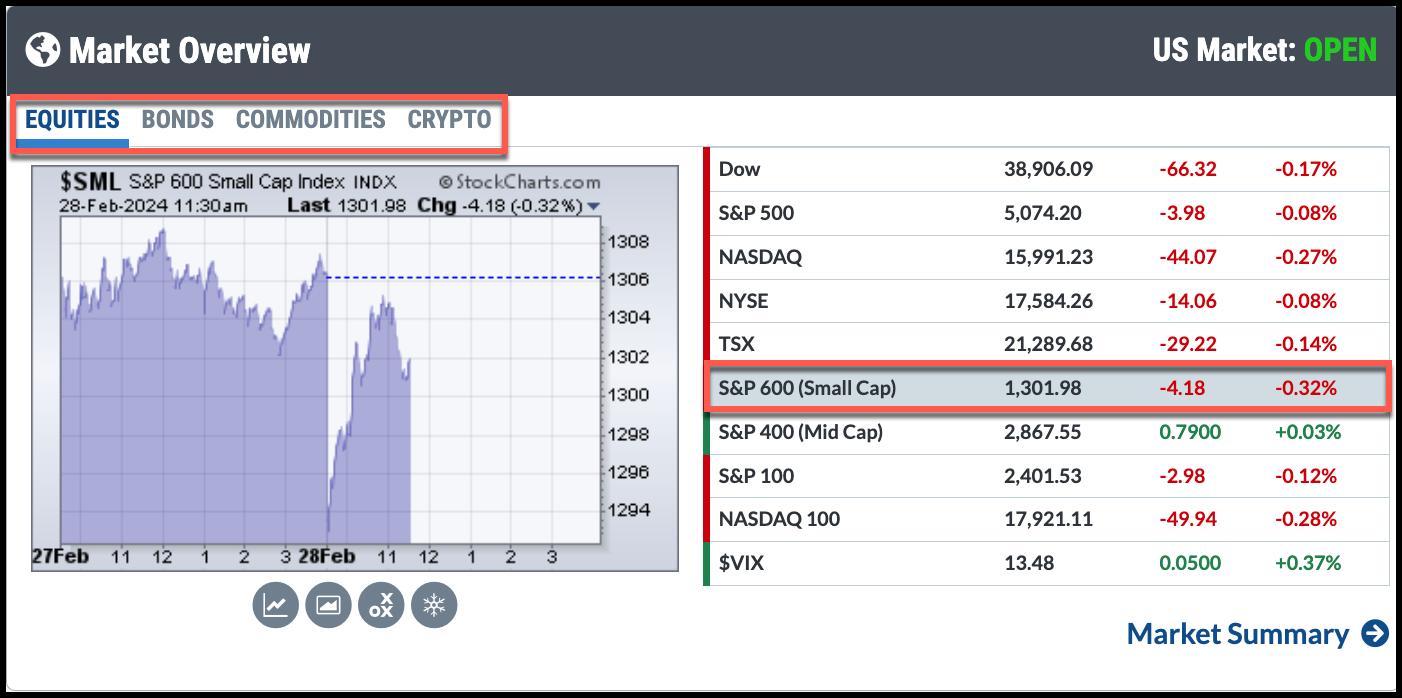
There is still a long way to go before reaching the November 2021 high. Monitor the S&P 600 Small Cap Index ($SML) in the StockCharts Market Overview panel (see below), as the Fed’s first interest rate cut could be a time for small-cap stocks to rally.

Great StockCharts tip.
To get an overview of the stock market, choose a different tab: Market Overview View the performance of the broader market through our panel (stocks, bonds, commodities, cryptocurrencies).
And don’t forget cryptocurrency
One area that is showing strength is cryptocurrency. Bitcoin ($BTCUSD) is showing strength this week. There is potential for a third straight day of big gains (see chart below). This surge has helped stocks like Coinbase (COIN), Marathon Digital (MARA), and Riot Platform (RIOT) rise. COIN and MARA broke 52-week highs today.
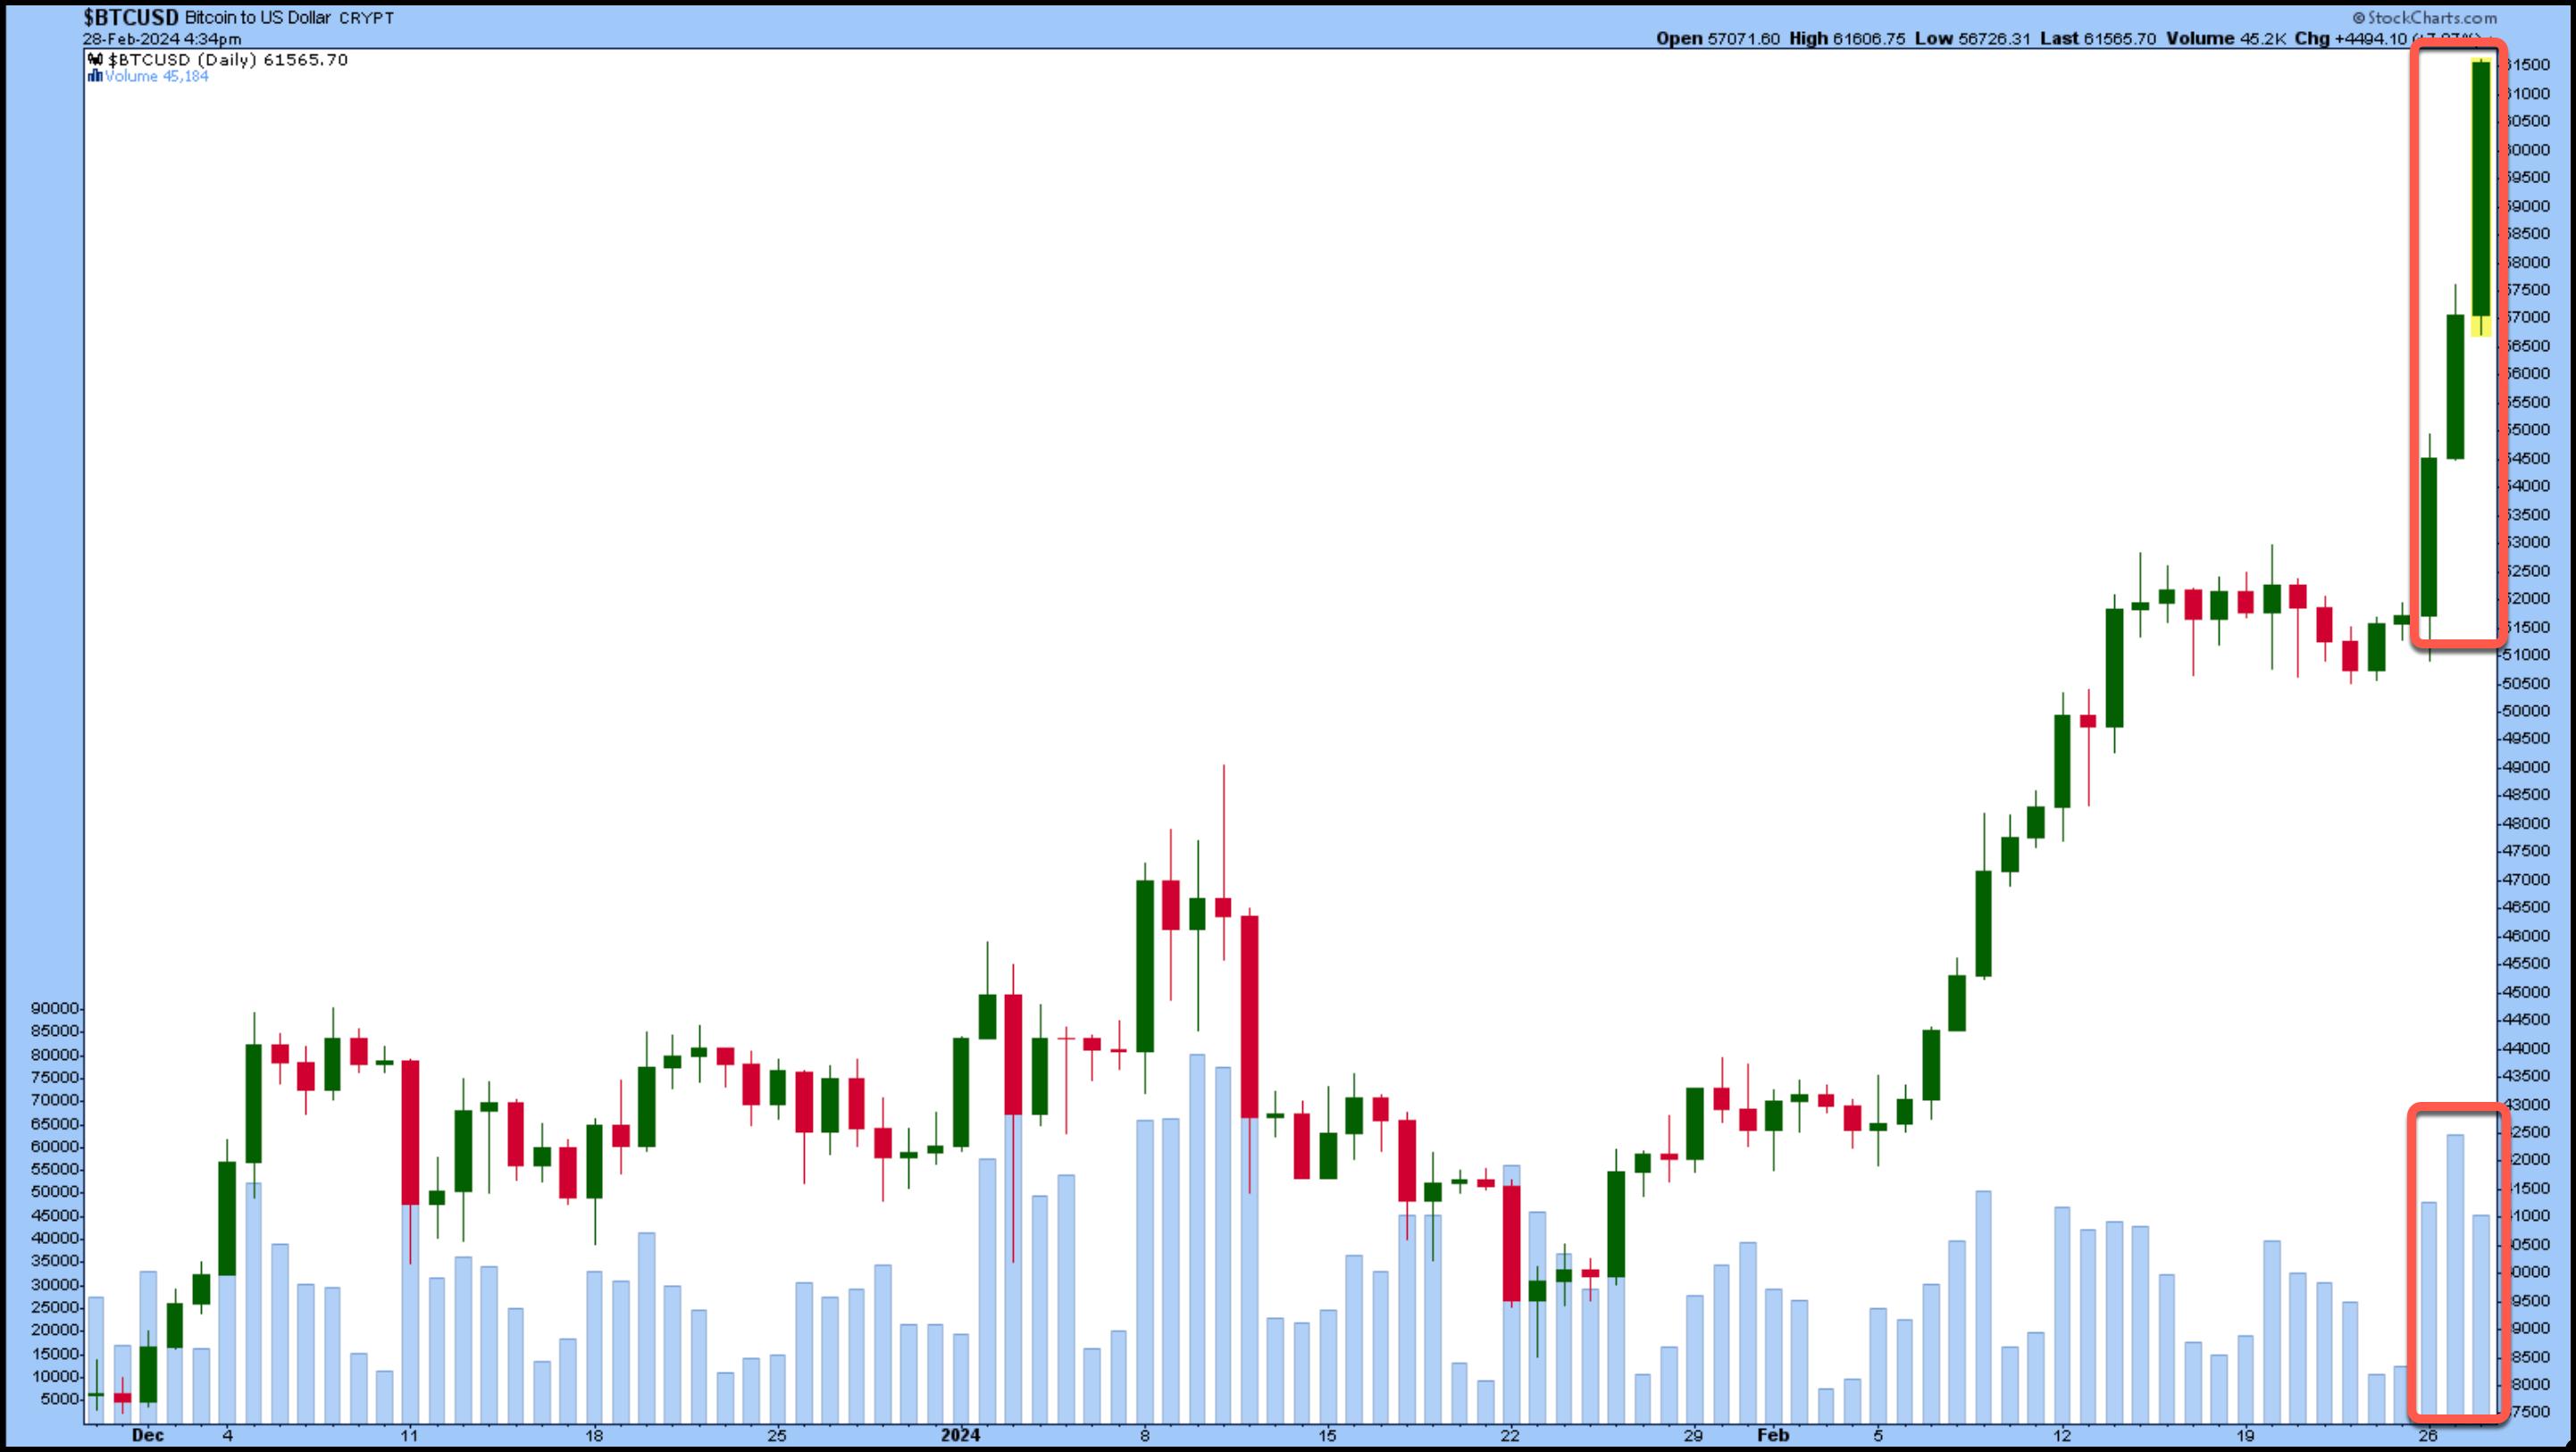
Chart 3. Bitcoin daily chart against the US dollar. Three days of strong gains with above-average trading volume show that the cryptocurrency is gaining momentum. It is not far from the all-time high of 69355.Chart source: StockCharts.com. For educational purposes.
conclusion
Now may not be the right time to be bearish on stocks, especially as they are rebounding due to the AI craze. The CBOE Volatility Index ($VIX) is still relatively low and there are no signs of investor concern. Thursday’s PCE data will probably give the market a reason to move up or down. Tomorrow morning (Thursday) at 8:30 AM EST. Pre-market trading should provide some clues.

disclaimer: This blog is for educational purposes only and should not be construed as financial advice. You should not use any of our ideas and strategies without first evaluating your personal and financial situation or consulting a financial professional.

Jayanthi Gopalakrishnan is the Director of Site Content at StockCharts.com. She spends her time creating content strategies, providing content to educate traders and investors, and finding ways to make technical analysis fun. Jayanthi was the Editor-in-Chief of T3 Custom, a content marketing agency for financial brands. Prior to that, she served as Technical Analysis Editor for Stocks & Commodities magazine for over 15 years. Learn more


