Nasdaq 100 index decline imminent | a cautious investor

key
gist
- The recent upward gap near $380 was a key moment for QQQ, but if major growth stocks continue to fall, this level could be called into question.
- While it is possible that the Nasdaq 100 could hit new all-time highs over the next six to eight weeks, overbought conditions for growth-leading companies make that highly unlikely.
- By thinking through four potential scenarios, from very bullish to very bearish, careful investors can better assess the odds and manage risk.
I think Friday’s session was significant in that the S&P 500 was up about 1% while the Nasdaq 100 was mostly flat. The top two sectors in Friday’s session were Real Estate and Industrials. What about the bottom two categories? The two best-performing sectors in 2023 will be none other than technology and communications services.
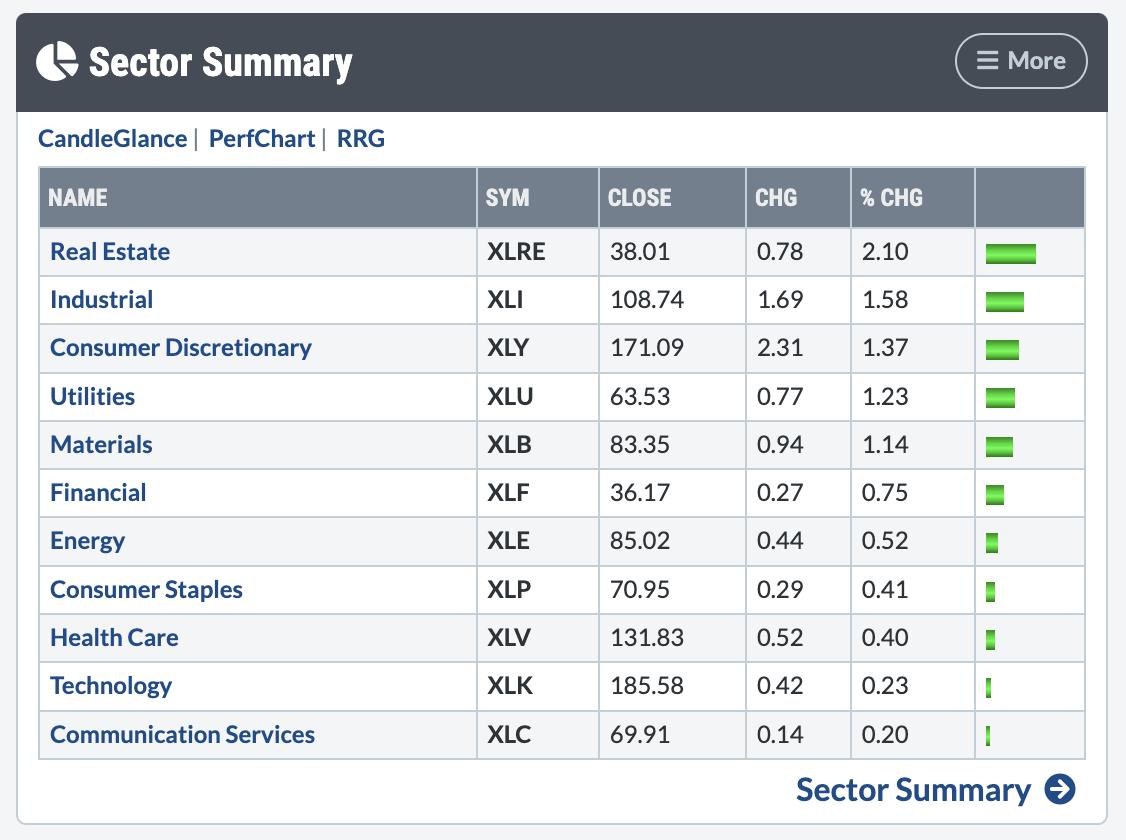
Certainly, small differences in returns suggest that growth leaders may be pulling back, while the value sector does not show the same extreme momentum conditions as before.
A number of large-cap growth stocks have recently become overbought and were testing resistance from summer highs. Charts like NFLX are perfect examples of these short-term bearish signals. Stocks that are rising quickly often need to take a break and reset before the uptrend can continue.

What could a decline in QQQ look like, and what does this mean heading into January 2024? And what are the different scenarios for growth stocks? I’ll present four potential outcomes for the Nasdaq 100 and share the estimated probabilities for each scenario.
And remember, the point of this exercise is three-fold.
- Consider all four potential future paths for the index, think about what could cause each scenario to unfold in terms of macro drivers, and examine which signals/patterns/indicators confirm the scenarios.
- Decide which scenario you think is most likely and why you think so. Don’t forget to leave me a comment and let me know your vote!
- Consider how each of the four scenarios would affect your current portfolio. How would you manage the risk in each case? When and how will you take steps to adapt to this new reality?
Let’s start with the most optimistic scenario, which sees all-time highs in January 2024.
Option 1: Highly optimistic scenario
The most optimistic scenario would mean that last week was a bit of an aberration, a brief respite in a year of growth dominance. Magnificent 7 stocks rose at the end of the year, pushing the Nasdaq 100 index to a record high in January. Is that just the beginning of a very optimistic 2024?
Considering the way stocks like GOOGL and NFLX have already fallen after showing signs of running out of upside, I don’t think this is a viable option. But it’s always good to think through a Goldilocks scenario. All you have to do is think about what signs might show that the odds are rising.
Dave’s vote: 10%
Option 2: Mildly bullish scenario
If you think growth stocks are emerging from overbought conditions and the recent pause in their gains could delay a further rebound early next year, this may be a better bet. A gap of about $380 higher since the October CPI than a few weeks ago seems like a reasonable downward bound for this slightly optimistic scenario.
This is actually my base case because the seasonal pattern suggests a strong November followed by a strong December. However, breadth indicators are also showing signs of the upside running out, and I wouldn’t be surprised if the downtrend continues into mid-December.
Dave’s vote percentage: 60%
Option 3: Bearish scenario
What happens if the gap mentioned above does not hold and the initial decline in Magificent 7 stock causes additional sellers who start fearing an even further decline? Downturns in upward trends can be sudden and confusing, and even if value stocks like industrials or financials rally, it’s still not enough to prevent growth-oriented benchmarks from falling.
Given the severity of the rally off the October lows, this could happen, and the price gap around $380 would be an important level to monitor. It’s hard not to see a chart like NFLX with a big double top right now!
Dave’s vote percentage: 25%
Option 4: Super bearish scenario
I always include very negative and highly unlikely scenarios. Because it helps to think about what risk factors may emerge to warn of further selling in the future. This could certainly happen if economic data in December gets hotter than expected, if the Federal Reserve emphasizes that further rate hikes are still on the table, or if the 10-year Treasury yield rises back to 5%.
Given the seasonal strength of December and how robust growth stocks are expected to rally, a decline below October’s lows seems very unlikely. But it’s best to think these options through before they actually happen!
Dave’s vote percentage: 5%

What probability would you assign to each of these four scenarios? We have two videos queued up to show you how each scenario plays out, and how to assign probabilities to each of the four options.
Begin by watching the following video, which outlines the four scenarios and how to run each scenario.
Then watch the following where we assign probabilities to each along with the factors that motivated the results.
RR#6,
dave
P.s Are you ready to upgrade your investment process? Check out our free behavioral investing course!
David Keller, CMT
Chief Market Strategist
StockCharts.com
disclaimer: This blog is for educational purposes only and should not be construed as financial advice. You should not use any of our ideas and strategies without first evaluating your personal and financial situation or consulting a financial professional.
The author had no positions in any securities mentioned at the time of publication. All opinions expressed herein are solely those of the author and do not in any way represent the views or opinions of any other person or entity.

David Keller, CMT, is Chief Market Strategist at StockCharts.com, where he helps investors minimize behavioral bias through technical analysis. He is a frequent host of StockCharts TV and links mindfulness techniques to investor decision-making on his blog, The Mindful Investor. David is also President and Chief Strategist at Sierra Alpha Research LLC, a boutique investment research firm focused on risk management through market awareness. He combines strengths in technical analysis, behavioral finance, and data visualization to identify investment opportunities and strengthen relationships between advisors and clients. Learn more
")


