Nvidia Stock: Strong Market Growth Enables It For 15% Annual Returns (NASDAQ:NVDA)
I-HWA CHENG/AFP via Getty Images![]()
Thesis
In my previous article, I assigned a fair price for NVIDIA Corporation (NASDAQ:NVDA) at $548.29 (which at the time reflected a 29.54% upside), and a future price of $1658.85. Since then, my estimates on fair price have materialized, and now the stock price is around $704.09, a 61.75% upside since my last article.
In this article, I will evaluate Nvidia in order to see if the stock is still undervalued entering the Q4 2024 earnings release on February 21.
After two discounted cash flow, or DCF, models, I arrived at an average fair price of $690.86 and a future price of $1348.76. The fair price indicates that Nvidia is trading close to its fair valuation, which means that the downside is very small, which in my opinion is an opportunity to enter and hope for a surprise in Q4 2024 earnings.
Seeking Alpha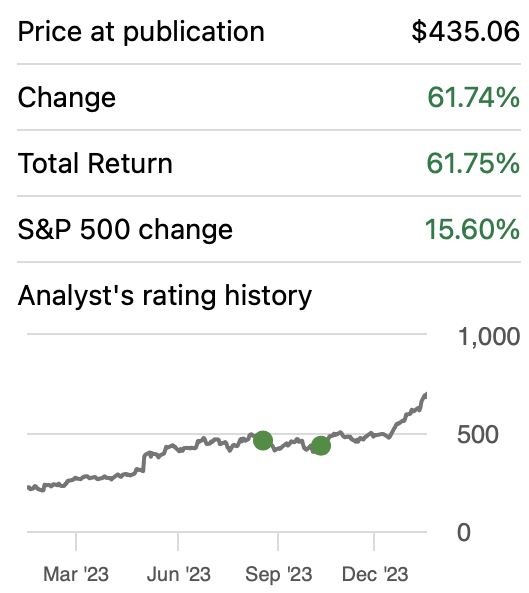
Overview
Q3 2024 Earnings
In Q3 2024 earnings, Nvidia crushed estimates. Nvidia delivered a quarterly EPS of $4.02 vs. the expected $3.37 (a difference of $1.6 billion when multiplied by total shares outstanding). Meanwhile the registered revenue was $18.12 billion vs the expected $16.18 billion. Then, concerning Q4 2024, Nvidia estimates a revenue of around $20 billion.
In my opinion, there was nothing special in this earnings report, since in my previous article I was estimating that the stock had an upside of around 29.54%, therefore, I was already suggesting a very decent potential return.
Regarding FY2024 earnings, you will see my estimates on the second valuation model, labeled as “My estimates.”
Nvidia Q3 2024 Segments Caption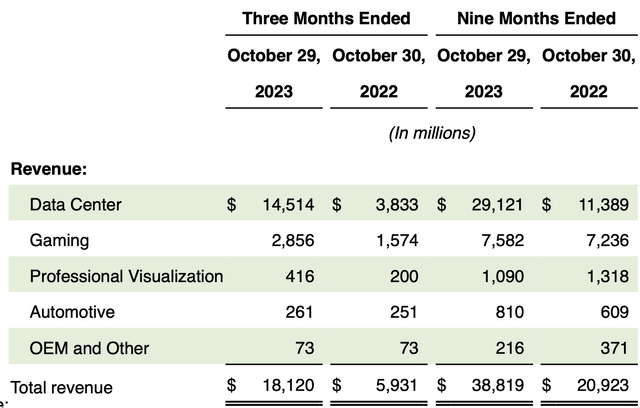
Market
The first, and most important market for Nvidia (for now) is the data center market, which has been responsible for the recent rally Nvidia stock has seen. This market is expected to grow at a CAGR of 6.56% throughout 2028.
Statista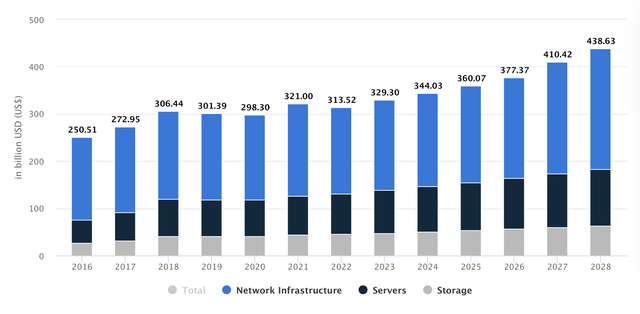
However, inside this market is the real gem, the “AI Market”, for which Nvidia sells its H100 & H200 GPUs. This market is expected to grow at CAGR of 17.30% from 2023 to 2030. However for the period 2022-2026, the spending on AI centric system is expected to grow at a CAGR of 27%.
Statista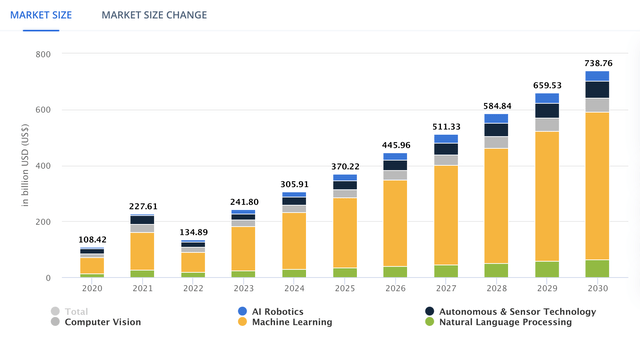
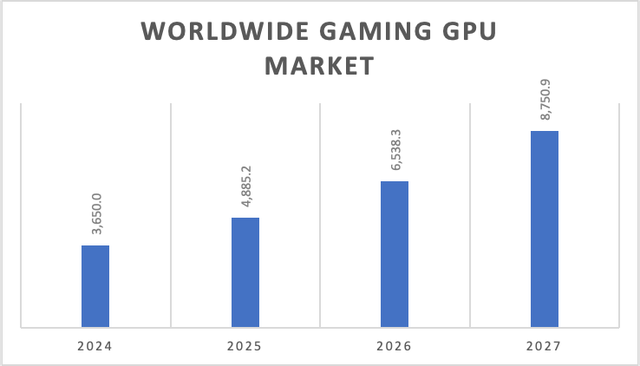
Then, it’s Nvidia’s gaming segment, which hidden gem is the cloud gaming service: GeForce Now. Some estimates suggest that GeForce Now generated around $1.4 billion in revenue in FY2023 (year 2022). This market is expected to grow at a CAGR of 44.09% from 2023 to 2027. Another segment of Nvidia’s gaming business is its GPUs business, which is estimated to grow at a CAGR of 33.8% throughout 2029.
Author’s Calculations with base on Statista Author’s Calculations with base on Mordor Intelligence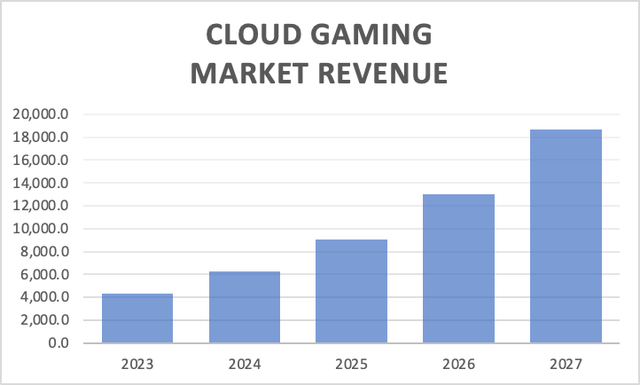
Next is Nvidia’s automotive business. The sale of new energy vehicles is expected to grow at a CAGR of 37% throughout 2025. Since each vehicle requires its own chips, this means that automotive semiconductor sales. can also grow at a CAGR of 37%.
Finally, the digital visualization market is expect to grow at a CAGR of 10.95% throughout 2029.
Financials
Nvidia’s revenue has been growing at a rate of 60.3% since 2018. Meanwhile, operating income has displayed a faster growth of 90.4%. Lastly, net income has grown by an incredible 86.7% annually.
Since my previous article, released in Q2 2023, revenue has grown by 37.29%, operating income by 90% and net income by 82.9%. This reflects a positive development in Nvidia’s income statement.
This improvement has reflected in margins. Operating income margin improved from 29.42% to 45.94%. Meanwhile, net income margin grew from 27.83% to 42.10%.
Author’s Calculations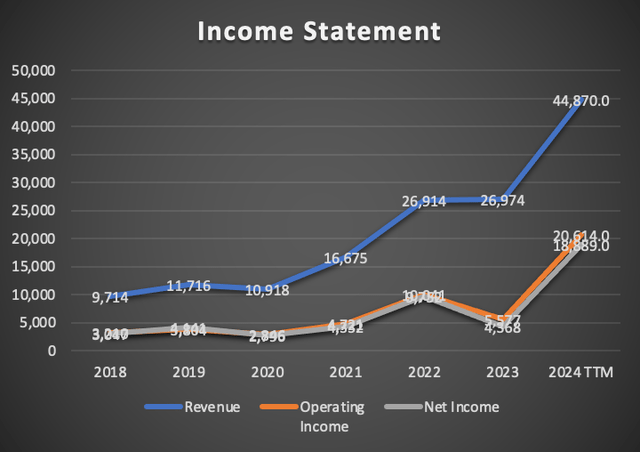
Author’s Calculations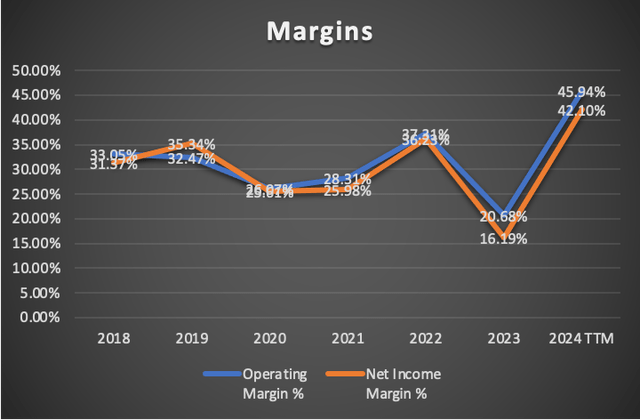
The Nvidia balance sheet, also improved, cash grew from $16.02 billion to $18.28 billion. Meanwhile debt displayed a slight upside/downside of 14.09%. Finally, examining the trends in 2021-2024TTM, short-term debt grew 9.6% annually, long-term debt by 7%, and cash reserves didn’t fall behind, since they were growing at 9.7% annually.
Author’s Calculations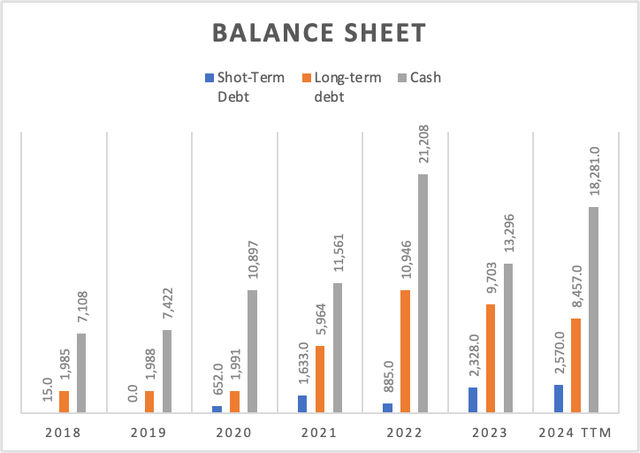
Lastly, free cash flow (“FCF”) has increased from $9.8 billion to $15.66 billion. This has been reflected in the FCF margin, which ticked up to 34.9% from Q2 2024’s 30%.
Author’s Calculations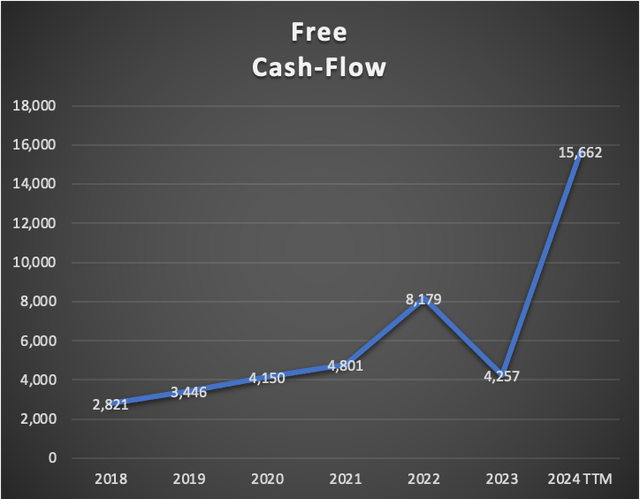
Author’s Calculations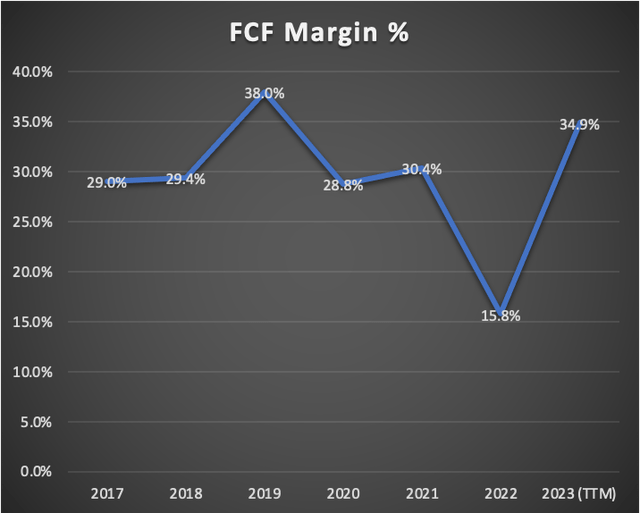
Author’s Calculations
Valuation
| TABLE OF ASSUMPTIONS | |
| (Current data) | |
| Assumptions Part 1 | |
| Equity Value | 33,265.00 |
| Debt Value | 11,027.00 |
| Cost of Debt | 2.34% |
| Tax Rate | 10.05% |
| 10y Treasury | 4.16% |
| Beta | 1.72 |
| Market Return | 10.50% |
| Cost of Equity | 15.06% |
| Assumptions Part 2 | |
| CapEx | 1,324.00 |
| Capex Margin | 2.95% |
| Net Income | 18,889.00 |
| Interest | 258.00 |
| Tax | 2,111.00 |
| D&A | 895.00 |
| EBITDA | 22,153.00 |
| D&A Margin | 1.99% |
| Interest Expense Margin | 0.57% |
| Revenue | 44,870.0 |
Analysts’ Estimates
In this first model, I will value Nvidia based on the available analysts’ estimates on Seeking Alpha. In the table above, you can observe all the current financial aspects that are necessary to calculate the WACC. You will also note that CapEx, D&A, and interest expenses will be calculated with a margin tied to revenue. The reason why this first model will be based on available estimates is because I will compare them to the second model based on available market trends in order to see how separate are both results from each other. Finally, I will calculate an average from all the results obtained from both models.
Commencing with EPS, the first thing you can observe is that for 2024, the estimates indicate an EPS of $12.31 (a net income of $30.35 billion), which means that Nvidia’s EPS will grow by 268.45% in a YoY basis. For 2025, analysts are expecting $20.70, which is a net income of $51.04 billion and a 68.17% YoY growth. You can see the whole table of EPS estimates below.
Seeking Alpha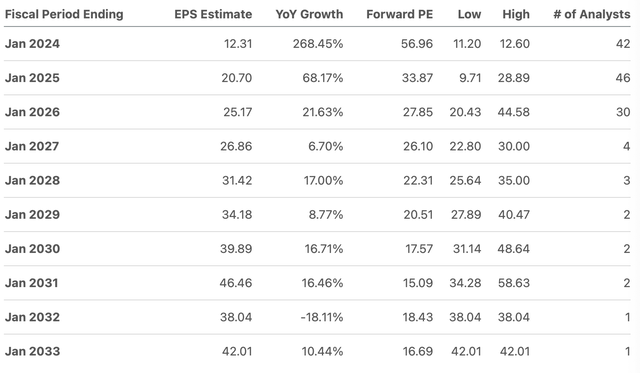
Nvidia’s revenue is also estimates to grow in the double-digits, with the exception of years 2027, 2032, and 2033. Starting with 2024, analysts are estimating a revenue of $58.93 billion, a 118.48% YoY growth. For 2025, the estimates indicate that Nvidia will generate $92.14 billion in revenue, a 56.34% YoY growth. Estimates go all the way up to 2033, which you can observe in the table below.
Seeking Alpha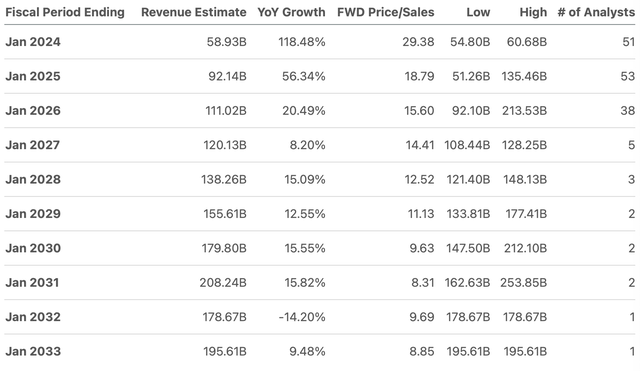
| Revenue | Net Income | Plus Taxes | Plus D&A | Plus Interest | Net Income Margin | |
| 2024 | $58,930.0 | $30,356.46 | $33,408.01 | $34,583.45 | $34,922.30 | 51.51% |
| 2025 | $92,140.0 | $51,046.20 | $56,177.56 | $57,353.01 | $57,691.85 | 55.40% |
| 2026 | $111,020.0 | $62,069.22 | $68,308.65 | $70,523.12 | $71,161.48 | 55.91% |
| 2027 | $120,130.0 | $66,236.76 | $72,895.13 | $75,291.31 | $75,982.05 | 55.14% |
| 2028 | $155,610.0 | $77,481.72 | $85,270.48 | $88,374.35 | $89,269.10 | 49.79% |
| 2029 | $179,800.0 | $84,287.88 | $92,760.82 | $96,347.20 | $97,381.04 | 46.88% |
| ^Final EBITA^ |
Before going to the results of the DCF model, I want to clarify that the future price of the stock in the year 2029 (FY2030) will be calculated using the un-discounted cash flows that you can see highlighted in green in the “discounting cash flows” part in the DCF model. Then with those cash flows I will get the equity value by assuming that throughout 2029 all the variables that conform equity will evolve at the pace displayed in the period 2021-2024TTM, marketable securities will grow at 9.7% rate, long-term debt will evolve at a 7% rate, meanwhile short-term debt will do the same but at a 9.6% rate. Lastly, current assets will grow at a 34.47% rate.
Author’s Calculations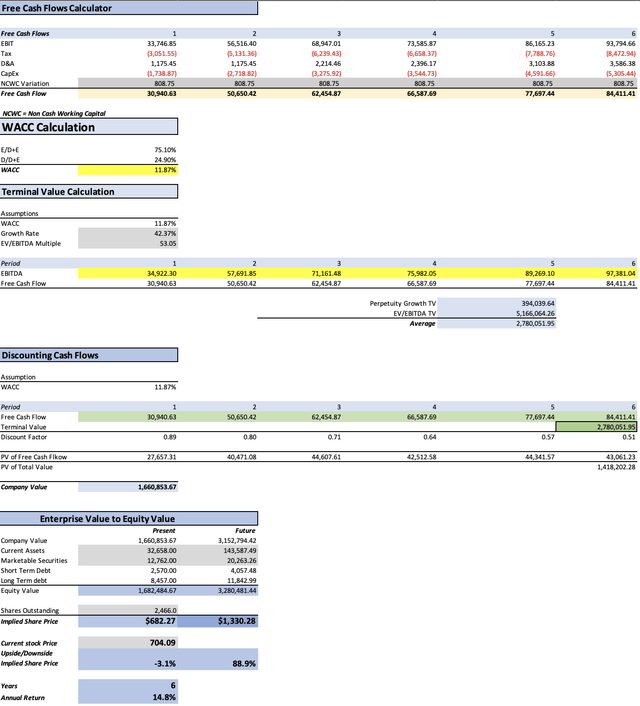
This preliminary model, suggests that Nvidia’s fair price is $682.27, which is a 3.1% downside from the current stock price of $704.09. The model also indicates that for 2029, the stock price should be around $1330.28, which translates into 14.8% annual returns.
My Estimates
In this second article, I will project each of Nvidia’s segment by their respective market CAGR, the same ones that were discussed in the overview section of this article. GeForce Now, as part of the Cloud gaming market will grow at a CAGR of 44.09%, meanwhile the sale of GPUs for gaming will grow at 33.8%.
The reason why I am setting Nvidia to grow at market performance is to see if it can still deliver returns under a more conservative scenario. Then I will be able to calculate an average from available analysts’ estimates and this second model. If Nvidia achieves better results in this second model, that would mean that Nvidia is not taking full advantage of its growth potential, if it’s the other way around, that would mean that Nvidia’s growth is more speculative.
| GeForce NOW | Sale of GPUs for Gaming | |
| FY 2024 | 2,017.26 | 10,258.45 |
| FY 2025 | 2,906.67 | 13,725.80 |
| FY 2026 | 4,188.22 | 18,365.12 |
| FY 2027 | 6,034.81 | 24,572.53 |
| FY 2028 | 8,695.55 | 32,878.05 |
| FY 2029 | 12,529.42 | 43,990.83 |
Data center will grow at a rate of 26.5% until 2027, then the growth rate will fall to 17.3%. Can Nvidia maintain that pace? Certainly, as more companies incorporate AI in their operations which even by 2030, is estimated to be 70%, not 100%, therefore there is still ample room for sustained double-digit growth. Professional visualization will grow at an annual pace of 10.95%. Then, automotive will grow at 37%,and finally, OEM will grow at the same pace as sales of GPUs, 33.8%. Finally, it’s important to clarify that I am doing a little trick with data center here, and it’s that the TTM revenue is $32.94 billion however since in a single quarter Nvidia’s data center business earned around $14.5 billion, I will be taking the 9 month revenue ending in October 29 of $29.12 billion and assume that in Q4 Nvidia will earn another $14.15 billion, this will put the FY2024 data center revenue at $43.63 billion.
| Data Center | Gaming | Professional Visualization | Automotive | OEM & Other | Total | |
| FY 2024 | 43,635.00 | 12,275.71 | 1,290.00 | 1,061.00 | 289.00 | 58,550.71 |
| FY 2025 | 55,198.28 | 16,632.47 | 1,431.26 | 1,453.57 | 386.68 | 75,102.25 |
| FY 2026 | 69,825.82 | 22,553.34 | 1,587.98 | 1,991.39 | 517.38 | 96,475.91 |
| FY 2027 | 88,329.66 | 30,607.34 | 1,761.86 | 2,728.21 | 692.26 | 124,119.32 |
| FY 2028 | 103,610.69 | 41,573.60 | 1,954.78 | 3,737.64 | 926.24 | 151,802.96 |
| FY 2029 | 121,535.34 | 56,520.25 | 2,168.83 | 5,120.57 | 1,239.31 | 186,584.30 |
Lastly, the net income margins I will use are those derived of analysts’ estimates model. This is because analysts’ estimates are the average of from the top and low estimates. Therefore, I will just limit myself to manipulate net income through revenue.
| Revenue | Net Income | Plus Taxes | Plus D&A | Plus Interest | |
| FY 2024 | $58,550.7 | $30,159.47 | $33,191.21 | $34,359.10 | $34,695.76 |
| FY 2025 | $75,102.3 | $41,606.65 | $45,789.11 | $46,956.99 | $47,293.65 |
| FY 2026 | $96,475.9 | $53,939.68 | $59,361.90 | $61,286.26 | $61,840.99 |
| FY 2027 | $124,119.3 | $68,439.39 | $75,319.18 | $77,794.93 | $78,508.61 |
| FY 2028 | $151,803.0 | $75,582.69 | $83,180.55 | $86,208.49 | $87,081.35 |
| FY 2029 | $186,584.3 | $87,470.72 | $96,263.61 | $99,985.32 | $101,058.17 |
| ^Final EBITA^ |
In the table below, you can see the EPS derived from my estimates are more conservative when compared to those of other analysts. Nevertheless for year 2027 and year 2029 my EPS estimates are more optimistic than the average consensus.
Author’s Calculations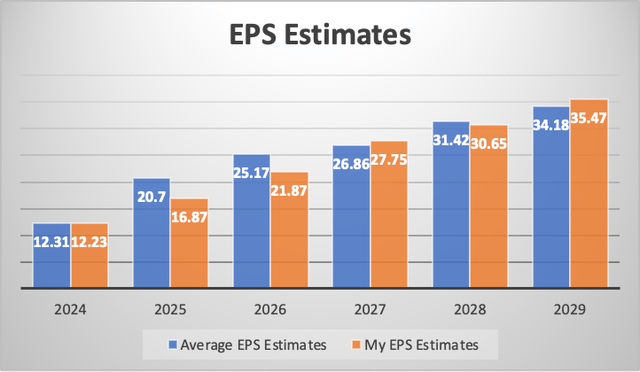
Author’s Calculations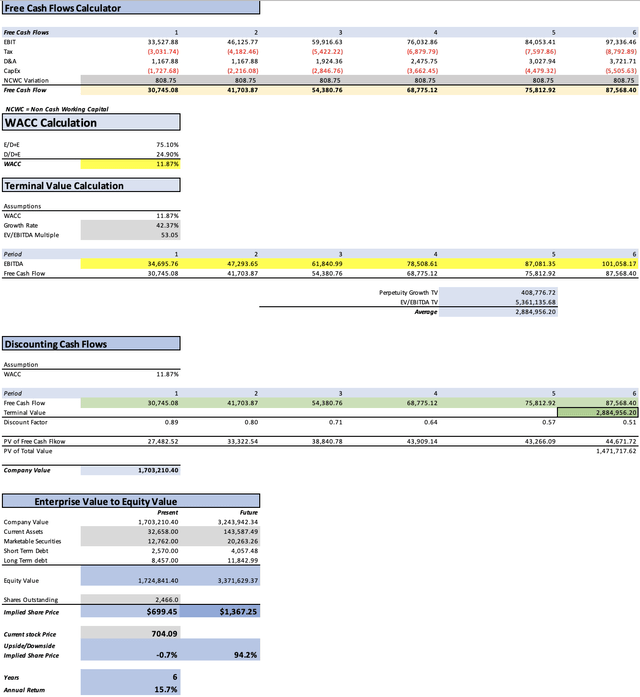
This final model yields a more optimistic result: a fair price of $699.45. This fair price means that the potential downside is reduced to 0.7%. Then, the future price suggested is $1367.25, which translates into annual returns of 15.7%, which is just slightly more than the 14.8% indicated by the previous model.
So what?
The average result from both models is a fair price of $690.86 and a future price of $1348.76, which indicates that the stock has a near-term downside of 1.91% and can deliver annual returns of around 15.19%.
In Q4 2023, AMD beat on earnings and revenue, and said that 2024 will be a strong year for data centers. Nevertheless the Q1 2024 forecast came below expectations, which caused the stock to decline. Taking this into account I can say that there is the possibility that Nvidia does not follow the same track and does beat earnings and meets Q1 2025 estimates. Which is why I will maintain my buy rating on Nvidia since the potential downside is very small and the company can surprise us at Q4 2024 earnings release.
Furthermore the stock can adjust when nearing to the end of the year, where 5 year models will undergo an adjustment by taking FY2024 and adding FY2031, this will increase the overall amount of cash flows in the model and consequently the fair price.
Risks
The main risk with Nvidia is the semiconductor cycle, it’s very unprovable that Nvidia will have 10 years of continuous expansion, actually, if you observe the table of revenue estimates in the first DCF model, you will see that there are years where growth slows down.
Second, estimates beyond 2026, are, in my opinion, very speculative since the num er of analysis suggesting those estimates is inferior to 10. That means that those estimates carry the risk of being adjusted.
Next, there is the risk of sentiment, since, from what I’ve observed, the majority of unfavorable ratings on Nvidia are from articles using multiple valuation, which of course will rate Nvidia as overvalued since Nvidia’s multiples are very high. This sensation that Nvidia is overvalued can cause the stock tank as soon as Nvidia misses earnings.
Finally, there is the risk of competition. AI GPUs & CPUs for data centers have proven to be a very lucrative market to enter, and this has caused prominent players such as Advanced Micro Devices, Inc. (AMD) to venture into this market. However I think that Nvidia and AMD will dominate the data center market in the same way AMD dominates the PC CPU market in a de facto duopoly with Intel Corporation (INTC). This is because being the first will ensure (at least in the medium-term) its dominance, since companies will prefer to stick with a manufacturer in order to save on costs, because for example, Nvidia’s GH200 is a CPU and a GPU combined in a super chip, therefore, in order to make a change, companies would need to buy a different CPU, a GPU and a different mother board. Nevertheless, Nvidia needs to stay competitive, if not, another competitor will eat its market share.
Conclusion
In conclusion, since my previous two calls on Nvidia, the stock has increased substantially. In those two previous articles, the stock was very undervalued, and the market realized that, which caused the stock to not be undervalued anymore.
In the two models I conducted in this article, the result was that Nvidia was slightly overvalued with my estimates indicating a fair price of $684.80 and a future price of $1341.82.
The potential downside is too small to be concerning, and the stock still has the surprise factor that Nvidia could deliver in Q4 2024 earnings. I am reiterating my buy rating on Nvidia Corporation.


