Price Action Trading Strategy – Analysis and Forecast – January 9, 2024

Did you know that price action trading strategies are one of the most commonly used methods in financial markets today? Whether you are a short-term or long-term trader, analyzing security prices is probably one of the simplest yet most powerful ways to gain an advantage in the markets.
After all, every single trading indicator in the world is derived from price, so it makes sense to actually study price, understand it, learn it, and use it in your trading. In this article, we’ll explain everything you need to know about price action trading, explaining what it is, why you should consider using it with Forex, and sharing four price action trading strategies that are suitable for both beginners and experienced traders.
What is Price Action?
The term ‘price action’ simply refers to the study of price movements of securities. Traders using price action trading strategies study past prices to identify clues about where the market may move next. The most commonly used price action indicator is the study of price bars, which provides details such as the market’s opening and closing prices, the highest and lowest price levels during a particular period.
Analyzing this information is the key to price action trading. In fact, when answering the question ‘What is price action?’, we can say that it is actually the study of the behavior of all buyers and sellers actively participating in a particular market. Therefore, analyzing what the rest of the market participants are doing can give traders a unique edge in their trading decisions.
The most commonly used price bars used as price action indicators are called candlesticks. Every trading platform in the world offers candlestick charts. This proves how popular price action trading is.
What is a Price Action Indicator?
As discussed above, we now know that price action is the study of the behavior of all buyers and sellers actively participating in a particular market. The most commonly used price action indicators are candlesticks. This is because it provides traders with useful information such as the opening and closing prices of the market and the highest and lowest price levels for a user-defined period. Let’s look at an example:
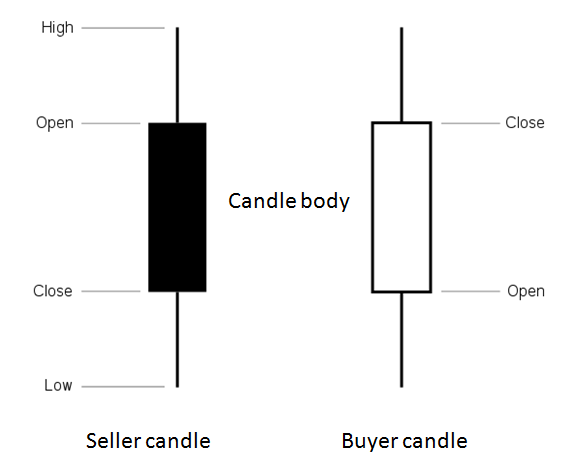
If you look at the daily chart of a security, the candles above represent trading volume throughout the day. Both candles provide useful information to traders.
- The high and low price levels tell you the highest and lowest prices for the trading day.
- A seller candle, shown with a black or sometimes red body, indicates that the seller has won the battle of the trading day. This is because the closing price is lower than the opening price.
- Buyer candles, shown with a white or sometimes green body, indicate that the buyer has won the trade. This is because the closing price is higher than the opening price.
Using this simple candle setup is one of the first steps to establishing a price action strategy. for example:
- If after the seller candle, if the next candle continues to hit new lows, it is a sign that sellers are willing to continue selling the market. This weakness causes some traders to initiate short (short) positions or maintain short positions they already have.
- If the next candle after the buyer’s candle continues to hit highs, it is a sign that the buyers are willing to continue buying the market. This strength leads some traders to initiate long (buy) positions or maintain long positions they already have.
This type of price action analysis is just one way to use candlesticks as price action indicators. However, the candles themselves often form patterns that can be used to form price action trading strategies. Before we look at these patterns, let’s first look at where they work best.
Subscribe to learn more about price action trading and other trading-related topics. Our Channels: t.me/Dollar_forex_ok


