Privia Health Stock: Key Lessons Learned (Rating Downgrade) (NASDAQ:PRVA)

Pgiam/iStock via Getty Images
Investment Summary
Since our last publication on Privia Health Group, Inc. (NASDAQ:PRVA), two things are true: 1) investors have not lifted the bid on the company’s stock price, and 2) our original investment thesis has not come to fruition. Shares are down 37% from the time of that previous report. An investment “post-mortem, if you will, is due for the benefit of our readers.
Firstly, it’s important to realise that any degree of speculation with an investment can lead to undesired outcomes. In that vein, my appraisal of PRVA in August last year made a few critical errors, now clearly viewable in hindsight.
Beforehand, I didn’t penalise PRVA for (1) hoarding cash on its balance sheet, and/or (2) the lack of potential reinvestment opportunities available for that cash. The reasoning for this decision at the time was simple: cash is not an operating asset for PRVA, and therefore it shouldn’t be included in this case, more so given most of the company’s capital is tied up in goodwill and intangibles.
This led to a substantial change in the amount of “capital” I viewed PRVA had employed in its business. PRVA’s balance sheet is sound, as we’ll see here today. But, with cash + cash equivalents currently at 48.2% of current assets, and 60.8% of net asset value – on reflection, it is unwise to exclude this from the calculus. Doing so leads to stark changes.
For instance, in the 12 months to June 2023 (when I had last reviewed PRVA), the company produced a return of 7.4% on invested capital of $537mm. However, when stripping cash out of the calculus for working capital, this return lifted to 18%, thanks to the denominator effects.
With 9 months passed since that publication, I have revisited the investment thesis, after closing our position in October last year, right when the broad market began to set forth on its latest rally.
Here I’ll discuss the following factors, to demonstrate why I believe PRVA is best observed opportunistically from the sidelines for now:
-
The company’s ability to grow earnings from incremental investments of capital into the business
-
Free cash flow produced by internal operations after all reinvestment requirements to maintain its competitive position are considered
-
Absence of what we call “economic profits”, despite accounting profits for the last 12-18 months
-
Valuations that likely require a large multiple contraction before the company is priced fairly relative to the assets and earnings of the business
This report will analyse these factors and greater detail, paying close attention to the investment facts pattern and objective truths in the matter.
Key investment facts impacting PRVA’s market value
1. Recovery of underlying assets
A heralded value of capitalism is its tendency to allocate capital efficiently, and reward companies that create economic value for their owners. The question is, what is economic value. Here I’ll discuss in relation to PRVA.
Critically, growth does not necessarily create value. A more thoughtful judgement of the investment required to engender that growth is important. That means analysing earnings in the context of 1) net tangible and intangible assets employed, plus 2) incremental returns. Thinking in first principles, corporations are a conduit between their investors (owners) and the assets operated by the business. Capital is used to purchase these underlying assets. All companies (and by extension, their owners) require a proper recovery of their underlying, including (i) capital, and (ii) return on capital.
Corporations unlock this risk capital (that is, create economic value) by earning a return on these assets above what investors could reasonably expect to earn elsewhere. In our way of thinking, this hurdle rate represents the long-term market return of the S&P 500 Index, typically ranging around 12%, depending on the starting period. If you were to benchmark a money manager, chances are you would probably do the same thing, by using the S&P 500 Index as the threshold margin. Why should corporate managers be treated any different?
In this regard, turning to Figure 2, you’ll note that PRVA has struggled to earn a decent rate of return on the capital invested in its business since its IPO in ’21. Even with recent earnings growth, management have deployed capital at a disadvantage, producing only $15mm of net operating profit after tax (“NOPAT”) on capital of $578mm in the 12 months to Q1 2024, a minuscule 2.6% return. As you’ll see, since 2021 this is a trend that has remained in situ.
Figure 2.
BIG Investments
It’s important to take a deeper look under the hood, though. What’s key, is that PRVA is producing huge revenue volumes relative to the capital employed in its business. The capital turnover line in Figure 2 above exhibits just that, showing the company produces around $2.90 in revenues for every $1 in capital invested in its operations.
I am a huge fan of high volume, low margin businesses. The problem here is, there isn’t enough post-tax margin to pick up the slack and drive a decent ROIC for the company. (note: post-tax margin = NOPAT margin). It hasn’t cracked more than 1.8% NOPAT margin in the testing period (TTM basis), and this simply isn’t enough down the P&L to get the company throwing off respectable sums of cash to shareholders.
So even with large revenue volumes, the lack of margin drags the actual value produced by the turnover.
2. Economic value
The company produced accounting profits of roughly $15mm after tax in the 12 months to Q1 2024. But economic profit – those returns above our hurdle rate of 12% – is completely absent.
Table 1.
Source: BIG Investments. For conceptual display, using PRVA’s actual figures.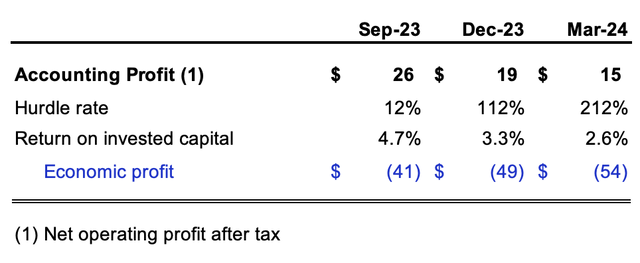
Figure 3 shows what PRVA needed to produce relative to the capital invested in its business in order to create value above our 12% hurdle rate. Anything above this figure is economically valuable, and vice versa.
As you can see, it has been a series of economic losses for the company over this entire testing period. In the trailing 12 months to March ’24, it needed to produce $69.4mm in NOPAT on capital of $578mm to see a 12% return for its owners. It did $15mm as mentioned. The opportunity cost of this result amounts to $54mm. This is the economic loss.
Figure 3.
Source: BIG Investments, company filings
Table 2.
Source: BIG Investments, company filings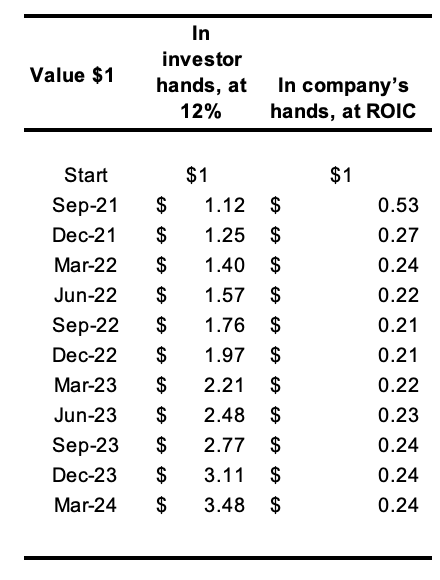
That’s why, despite 3-year sales growth of 27.3%, and strong YoY EBITDA growth, PRVA hasn’t actually created any shareholder value beyond what a reasonable investor could have achieved elsewhere by investing their $1 themselves (assuming they can receive 12% long term). Said differently, we estimate a hypothetical investor could have done better than PRVA management in investing $1 of capital from 2021 until now.
3. Management capital budgeting
We can get gauge management’s investment decisions and where the bulk of the firm’s capital is tied up in through the value drivers in Figure 4 below.
As seen, the company has grown sales at 6.4% per period from Q3 2020 to Q1 2024. At the same time, it has expanded pre-tax margin by 110 basis points.
The bulk of investment has been towards intangible assets including goodwill, followed by net working capital. This squares off with the economics of the business – the company’s revenues are primarily produced by software and medical services. Billing for these services requires a large commitment to receivables/payables because there are no inventories.
Over this testing period, each $1 of new revenues required a circa $0.13 investment to intangible assets, and a ~$0.05 investment to working capital to engender. By all means, these are not intensive numbers.
This is something that PRVA has going for it in my estimation. I said earlier that the company may be best on the sidelines opportunistically – and this is one of the reasons why.
Figure 4.
Source: BIG Investments, company filings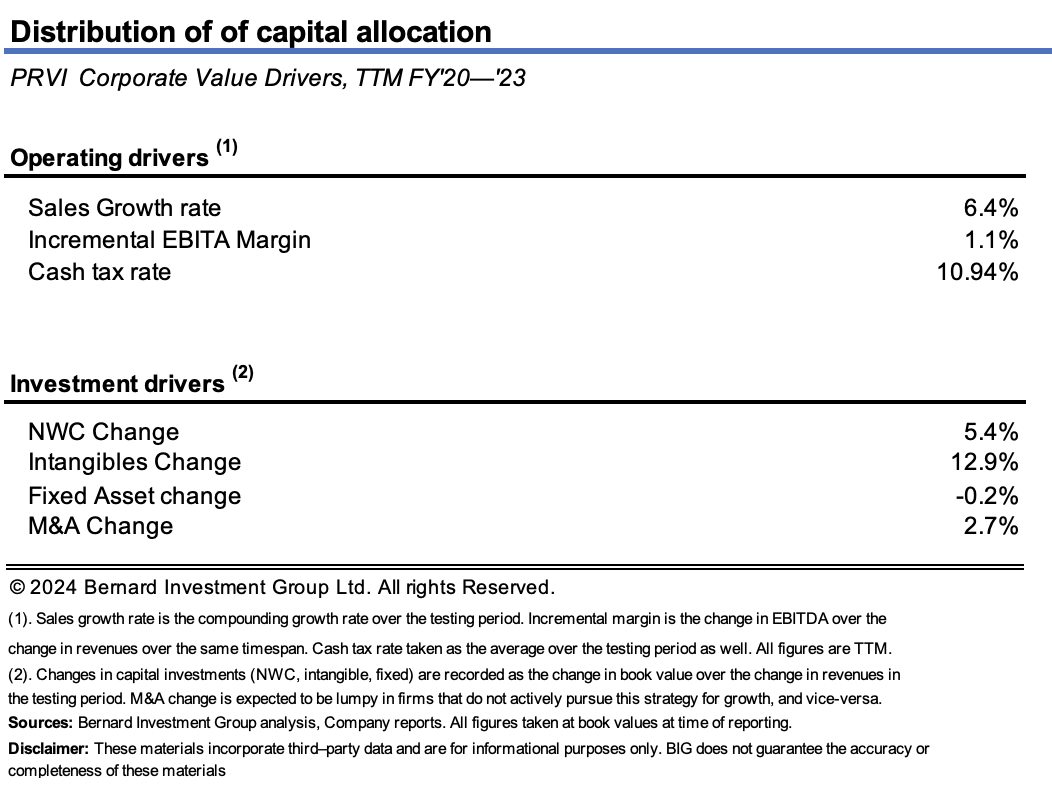
Aside from the return figure that has my eyebrows raised, it’s the fact the company has invested around 142% of its post-tax earnings over this time to achieve this result. PRVA has invested a huge sum of earnings at a return less than what investors could reasonably hope to achieve elsewhere (what we confidently estimate is the 12% hurdle). The result? PRVA has effectively eroded value despite growing sales and profits, and the market has priced its stock accordingly, in my view.
The issue isn’t so much the capital required by PRVA to grow. It is the outcome of these investment decisions up to this point.
This is the critical test of management competency, so the low ROIC scores suggest a lack of competitive advantage at this point in time. If it did have a competitive advantage, it would have shown extremely high returns and invested capital, above both 1) industry averages and 2) our threshold margin of 12%.
The full dossier of evidence to shareholders is observed in Figure 4 below. As seen, from Q3 2021 to Q1 2024, management employed an additional $0.90/share of capital into the business to maintain its competitive position and grow.
These investments have so far increased earnings by around $0.10 per share, otherwise an 11% marginal return on investments. PRVA has also thrown off $0.15 in free cash flow/share in the last 4 quarters of business (TTM figures), just 0.9% trailing FCF yield as I write.
Figure 4.
Source: BIG Investments
4. Relative valuations stretched
With the company still trading at 24x forward earnings and 80x forward EBIT, I have neutralised my view on any multiple growth on this name. Valuations are high, and the company’s stock price is showing signs of stress, continuing an extensive drawdown that’s lasted more than 12 months now.
In addition, investors aren’t paying the higher prices of years gone by for “growth “type entities; instead searching for factors such as yield and quality (I talked about this in my recent Evolent Health analysis). We have maintained a defensive tilt on all of our risk portfolios as a result, with tactical rotations into commodities, industrials and credit. Long equity duration names such as PRVA do not sit within this profile.
You’ve also got the company priced at more than 3x book value, with a trailing return on equity of 3.44%. If paying the 3x, this reduces the investor ROE to just 1%. In terms of a price/value matrix, where “price” is the 3x book multiple, and “value” is the return received on those net assets, this is not an attractive calculus.
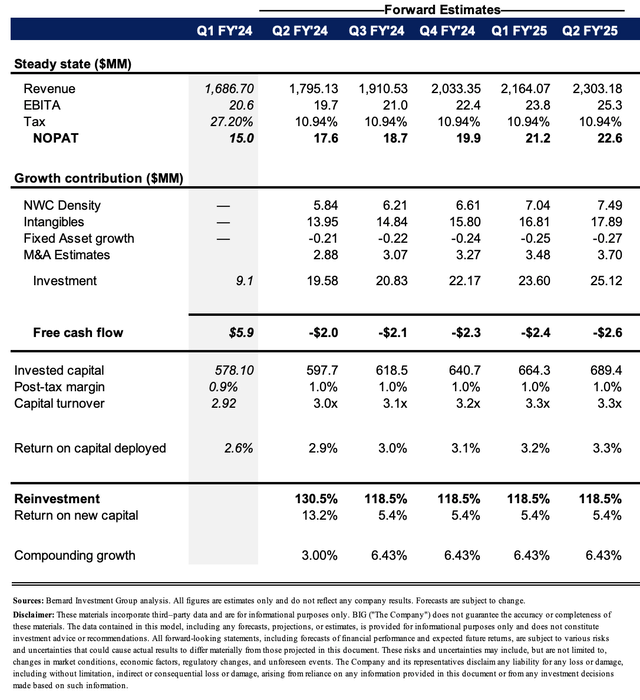
At the industry EV/EBIT multiple of 16.3x, for PRVA to justify its current market value of around $2Bn, it would need to throw off $122.8mm in pre-tax earnings this year (16.3×122.8 = $2,002). At its current multiple of 80.6x, the market is projecting $24.8mm this year, illustrating an enormous gap and expectations. Moreover, my analysis has the company to hit around $25.3mm in pre-tax earnings this year. To do that, I estimate it with me to invest around $25.1m to grow earnings to this amount.
| Current multiple | 80.8x |
|
Market-implied EBIT ($MM) |
$24.8 |
| Sector multiple | 16.3x |
| Implied EBIT ($MM) | $122.8 |
| Dislocation | 390% |
If it were to do that, the company would be reinvesting more than 118% of its pre-tax earnings and therefore will require cash externally from shareholders/creditors at some point into the future.
What does this look like in terms of a valuation? My assumptions for the company’s forward estimates are shown in the figure below (see: Appendix 1 for estimates). Here, I project free cash flows out 10 years based on the company’s current “steady state “, where it continues along the same growth lines as the last 2 to 3 years. I then add some assumptions that link to consensus growth rates on revenues.
Figure 5.
Source: BIG estimates
Secondly, I look at how the company would grow its valuation at the function of its incremental return or invest capital and how much it reinvests at these rates (valuation growth = ROIC x Reinvestment rate).
In the first instance, I get to a valuation of $2.16 per share, discounting the company’s projected free cash flows out 10 years and a continuing value into perpetuity. This isn’t surprising, given that over the forecast period I don’t see the company turning free cash flow positive, and therefore the bulk of the valuation is seen in the continuing value period, i.e. after 10 years. This is statistically non-relevant, and adds to my flat sentiment on the company.
Compounding the firm’s intrinsic valuation by the function of estimated ROIC and reinvestment rates, I get to a valuation of $23.77, using the same 12% discount rate. This is performed over a 10-year period as well.
Notably, these are fairly reasonable assumptions to work with going forward: including 1) a 6.5% per quarter compounding revenue gross rate, and 2) around $0.20 on the dollar of investment to produce an additional $1 in sales.
The key drag to PRVA’s valuation performance here is the company’s tremendously thin post tax margins. If the company weren’t to increase its margin to just 5%, the implied intrinsic value lifts to $33 per share, more than 95% value gap as I write. In other words, I would look to PRVA’s post-tax margins very closely over the coming 6 to 12 months to observe any upside movement there. This would be a key upside risk to my investment thesis, and something I am certainly opportunistic on if it presents itself.
In short
Based on the extensive analysis of PRVA management’s capital budgeting decisions, my estimate is the company has a way to go before it starts to unlock serious shareholder value. Whilst revenue growth rates are commendable, this is shadowed by the fact that substantial investments of capital have been committed to this growth, making it far less attractive.
Further, despite an impressive ratio of sales to capital employed in the business, producing around $2.90 in revenues per $1 invested capital, this is compressed by the company’s tremendously thin after tax margins, which weigh in heavily on its business returns.
As a result, I would look immediately to any upside movement in the company’s operating margins as an indication of a potential change in the story. However, as it stands, my numbers have the company sitting in a relatively stagnant position, in the context of generating additional profits on its invested capital. This is explicitly how we invest, and the tenets we use to filter our investment universe. A valuation of $23.84 per share seems therefore appropriate for the company based on this analysis.
Whilst this offers some degree of upside potential, I do not feel this is enough flesh to put on the skeleton when discounting all the risk involved. Net-net, revise to hold.
Appendix 1.
Source: BIG estimates, 5-periods out