Road to new all-time highs?

According to on-chain data, Ethereum has successfully found a bounce from key support areas, which is a positive sign for the asset exploring higher levels.
Ethereum recently re-tested the area for strong on-chain support.
In terms of on-chain analysis, the likelihood that a particular price range will act as support or resistance depends on the total number of investors who have purchased coins within that price range.
The reason is that holders are more likely to react whenever the price retests the cost basis or acquisition price. This is obviously an important level because it can turn a profit-loss situation around.
A single holder making such a reaction would obviously have no effect on the market, but if multiple investors share a cost base within a narrow range, a range retest of an asset could probably cause a significant reaction.
Therefore, the more concentrated an investor is within a particular range, the greater the ability of that range to act as resistance/support. Analyst Ali recently shared this chart on X. post This shows what the various Ethereum price ranges look like depending on the amount of addresses acquiring the coin at the time of posting.
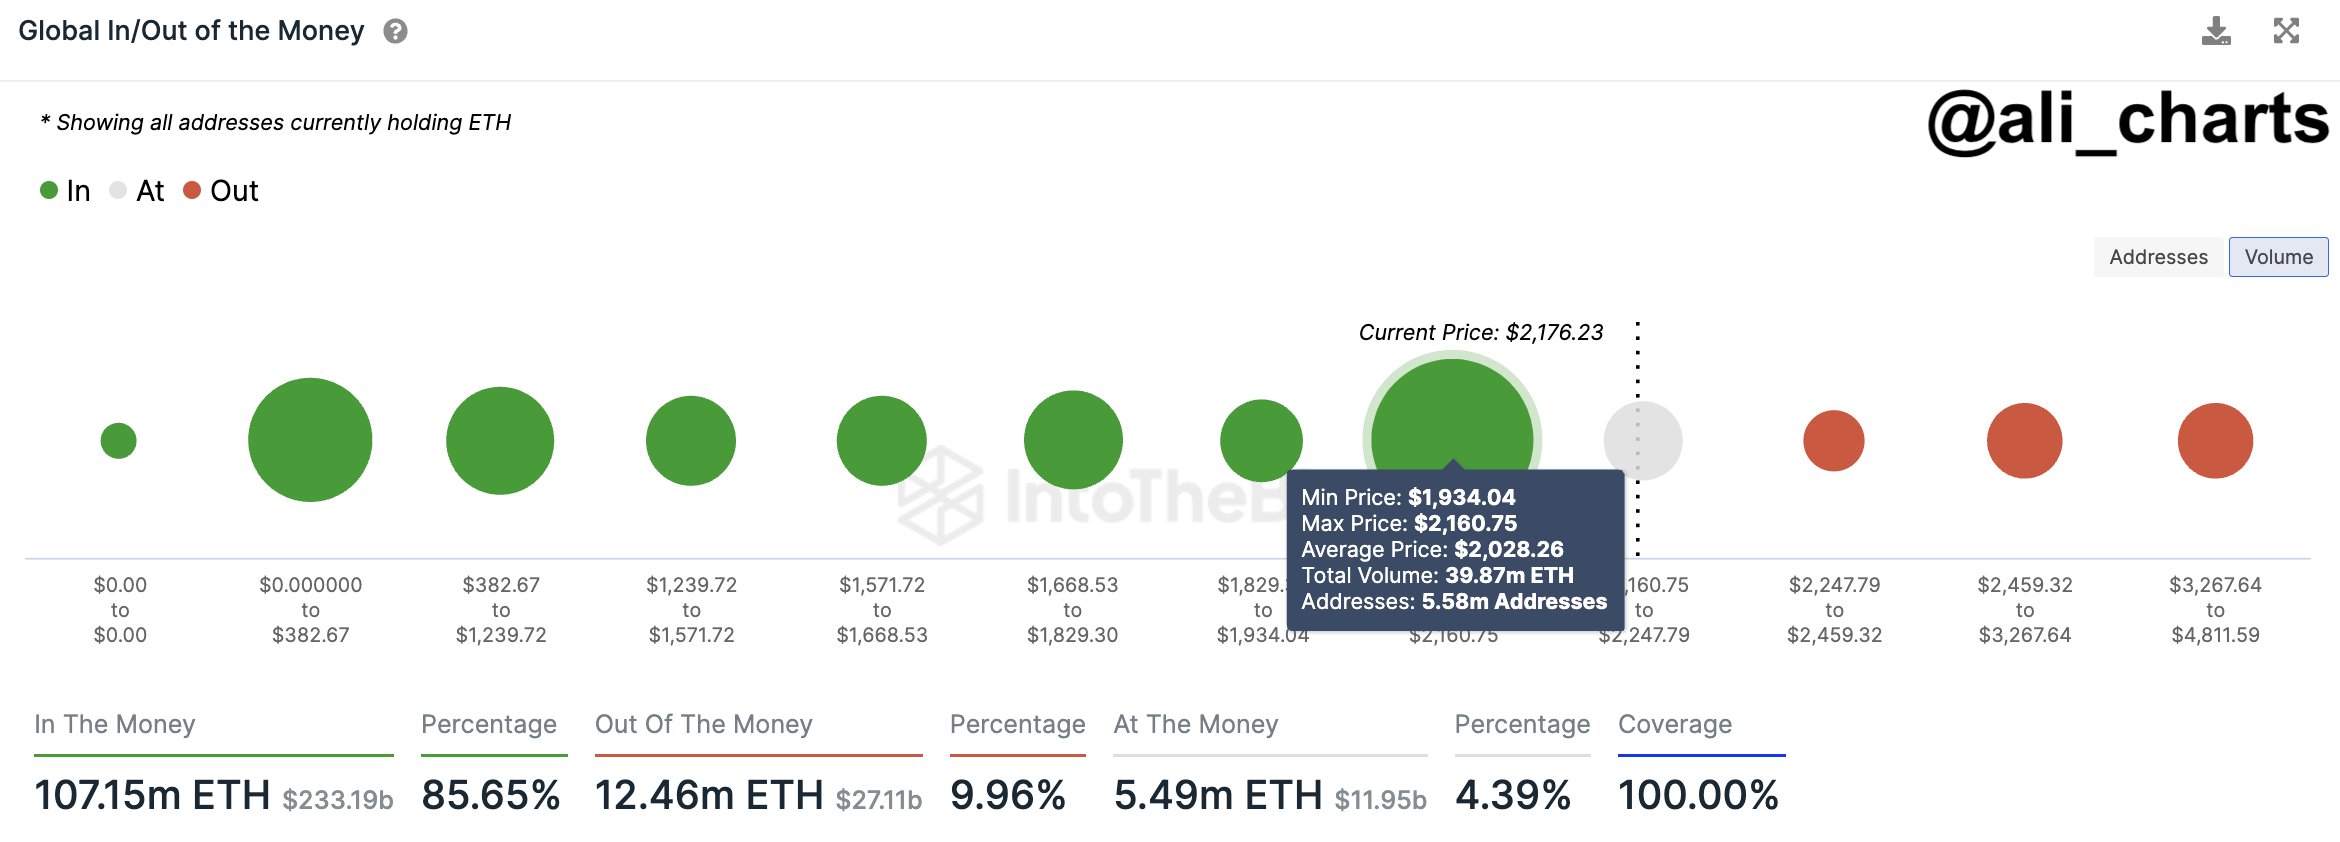
The various on-chain support and resistance levels | Source: @ali_charts on X
Looking at the graph, it is clear that the $1,934 to $2,160 range is the Ethereum hosting cost basis for the most addresses. At the time Ali made his post, Ethereum was testing this range again.
Now that there are so many investors in this range, testing it again is likely to see some reaction in the ETH price. But what will the reaction be: support or resistance?
What determines this is the direction in which the price is retested. If the retest came from above, i.e. these investors made profits right before the retest, the market could feel some support.
This is because the holder may decide to engage in some accumulation, thinking that the same price range may become profitable again in the future.
Likewise, a retest below could lead to resistance for Ethereum as investors fear the asset falling once again, making selling more likely.
Therefore, with a cost basis of 5.85 million addresses, this huge range should have acted as support for Ethereum in the recent retest. And indeed, after the retest, the asset managed to bounce back, soaring towards higher levels.
As you can see from the chart, the range to the asset’s all-time highs is all relatively thin for investors. This means that ETH should not have too much trouble passing these levels, at least in theory, thanks to the large support base below.
ETH price
After finding a bounce from the support range, Ethereum rose to the $2,300 level.
Looks like ETH has been going up during the last couple of days | Source: ETHUSD on TradingView
Featured image by Bastian Riccardi on Unsplash.com, chart by TradingView.com, IntoTheBlock.com
Disclaimer: This article is provided for educational purposes only. This does not represent NewsBTC’s opinion on whether to buy, sell or hold any investment, and of course investing carries risks. We recommend that you do your own research before making any investment decisions. Your use of the information provided on this website is entirely at your own risk.


