Semiconductor Prices Fall: Is Now the Time to Buy SMH?


Nvidia (NVDA) was probably the most notable semiconductor deal of 2024. Some may have missed it, but there are still plenty of opportunities to participate.
But it’s also wise to look for diversified alternatives, and one trade that presents a potential opportunity for that purpose is the VanEck Vectors Semiconductor ETF (SMH).
Why should you consider investing in SMH?
SMH has outperformed the S&P 500 ($SPX) over the past 10 years. It is deeply diversified across the cyclical semiconductor sector, with exposure to top-quality chip stocks as well as cutting-edge stocks in the AI industry.
SMH: Four Ways to Look at It
SMH underperformed the measured move of the double top reversal.. Does this indicate a threat of further declines, or an opportunity to buy the bounce?
The fundamental bias is bullish on long-term technology and AI demand. The technical bias is also bullish, and we are looking for support areas for potential buys.
Here are four ways to look at it:
1—SMH: Analyst Price Targets for 2025
Here are the analyst target prices for SMH for 2025 based on multiple valuation sites: (Click here to see this ACP chart.)).
High estimate
- $451.50
- $380.60
Average Estimate
- $357.32
- $300.68
low estimate
- $263.14
- $227.98
2—SMH: Simple Moving Average and Support
If you look at the chart below,SMH passed both 50 and 100 days. Simple Moving Average (SMA). If you read the price action from a swing trader’s perspective, those who took a short position at the bottom of the double top formation most likely liquidated their positions when they reached 100% of the movement measured near the 100-day SMA. That would probably explain the bounce.

Chart 1. Daily chart of SMH. The 50, 100, and 200 day simple moving averages are still in “full sale” condition.
However, if you look at the last 4 candles, you can see that the candle on July 30, 2024 broke the bottom of the last swing low (3 before the session). This tells you that the shorter-term swing low or the 100-day SMA will not act as a reliable support level.
Chaikin Money Flow (CMF) It tells us that selling pressure is dominant. Relative Strength Index (RSI) Also, the current move suggests that it may be falling into “oversold” territory. Could this be indicative of a potential bounce? If so, should we wait until SMH approaches the 200-day SMA to see a strong reversal candle and a change in momentum?
3—SMH: Ichimoku Cloud and Volume by Price
If you look at the chart below,that Ichimoku Cloud I was expecting a thickening bullish support range, but it now looks like it’s turning red. In addition, the price broke through the cloud bottom, which suggests weakness.
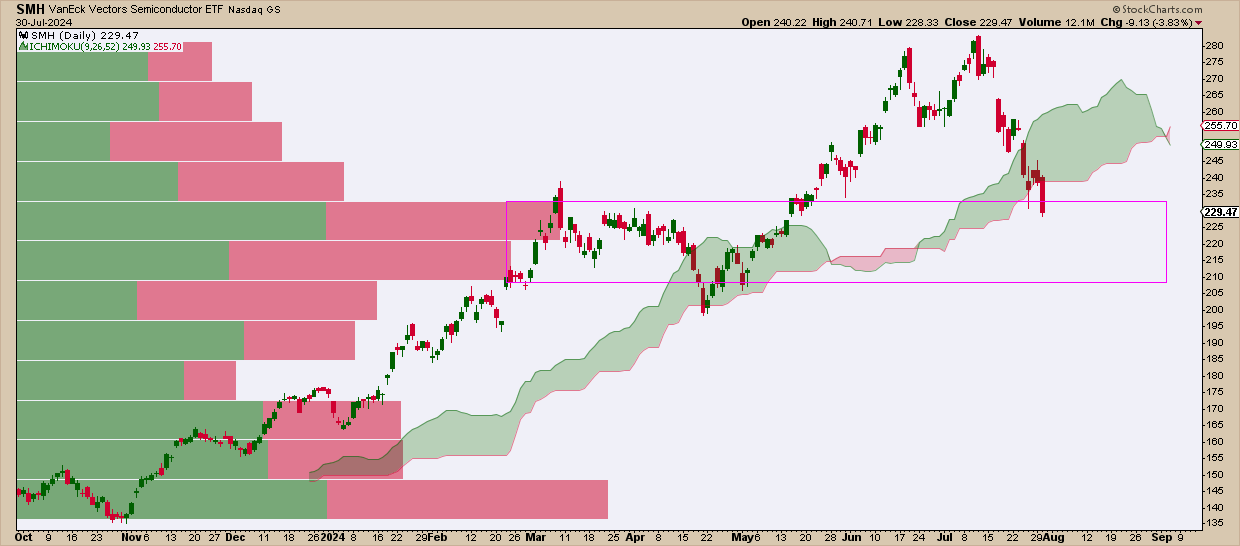
Chart 2. Daily chart of SMH and ICHIMOKU CLOUD and volume by price. This better shows potential support ranges.
However, since clouds are shown to represent a range, this scenario is somewhat mitigated by volume by price. The indicator also provides a way to see potential support (and resistance) zones through areas of strong concentrated market activity. According to this, SMH has just entered a strong previous market activity zone. It remains to be seen whether there will be a reversal within this range or a more contentious and congested back and forth as bulls and bears try to find their bearings. A break below this range could become a resistance level and suggest further declines.
Finally, it is a good idea to look at price action from another angle that allows you to judge a more specific level.
4—SMH: Short-term vs. Long-term Fibonacci Corrections
Chart Shows two sets Fibonacci correction: Long term Fibonacci from November 2023 low to July 2024 high, and short term Fibonacci from April 2024 high to July 2024 high.
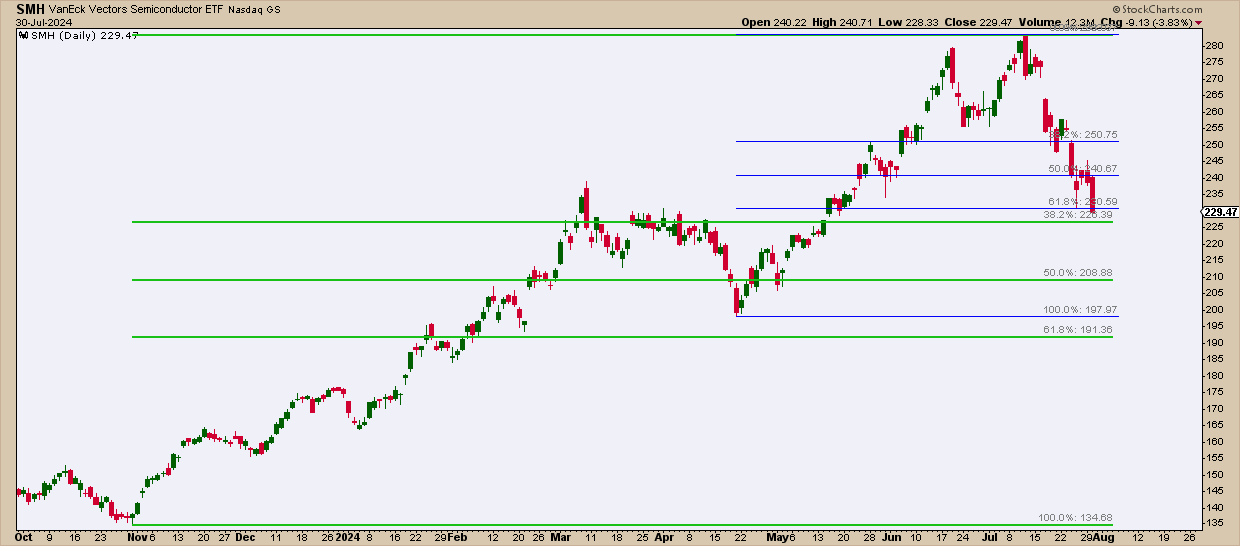
Chart 3. Daily chart from SMH: Compare short and long term Fibonacci corrections. Both highlight a single actionable zone that matches the chart above.
Based on these levels, we make educated guesses about the behavior.

- Short-term bulls attempted to enter at $230 as this coincides with the short-term 61.8% retracement level (probably a favorable low entry point).
- The $230 price level also coincides with the long-term Fibonacci 38.2%, which is an early buy point for long-term traders looking to buy long positions.
- If the price fails to stay above $230, short-term traders may liquidate their positions, as this would render short-term trading pointless.
- However, those with a long-term perspective would probably start buying at $210, which is the long-term 50% Fibonacci level.
- $200 is a key support level, coinciding with the April swing low. A break below this level would challenge the bullish outlook, despite the 61.8% Fibonacci level traditionally being a valid entry point below this price.
At last
The VanEck Vectors Semiconductor ETF (SMH) offers an attractive opportunity for long positions. Despite recent technical difficulties, the fundamentals remain bullish due to strong long-term demand for technology and AI. Moreover, analyst price targets for 2025 are bullish. However, there are certain price levels that could invalidate such bullish thesis. The bullish opportunities presented by SMH are at vulnerable times, so watch those levels.
disclaimer: This blog is intended for educational purposes only and should not be construed as financial advice. The ideas and strategies should not be used without first evaluating your personal and financial situation or consulting a financial professional.

")

")