Speculator’s Diary, Item No. 14 (August 12, 2023). Yield 21,887%. – Analysis and Forecast – March 9, 2024

Trade XAU/USD. Yield 21’887,33%.
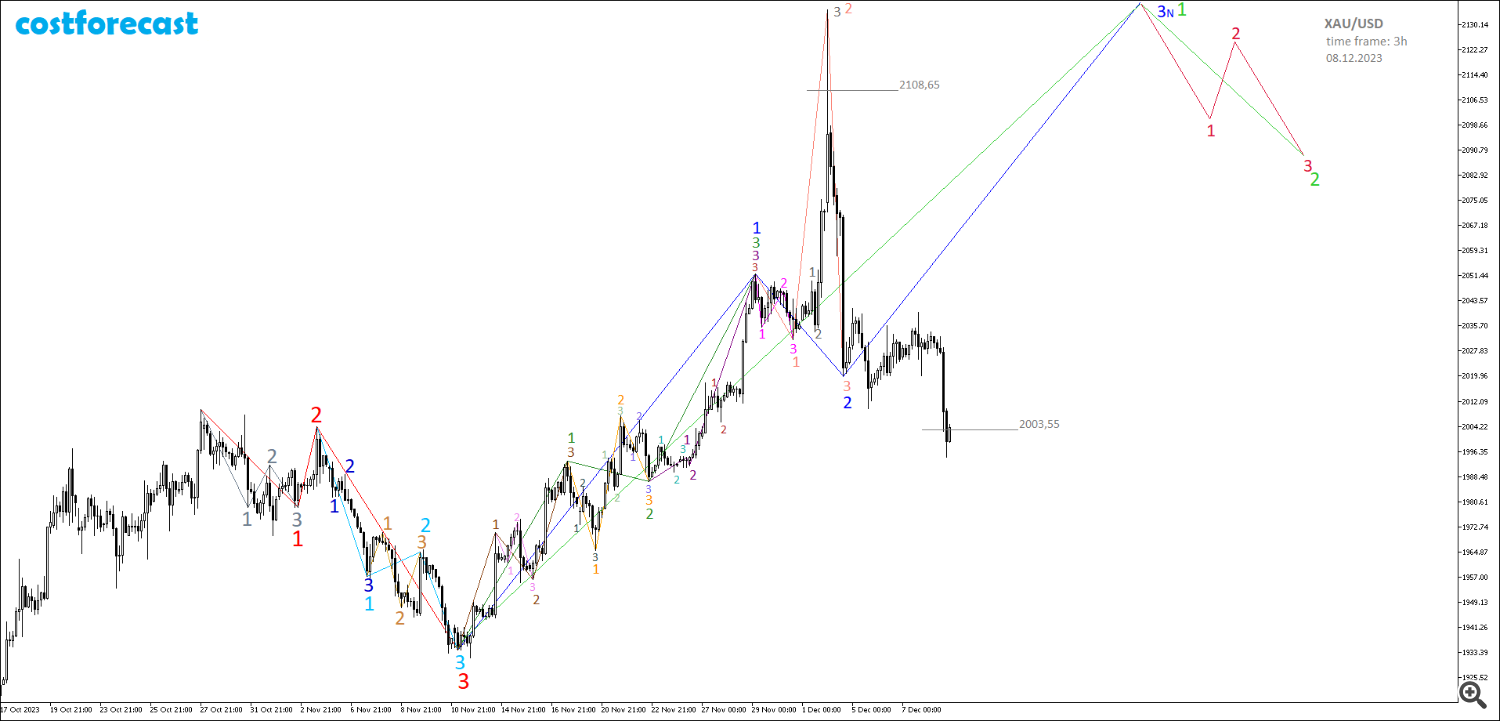
The dynamics of the gold price on December 8, 2023 indicate that the fractal shown in light red in the fractal structure of the chart for the time interval (November 29, 2023; December 4, 2023) cannot be considered as the second fractal. It shows. Segment of the blue fractal (Figure 14-1). The continued decline in the price may indicate that the second part of the blue fractal is still forming.

On December 4, 2023, a long position in the XAU/USD product opened in the account “costforecast” with a quote of 2108.65 and a volume of 0.06 lots was closed at a price of 2003.55. A change in value of 4.98% resulted in a loss of -645.17 USD. Because the price was likely to continue to decline, the position was closed at $2003.55 per ounce, and if the price fell below $2003.55 by an additional $9, the position was forced to close through a margin call.
Despite the decline in prices, it is too early to revise previously created models about the future dynamics of the gold price. Scenarios in which blue fractals should form in fractal structures remain a priority.
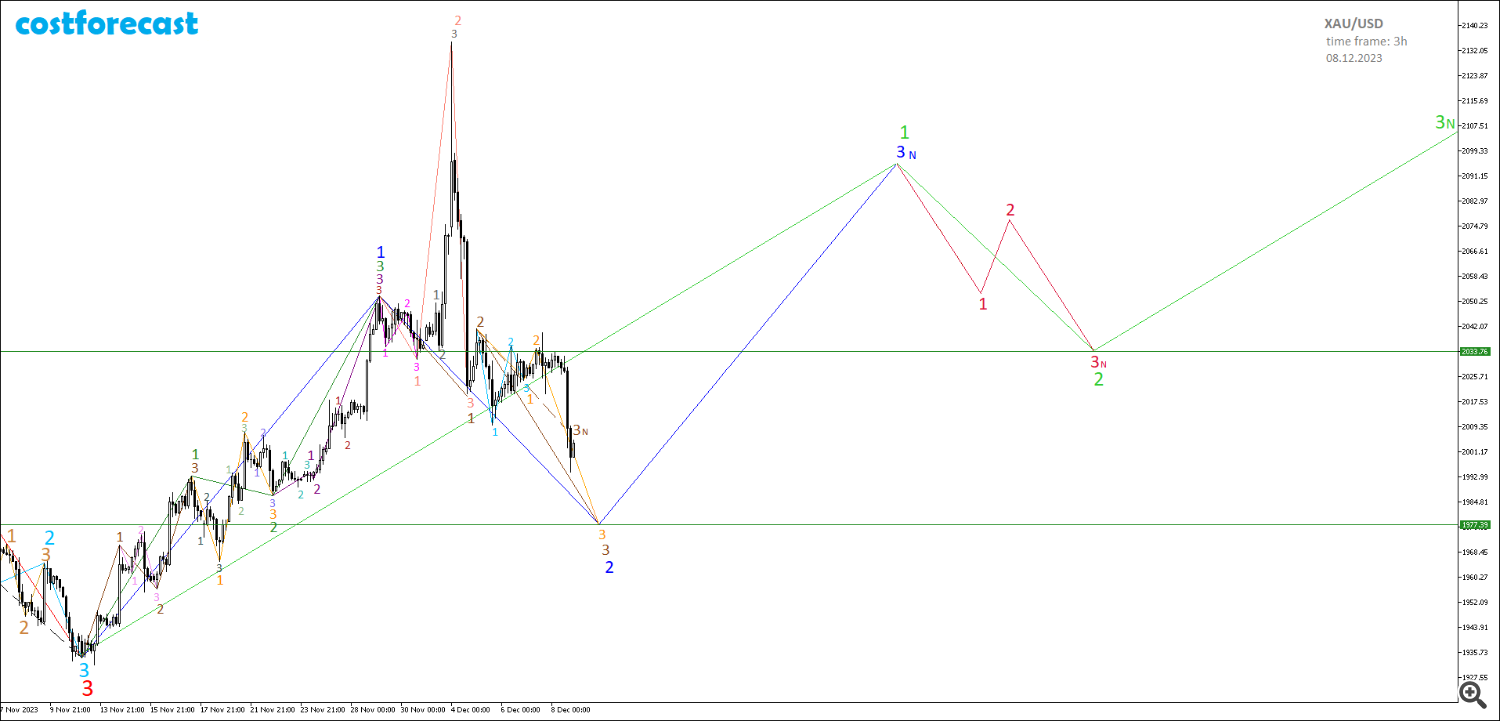
In this case, the assumption that the fractal shown in green in the time interval (November 13, 2023; November 29, 2023) is the first segment of the blue fractal one level higher implies the completion of the second fractal. This segment of the blue fractal is above $.39 in 1977 (P2=0.618*P1) (Figure 14-2).

Taking this assumption into account, the second segment of the blue fractal can be formed in the form of fractal FNo.12 (Niro alphabet), which is shown in the chart in brown with parameters P3=2*P1 and T3. =1.382*T1.
After that, the growth of the estimate should continue within the framework of the formation of the third segment of the blue fractal, the completion of which means the completion of one more first segment of the bright green fractal. This is followed by a downward crystal movement and the formation of a second segment of a bright green fractal with the parameters: P2=0.382*P1 and T2=0.236*T1.
A decision was made immediately to rewrite the maximum on the basis of the global fractal structure, specifying an upward trend and taking into account the possible formation of a brown fractal F22, the third segment of which is indicated by a dashed line 3N. After closing the buy position with a volume of 0.06 lots, a new buy position is immediately opened with a volume of 0.01 lots at a price of $2003.81 per troy ounce (Figure 14-3).


