Tesla (TSLA): Is the Correction Over? (video)
/stock-market-graph-gm523786073-51379002_Large.jpg)
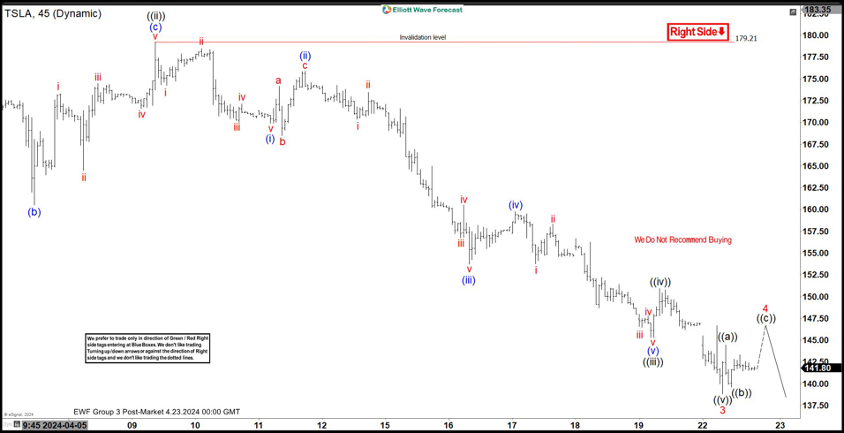
The short-term Elliott Wave view on Tesla (TSLA) suggests a decline is underway from the February 27, 2024 high, with a lower 5-wave impact. The first wave, which fell from the high on February 27, 2024, ended at 160.51 and the second wave rally ended at 184.25. Below that, wave ((i)) ended at 162.01. Wave ((ii)) rally ended at 170.21, as seen in the 45-minute chart below. Down from wave ((ii)) wave (i) ended at 169.90 and the wave (ii) rally ended at 175.88. The stock fell to 153.75 in wave (iii) and ended wave (iv) at 159.79. The stock is expected to move lower in wave (v) towards 145.3, where it completed wave (iii).
The stock rebounded from wave ((iv)) to end at 150.94, and the stock fell towards 138.80 in wave (v). This completes the third wave to a higher level. A wave 4 bounce is underway to correct the cycle from the March 26, 2024 high in 3, 7 or 11 swings before the stock falls. In the near term, I expect the rally to fail in 3, 7 or 11 swings for further declines as long as the pivot at 179.2 remains intact. The potential support area is the 100% – 161.8% Fibonacci extension from July 19, 2023. This area is 95.4 – 160.2. Therefore, the stock is already at the support zone and could end the correction at any time and go up.

Tesla (TSLA) 45-minute Elliott Wave chart
TSLA Elliott Wave (Video)
Source: https://www.fxstreet.com/news/tesla-tsla-is-correction-over-video-202404230253