Three Ways to Detect Trend Changes – My Trading – March 2, 2024

Hello, it’s been a while since I brought you a new educational blog teaching some popular methods for detecting trend changes. I will not discuss basic methods like moving averages because I am a wave/fibor/price action type of trader and I do not use indicators like moving averages to detect trend changes.
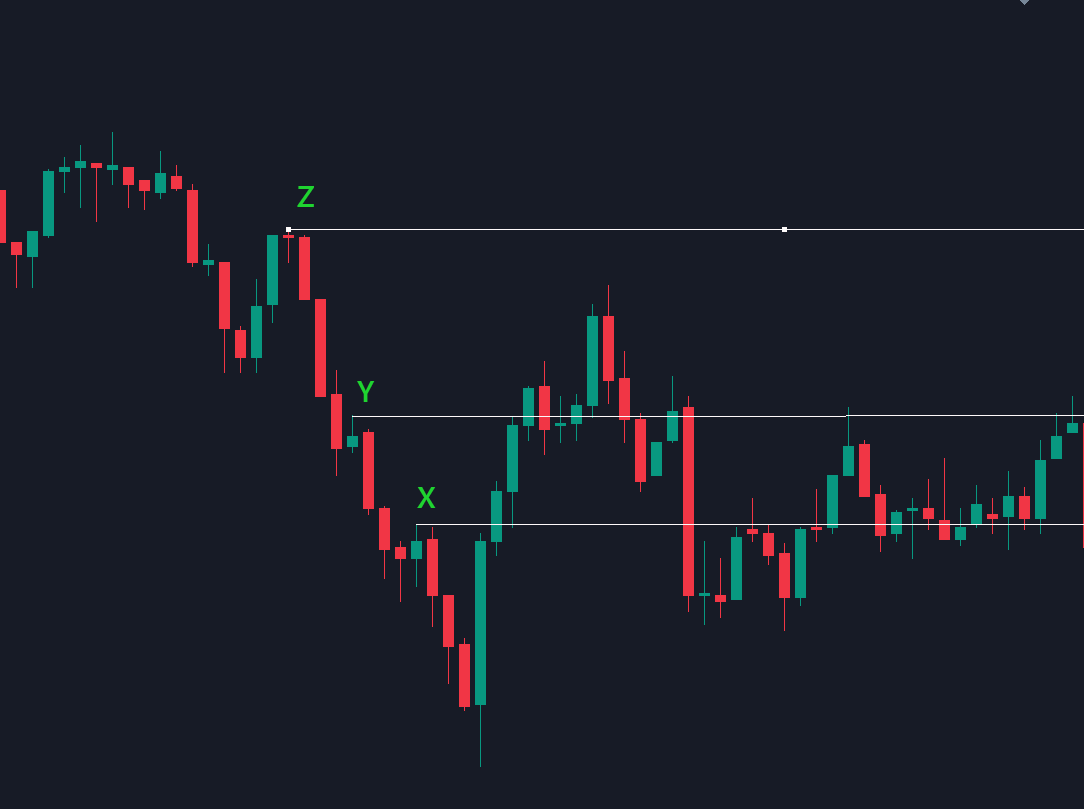
1. Breakout of X: This method considers the low as A and the previous swing high as X. If the price breaks close to X, then there is a probability of a trend change.
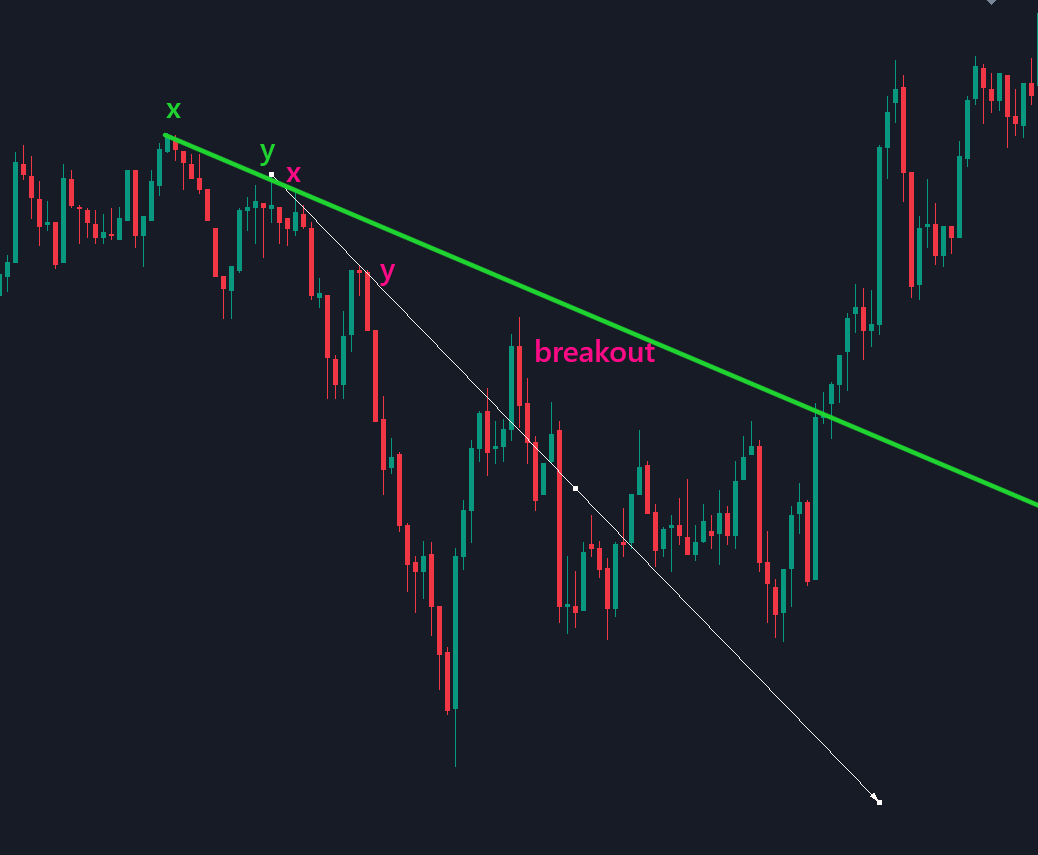
2. Trend breakout: Here we consider A as the bottom and find the recent xy trend line. There may be many trend lines taking xy to lower levels, but we only select the most recent trend lines. We do not consider touching the trend line more than once. So I call this the xy trend line. If a breakout occurs, the potential for a trend reversal exists.
3. Completion method: This method may delay admission. This method detects all pattern completions. These can be harmonics, chart patterns, or any type of pattern that is not held back.
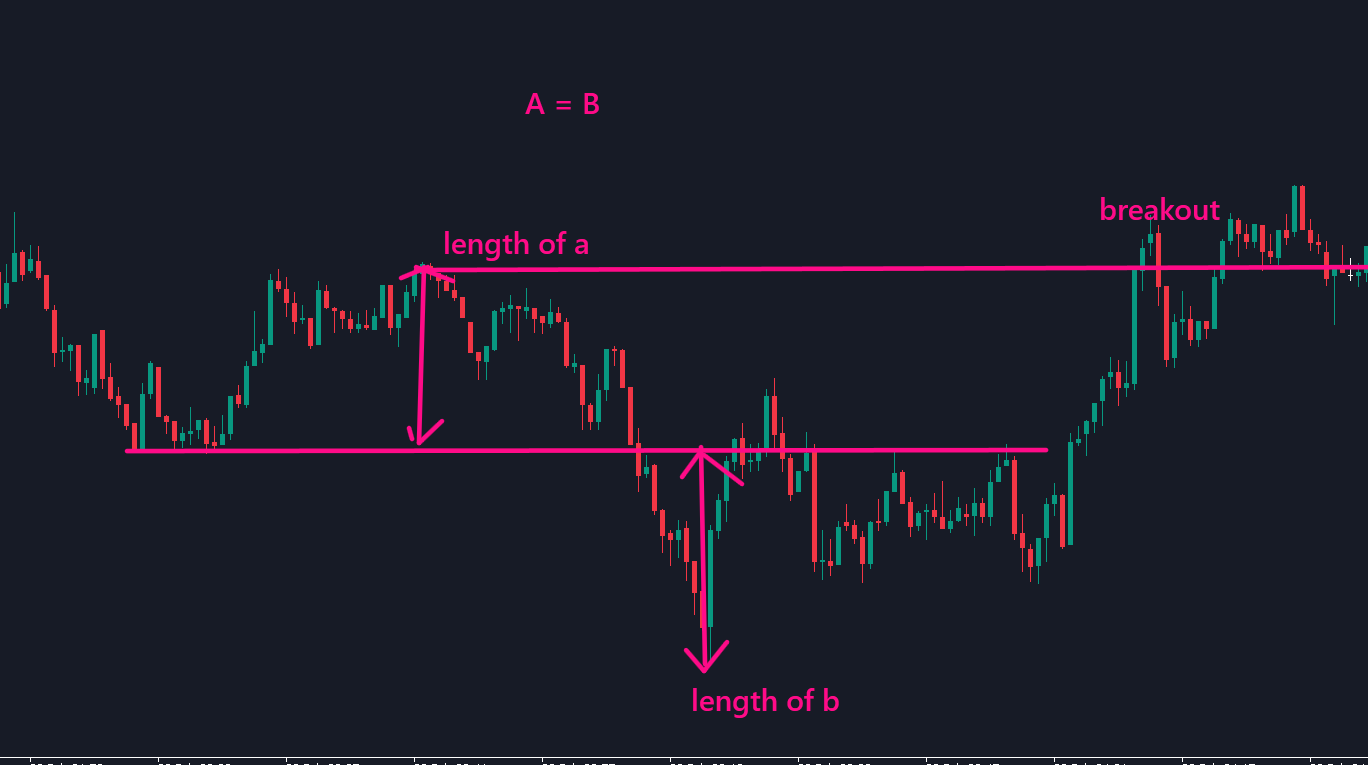
In this example, you can see that the Ab = Cd pattern is complete, as you can see that the left side of A is equal to the leg of B.
Now we wait for a breakout of A, in which case there is a probability of a trend reversal.
These are three basic methods that can be better than just watching indicators (e.g. moving averages and other methods for trend reversals).


