Understanding the Hammer Candlestick Pattern – Meaning, Types & More

hammer candlestick pattern: Candlestick patterns are a part of technical analysis favored by traders to understand and predict future price movements of securities.
In this article, we will discuss the meaning of the Hammer Candlestick pattern, its types, and how to set up trades along with the pattern formation.

What is the Hammer Candlestick Pattern?
Hammers are a type of candlestick pattern that can help you understand the expected direction of a security’s price. This pattern is similar to the hammer structure that forms at the bottom of a downtrend, indicating a price reversal of an uptrend.
A hammer pattern forms when sellers enter a security to drive the price down, but towards the end of the candle, buyers step in and absorb the selling pressure, ultimately driving the price higher.
In a hammer pattern, the closing price of the candle can be higher or lower than the opening price, but it must be a very small body with a low shadow at least twice the height of the body formed in the pattern.

How to Trade Hammer Candlestick Pattern?
Taking a position in a security considering the Hammer candlestick pattern with valid entries implies potential profits from the trade.
entry:- When a hammer pattern forms at the end of a downtrend, entry into a long position can begin.
It is always a good idea to check the hammer pattern before entering a long position. Once the pattern is confirmed, a buy position can be opened at the close of the next candle, which is higher than the high of the hammer candle pattern formed.
Stop Loss:- The stop loss for the position can be set at the lowest price of the hammer pattern formed. As part of risk management trading, it is important to respect logical stop losses.
Profit Target:- For long positions entered in a hammer pattern, the target can be based on the risk-to-reward ratio. Additionally, the profit target can be set at the next resistance level after entering the position.
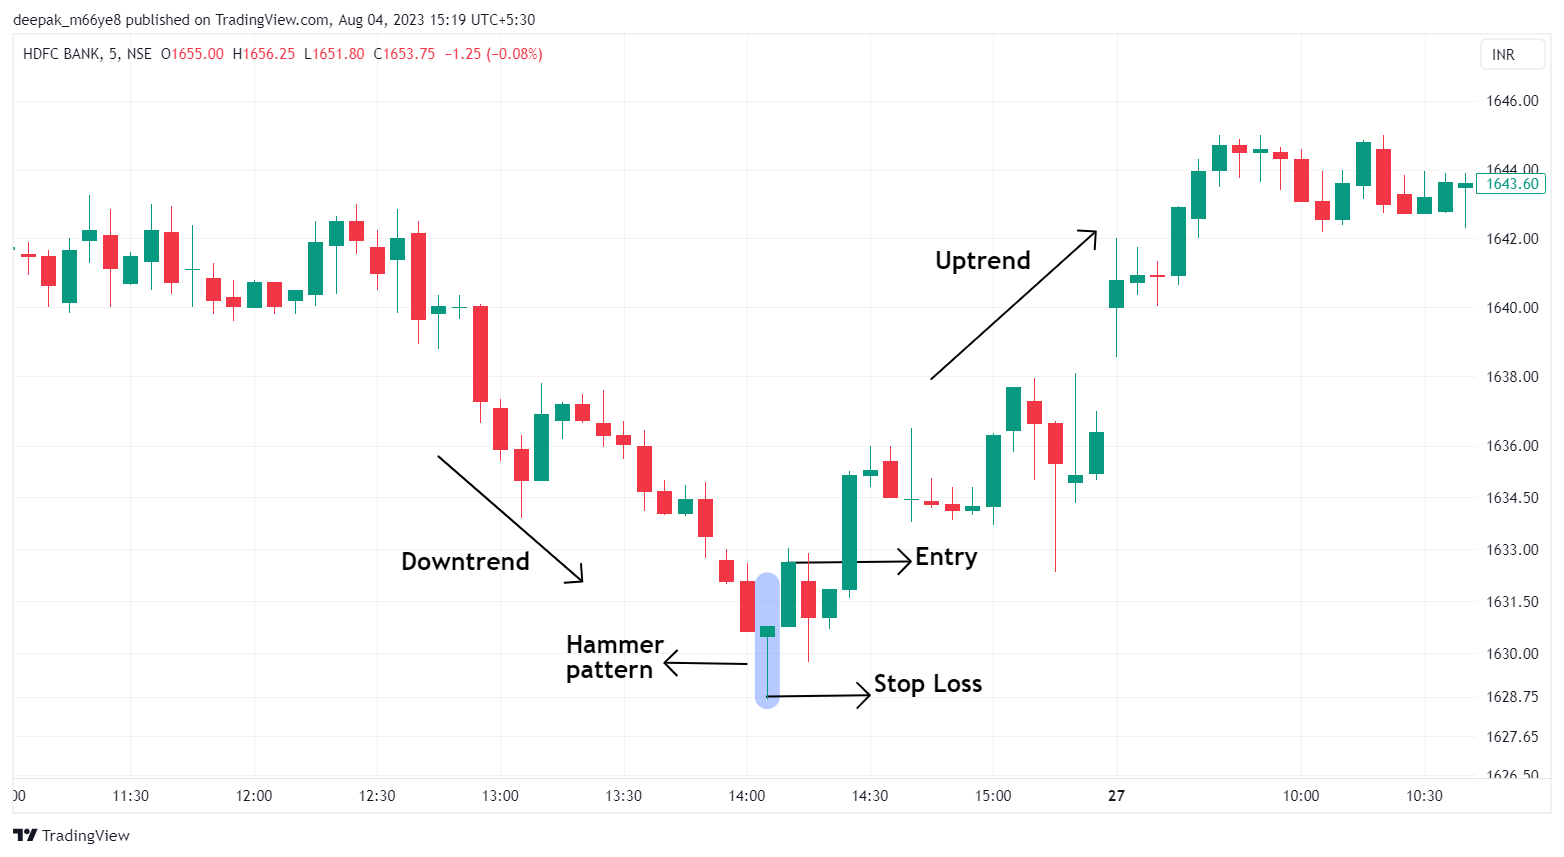
HDFC Bank chart showing hammer candlestick pattern with entry and stop losses.
What is the Inverted Hammer Candlestick Pattern?
An inverted hammer is a type of candlestick pattern that has the opposite formation compared to the hammer candlestick pattern. Here the body of the candle is at the bottom of the pattern.
The formation of a pattern indicates that selling pressure on a security is absorbed by buying pressure generated by buyers. If a security’s price is trading in a previous downtrend, the pattern formation signals a trend reversal.
In an inverted hammer pattern, the closing price of the candle may be higher or lower than the opening price. However, it must be a very small body with a higher shadow at least twice the height of the body formed by the candle pattern.

How to trade the inverted hammer candlestick pattern?
Spotting the formation of an inverted hammer pattern defines a trading opportunity with a good risk-to-reward ratio.
entry:- The formation of a pattern at the bottom of a downtrend is a sign that the security is reversing into an uptrend. Take a buy position at the closing price of the next candle in the inverted hammer pattern.
Stop Loss:- The stop loss for a long position may be at the lowest price of the inverted hammer pattern. As part of risk management, it is important to trade stop losses and respect logical stop losses.
Profit Target:- For long positions entered with the reverse hammer method, the profit target can be based on risk versus reward. Additionally, profit targets can be set at the next resistance level from the entry position.
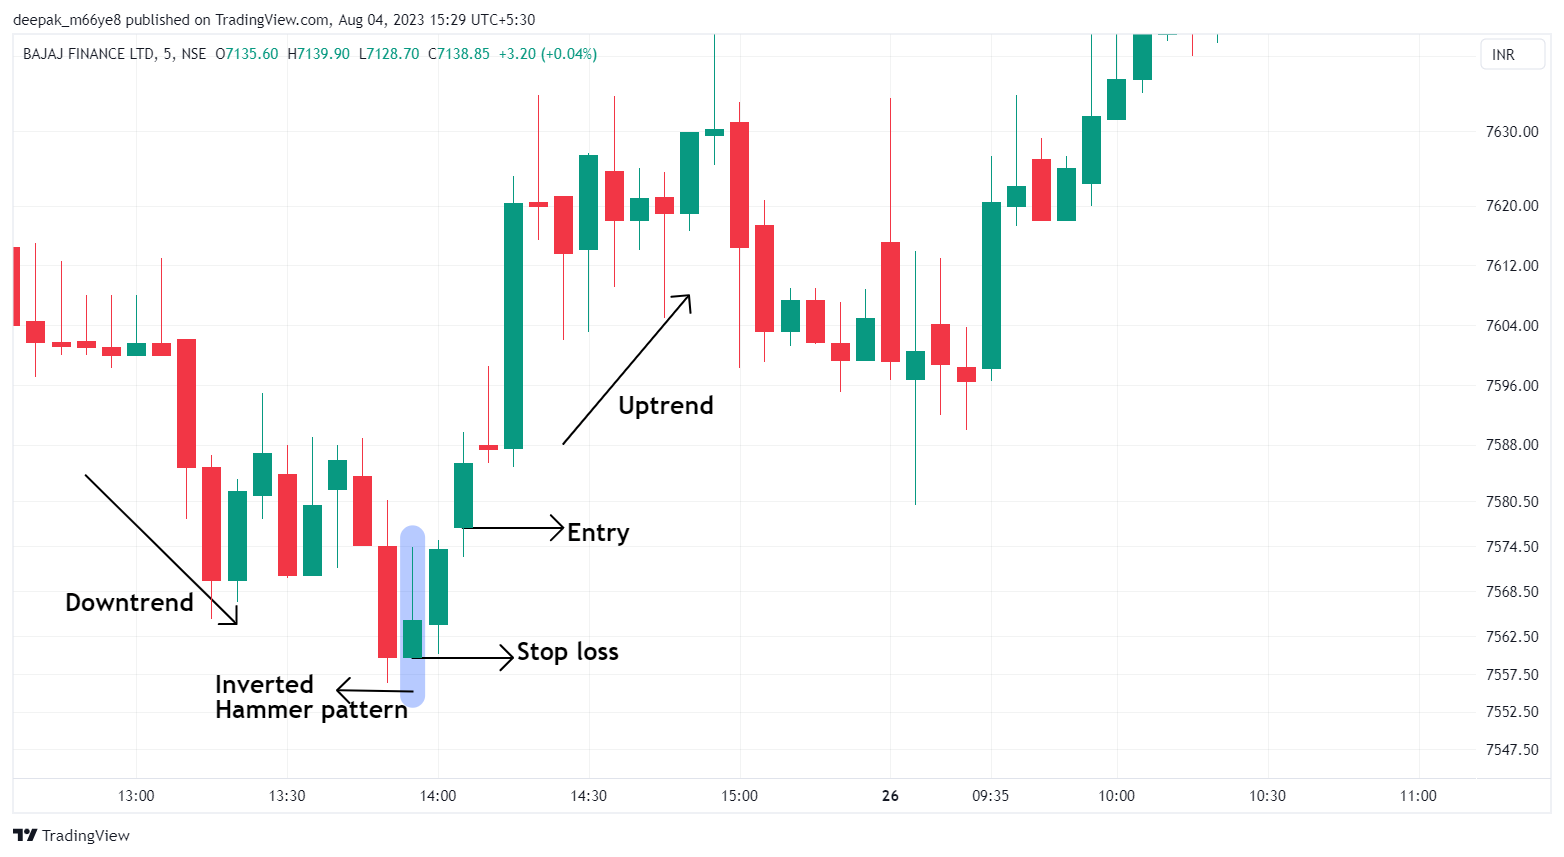
Chart of Bajaj Finance Ltd showing the formation of an inverted hammer pattern.
Aspects of identifying patterns
Below are some criteria to consider to identify hammer and inverted hammer candlestick patterns.
- Traders must ensure that the shadow of the pattern is at least twice as large as the body.
- Entry should be confirmed by the next candle with a closing price higher than the formed pattern.
- The previous trend should be a downtrend and higher volume when the pattern is formed indicates a stronger reversal.
- The color of the candle has no effect on pattern formation.
Finishing
Analyzing the price movements of securities using candlestick patterns helps traders identify better entry opportunities. Using the hammer pattern from the above learnings will help you build a perspective that allows you to trade with better risk management.
It is always preferable to use the hammer candlestick pattern along with other technical tools for a better defined view.
Written by Deepak M
by utilizing stock screener, stock heatmap, Backtesting Portfolioand stock comparison The tools on the Trade Brains portal give investors access to comprehensive tools to identify the best stocks, stock market newsBe aware and invest well.

Start your stock market journey now!
Want to learn stock market trading and investing? Check out exclusive stock market courses from FinGrad, a learning initiative from Trade Brains. You can sign up for free courses and webinars from FinGrad and start your trading career today. Sign up now!!


