Weekly Outlook: Markets to be tentative; This defense sector may be starting to show relative performance | India analysis

In our previous technical note, we had expressed concerns about Nifty and VIX rising in the same direction at the same time. As previously mentioned, in these situations, the VIX often acts as a leading indicator and harbinger of an impending corrective move. Last week, VIX rose 33.80%. This week too, over the last five sessions, VIX has surged another 26.37% to 18.47. However, the market was as corrective as expected and ended the week on a negative note. As Nifty oscillated in the 656-point range, the trading range also widened. The net loss for the week ended at 420.65 points (-1.87%).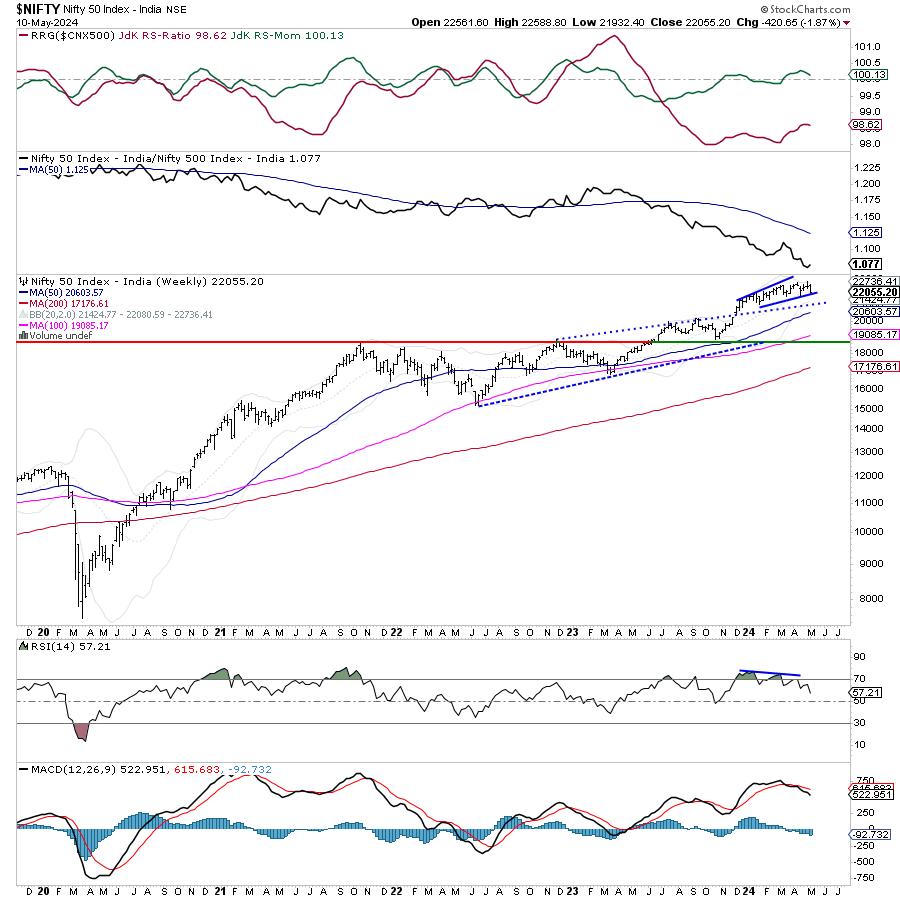
India Vix has surged over 76% from its most recent low in the last two weeks. The market also traded as expected. Currently, Nifty has closed at the 20-week MA, currently located at 22080. On the daily chart, the index has defended the 100-DMA, which is currently at 21992. This makes the 22000-22100 area the most. Area of immediate support for Nifty. Next week may see some technical decline. However, a violation of this support increases the chances of the index testing the 50-week MA located at 20603, making it very important to defend the 22000 level.
The market could see a relatively stable start to the week, with the 22250 and 22400 levels acting as potential resistance points. Support levels are 22000 and 21780.
Weekly RSI is 57.21. It formed a new 14-period low, which is bearish. It also shows a bearish divergence relative to the price. Weekly MACD is trending lower and trading below the signal line. A widening histogram indicates increased bearish momentum.
Last week we saw a doji forming on the candle. This is followed by a large bearish candle, which covers the body of the previous candle. This confirms that the 22775 level is an immediate high for the market, unless something convinces us otherwise.
Pattern analysis shows that Nifty has created a small upward channel. We tested the lower edge of that channel, which coincides with the 20-week moving average. This level, along with the 100-DMA on the daily chart, makes the 22000-22100 area an immediate support zone for the index. Violations of this area will cause the market to gradually weaken.
Overall, markets will continue to display a tentative tone. A technical rebound may occur from current levels. But even if such a rebound occurs, its scope is likely to be limited. The market continues to remain vulnerable to profit taking bouts at higher levels. It is a good idea to remain very selective while making new purchases. The market is also expected to become somewhat defensive. A very cautious approach is recommended for the coming week, while keeping leverage exposure at a moderate level and carefully protecting profits.
Next week’s sector analysis
With Relative Rotation Graphs®, we compared various sectors with the CNX500 (NIFTY 500 Index), which represents more than 95% of the free float market capitalization of all listed stocks.

Relative Rotation Graph (RRG) shows that only Nifty Auto, Metal and Consumption Index are within the major quadrants. They expected to outperform the broader market comparatively.
The Midcap 100 Index is within the bearish quadrant, but relative momentum appears to be improving. This may also improve the relative strength of the broader market. Apart from this, commodities, pharma, energy, infrastructure, PSU banks, PSE and real estate indices are placed in the bearish quadrant. These pockets may see individual stock-specific performance, but the overall relative performance of the sector may continue to slow.
NIFTY IT and Media indices are within the bearish quadrant. The media space appears to be seeing rapidly improving relative momentum compared to the broader market.
The FMCG index moved into the improving quadrant. This could mark the start of a phase of relative performance of the sector index against the broader market. Apart from this, Nifty Bank, financial services and service sector indices are also included in the improving quadrant.
Important note: RRG™ charts show the relative strength and momentum of groups of stocks. The above chart shows relative performance against the NIFTY500 index (broad market) and should not be used directly as a buy or sell signal.
Milan Vaishnav, CMT, MSTA
Consulting Technology Analyst
www.EquityResearch.asia | www.ChartWizard.ae

Milan Vaishnav, CMT, MSTA is a capital markets expert with nearly 20 years of experience. His areas of expertise include portfolio/fund management and advisory services consulting. Milan is the founder of ChartWizard FZE (UAE) and Gemstone Equity Research & Advisory Services. With over 15 years of experience in Indian capital markets as a consulting technology research analyst, he has been providing India-focused, premium, independent technology research to his clients. He currently contributes daily to ET Markets and The Economic Times of India. He also writes A Daily/ Weekly Newsletter, one of India’s most accurate “daily/weekly market forecasts”, now in its 18th year of publication. Learn more


