Wendy’s: I Continue To Await New Developments From ’70/30 Strategy’ (NASDAQ:WEN)
RiverNorthPhotography/iStock Unreleased via Getty Images
Corporate Overview
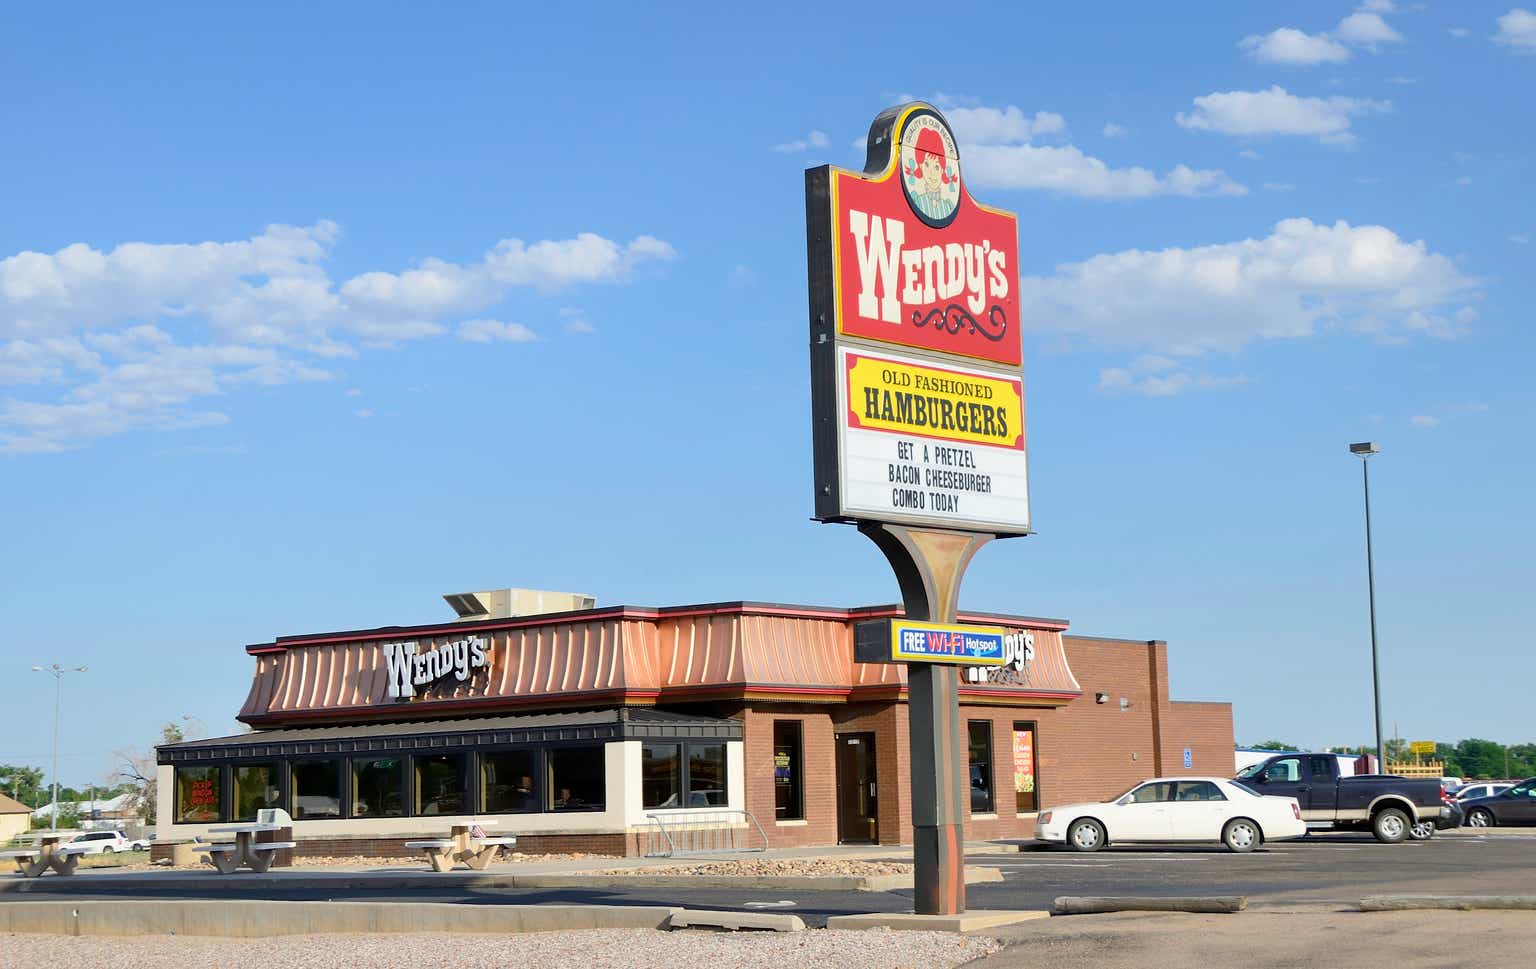
Wendy’s (NASDAQ:WEN) is a company that operates and franchises an international chain of quick service restaurants known worldwide mainly for its hamburgers, and is the second largest company (in terms of sales volume and customer traffic) in the segment in the United States.
Currently, with 55 years of history under its shoulders, Wendy’s has a broad global restaurant chain of 7,240 restaurants, of which approximately 6,030 (83%) are within the United States and 1,210 (17%) in other countries. The vast majority of its restaurants are franchised. Currently, about 6,823 of all Wendy’s restaurants are franchises, this represents about 94.97% of all its restaurants. While in international operations franchised units represent approximately 99% of all units, in the United States they represent approximately 93.3%.
Using the franchise expansion model, Wendy’s has already outlined its expansion program: “70/30 Growth Strategy”. I will discuss international developments in detail later, but basically this strategy predicts that 70% of the company’s future growth will come from its international operations, while 30% of the growth will come from within the United States. It seems to me that this strategy is based on implementing processes that aim to continue the slow expansion of sales within the United States, while aiming for more aggressive strategies internationally.
As these are almost antagonistic strategies for both life cycles in certain countries, Wendy’s will need an almost symbiotic integration with its franchisees. Smoothing this all out, when we measure the average number of units per franchisee, this gives a total of 11 for each international franchisee. And, as penetration strategies in new markets tend to be those that most require mobilization and remodeling of processes to deal with tighter margins, in addition to specialized training of employees to adapt to brand standards, the concentration of units to single franchisees is a positive thing.
Speaking of brand expansion strategies, for penetration into new markets, in principle we have four types of insertion: slow skimming, fast skimming, slow penetration and fast penetration. In the case of QSR’s, the slow penetration strategy is generally recommended, since the products have a low unit price, consumers are already familiar with the products and are highly price sensitive. This is the typical volume market. And if you notice, Wendy’s international sales volumes have been increasing rapidly. While company-owned restaurant sales in the United States grew 2.60% in 2023, and franchise sales within the country grew 5.25% in the same year, international sales at the twelve restaurants operated by Wendy’s grew more than 75%, while franchise sales grew 11.65%.
In the United States, strategies need to be differentiated, not only to grow in volume, but also to extend their life cycle. Basically, a mature company must do this on three fronts: converting non-users, entering new market segments and attracting customers from the competition. These are called “aggressive strategies” or “attack strategies”. We saw Wendy’s doing some of this in the first quarter when they had their March promotions and strategies to increase turnover during breakfast with burritos and Cinnabon Pull-Apart. It worked. They managed to increase turnover in the yard in the mornings. We can’t neglect the taste, after all, most people I’ve talked to about the new breakfast options at Wendy’s have found them delicious, but at QSR’s price sensitivity is almost always the loudest, and it really is quite cheap.
Another way to increase the life cycle of mature products is the so-called “defensive strategies”, in which instead of the company directing its strategies towards new customers, it focuses on customers already loyal or in the process of becoming loyal. But how can Wendy’s do this? Wendy’s can get customers to use the restaurant more often, more frequently, or update its products to be rediscovered. They see that there is a fine line between defensive strategies and offensive strategies. Ultimately, the company will be perpetrating both at the same time.
From a macro perspective, Wendy’s growth strategy is based on three fundamental pillars in the words of Kirk Tanner, President and Executive Director of Wendy’s. The first pillar refers to boosting SSS growth, maintaining the momentum we have been seeing since fiscal 2022, with the help of the digital channel. Speaking of digital channels, we have been seeing a huge increase in the industry for some time when it comes to this type of consumption. At Wendy’s, an increase of approximately 30% compared to the first quarter of 2023 in digital sales was reported. An important catalyst was the March Madness promotions, which offered a Dave’s Single for $1 or a Dave’s Double for $2 to anyone who redeemed on the Wendy’s app.
As a result, there was an increase of approximately 40% in active users on digital channels compared to 4Q 2023. In my opinion, using the application for promotional sales will only prove effective if it leverages cross-selling and upselling of already loyal customers, proving sustainable in the long term. Until Wendy’s achieves this, many purchasers will use the promotions without being loyal, and this will end up becoming a loss for the company if not controlled. I say this because in QSR’s there is less concern with the customer journey and the differentiation strategy because at the end of the day, customers in this segment are very price sensitive.
Still on promotions, I would like to give an addendum based on Kotler’s marketing theory. Sales promotions are generally unprofitable. Therefore, they need to be used in a moderate and strategic way, whether to retain a new group of customers or stifle competitors, however certain conditions can occur and turn promotions into fiasco. The worst case scenario for a promotion like the one on the Wendy’s app would be if very few new consumers tried the product. The data we have concerns new users of the application, but not new consumers in general. In this case, the company would basically be subsidizing the purchases of old customers.
That’s what happened? Probably not, as we saw growth mainly at a time when loyal customers generally don’t visit Wendy’s, so either these customers are new or they are already loyal customers who are increasing their purchasing volume, which is a very good thing for both. ways. The second worst type of promotion is when it only attracts price-sensitive customers. Whether this was the type of promotion we saw in March, only time can tell us.
The second pillar aims at a significant acceleration in global net unit growth, which will result from the penetration strategies I mentioned previously. The third pillar focuses on operational efficiency at the restaurant level, culminating in an improvement in margins. These three pillars are the fundamental foundation for the 70/30 growth strategy. Now that I’ve covered the qualitative developments at Wendy’s, let’s get to the numbers.
How has Wendy’s been adapting to new trends in the industry?
According to a survey conducted by Square, approximately 80% of global restaurant chains are more optimistic about the future than they were a year ago. Large companies operating in the QSR market are outlining their expansion projects in accordance with new market paradigms. In my previous analyses, both of QSR’s and of fast casuals and casual dinings, we are following the expansion projects, and we noticed some central points that permeate the needs that these restaurants try to meet.
Firstly, we are seeing a movement aimed at implementing management technologies based on artificial intelligence and digitalization of processes. It is undoubtedly a common thread that permeates all recent developments in the industry. And this becomes an increasingly important point when we take into account the rise in labor costs.
Let’s look at Wendy’s. The company is undergoing a remodeling regarding the engineering of its management processes. We have already seen clear developments arising from the adoption of the new ERP system in SG&A expenses. The use of AI-based predictive technologies for inventory control is resulting in Wendy’s having a minimum average renewal period. Across the industry, we are seeing QSRs ahead of casual dining when it comes to automation. This was expected due to the relative simplicity of the QSR processes.
Externally, Wendy’s is reportedly using digital channels as a vector of its “70/30 Project”, as I said previously, the increase in sales on digital channels is due to the use of the application which, if well optimized in relation to the loyalty and pricing, has great potential in increasing sales, especially cross-selling.
Another industry consensus is the continued increase in off-premise sales. For Wendy’s and the QSR segment, this does not seem to be a problem, as orders are prepared in advance taking into account the needs of customers who were already looking for QSR restaurants as a practical way to save time. I explained how the increase in sales in off-premise channels impacts casual dining in my analysis of Chuy’s, you can find it here.
Another very important point is the search for new sources of revenue when implementing alternative meals. A major catalyst, in addition to greater integration with digital platforms and the app for Wendy’s in the first quarter of 2024, was the growth in turnover in the morning park due to breakfast. By opening its restaurants earlier and offering products like Cinnabon Pull-Apart at affordable prices, Wendy’s did two things: it increased the volume of already loyal customers who now, in addition to frequenting the restaurant at other times of the day, go in the morning, and it has attracted new customers who didn’t frequent Wendy’s before, but now stop by in the morning to eat their meals.
Therefore, we see that there is an amplification of the loyalty of the first customer and the building of a relationship with a customer who is not yet completely loyal. Bearing in mind that in service management, quality perceived by the customer occurs through a sequence of perishable moments, it reinforces the fact that these alternative sources of revenue must be coordinated by an experienced team, which at the same time reinforces the brand relationship. with already loyal customers, create a good impression on first-time customers. This is only the result of an organizational culture focused on the customer.
Financial analysis
Capital structure, financing policy, immobilization model and average terms
To begin with, as we always do in our analyses, we will take a closer look at Wendy’s financing policy. Conceptually, the ideal financing policy has as its primary objective the maximization of the efficiency of capturing the resources used by the company in its investments and the maximization of the return potential through the reduction of the cost of capital. In other words, while investment policies are aimed at maximizing the rate of return on a given asset, financing policy aims to minimize the cost of capital of available resource sources. Of the two categories of capital sources, only third-party capital has an explicit cost, which is materialized through the payment of interest.
In the following graph, we can visualize the capital composition that Wendy’s uses in its capital source formatting:
Author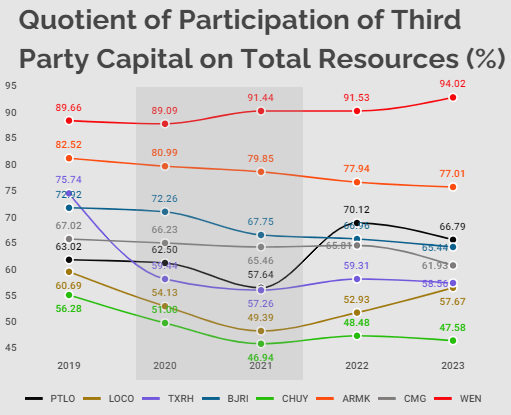
Note that Wendy’s finances approximately 95% of all its assets from third-party capital. But as you may already know, a company with high levels of debt is not always considered insolvent or incapable of generating value for its shareholders, basically it will be incurring greater economic and financial risk. Therefore, it is up to us, analysts and investors to “separate the wheat from the chaff”. In other words, investigate deeply and try to understand the extent to which Wendy’s debt is being beneficial in amplifying shareholders’ return on capital. If the cost of this debt is constantly exceeding the returns this capital is generating for the company, this means that the leverage is not only destroying economic value, but also amplifying the loss to shareholders.
In finance literature, there are two interesting concepts that relate to the topic of debt in companies and that I think it is worth sharing with you in this analysis:
- Economic risk: Economic risk comes from the financial structure of a company. In other words, it is materialized through an inability to bear the explicit costs of third-party capital. When there is a high economic risk, a very high degree of debt is not recommended (or even acceptable), as given the uncertainty regarding the results of operations, it may occur that they do not generate sufficient funds for the implicit remuneration of third-party capital; and
- Financial risk: financial risk materializes through the high variability of returns to common shareholders. It can be caused by a high degree of economic risk or even by the use of resources that require a fixed or priority remuneration compared to shareholder remuneration.
Therefore, the analysis we will focus on in this section will aim to measure these two risks through two indicators: Debt Efficiency and Degree of Financial Leverage (DFL). Basically, the Debt Efficiency indicator will measure Economic Risk, as it aims to measure the constancy with which the company is capable of generating operating profit to cover the explicit remuneration of third-party capital. Meanwhile, when we combine the DFL indicator with the result of the Debt Efficiency analysis, we will be able to measure Economic Risk, as we will analyze how leverage will be impacting shareholder remuneration.
I usually say that, with some rare exceptions (we can include Texas Roadhouse here as an example in the industry, as it is performing exceptionally well and generating huge returns even without using orthodox leverage), companies must assume, to some degree, an amount of financial risk. That is, in most companies, one must accept the fact that, using leverage in non-anomalous circumstances, the returns on shareholders’ capital will be increasing, even at the risk of not being so.
But why do I say that? When a company is operating under normal conditions, without environmental variables characteristic of an economic recession, the return on total assets will tend to be higher than the cost of third-party capital (if it were not, it would be more advantageous to liquidate the operation completely). And, as per principle, the cost of third-party capital will tend to be lower than the cost of own capital, precisely due to the distinction in risks assumed by each of the agents, the greater the proportion of third-party resources that Wendy’s can use at a lower cost, maintaining a constant and increasing return, the more beneficial it will be for the company.
Therefore, what are the two variables that influence more effective leverage? The first is the ability to generate resources from this acquired third-party capital. Therefore, this is a task that falls outside the scope of financing (which is what we are discussing at the moment) and falls under the responsibility of Wendy’s investments. The second is the company’s ability to raise third-party capital at the lowest possible cost, this relative level varies through exogenous constraints and the reliability of the remuneration of third-party capital based on Wendy’s credit history. In short, the greater the gap between the return obtained from leverage and the cost of debt capital, the greater the benefits of this leverage for Wendy’s.
I considered this extensive dissertation on leverage necessary because this is a focal point in discussions about highly indebted companies like Wendy’s, and this “holistic” view of leverage is necessary to understand all the benefits and harms it entails. Without further ado, let’s analyze Wendy’s Debt Sustainability combined with the DFL:
Author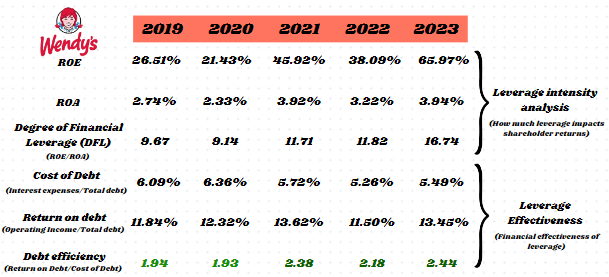
Naturally, we can detect points of interest to measure both the financial and economic risk of Wendy’s through the acquired data.
Firstly, we should note that due to the size of debt capital in Wendy’s capital structure (approximately 95%), there is a notable dissonance between the return on assets and the return on equity. This dissonance is evidenced by the DFL indicator, which has been increasing year after year. This indicator shows how boosted the return to shareholders was from leverage. However, from the DFL it is only possible to measure the intensity of leverage, but not its “direction”. I mean, even with a high DFL, if Wendy’s is not able to remunerate debt capital from its operating profits, this leverage will only amplify its losses.
Therefore, the “secret” to healthy leverage is obtaining a substantial operating profit from the investment of this capital obtained by third parties in assets that yield a cash flow that is more intense than the explicit cost of this capital. Therefore, a more accurate analysis of an indicator that I named as “Debt Efficiency” is in order. From this indicator, it is possible to obtain answers to the central question when it comes to leverage: “The company is generating returns greater than the cost of obtaining this capital”. If so, leverage is being beneficial and the residual (gap between the cost of debt and its return) is amplifying the return to shareholders, since the cash flow from assets (now more numerous and voluminous due to obtaining financing and using when purchasing them) is remunerating an increasingly lower percentage of equity.
The Debt Efficiency indicator shows that Wendy’s is generating a return consistently higher than the cost of debt through growing operating profits. And this relationship can be seen in the last line of the graph. Effectively, in an added value analysis, we can infer that the company created value from the debt, since it obtained a higher remuneration than the amount paid to acquire this capital.
From this, we can answer the two questions that center our analysis of Wendy’s leverage:
- Is Wendy’s able to generate a greater return on debt than the cost it incurred to raise it? (Economic risk): Yes, Wendy’s is generating a return on debt that is consistently higher than the cost of acquiring it. This is evidenced by the Debt Efficiency indicator. Therefore, we can infer that the economic risk derived from Wendy’s leverage is historically low. Remembering that even if the tendency of the pattern of historical variables is repeated, there are always present and future circumstances that can put the historical variables to the test; and
- Is Wendy’s generating positive returns for its shareholders? (Financial risk): Yes, despite the fragility with which this occurs (since a loss would mean amplified losses for shareholders), Wendy’s has been presenting positive returns for its shareholders for more than ten years. We can see from the DFL indicator that even in the last three years these returns have been quite substantial.
The graphic representation below brings together Wendy’s leverage situation in each year since 2019:
Author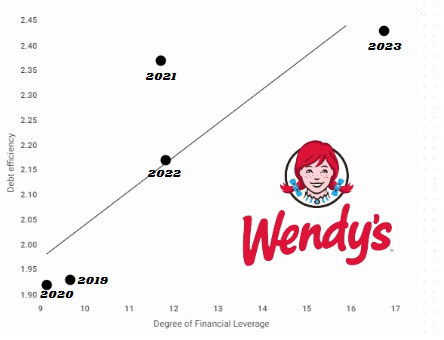
Note that, even though in 2023 Wendy’s was more leveraged, it managed to generate a higher return in relation to the cost of debt (greater Debt Efficiency) and, consequently, amplified its earnings even further. This is interesting when we take into account that even after increasing the composition of third-party capital, the company managed to reduce the cost of this capital. To explain this, we must understand a little about the theory of Ezra Solomon and David Durand.
According to this theory, it would theoretically be possible to maximize the company’s return by optimally balancing the two sources of capital, reducing the weighted cost of capital. In principle, based on the basic presumption of finance between risk and return, in non-anomalous conditions, the cost of third-party capital must be lower than the cost of equity capital. Based on these assumptions, the WACC would decrease as the proportion of debt capital in the equity structure increased. This movement would continue until the point where creditors doubted the debtor’s ability to pay. This would be the inflection point and, consequently, the ideal capital format, in which the company would optimize both cost and leverage.
Right away, we can make the obvious assumption that, according to the theory defended by Solomon and Durand, companies that are more reliable in relation to their creditors (companies with greater payment capacity) are able to reduce their weighted cost of capital by increasing the proportion of third-party capital in the company’s capital formation.
I know this might get too conceptual, so I’ll represent the Solomon/Durand theory graphically here:
Durand-Solomon model (Author)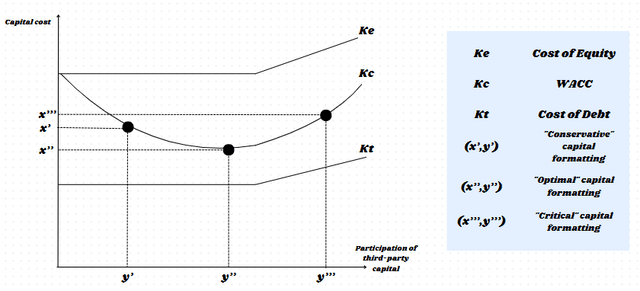
Note that there is an inflection point at which each marginal increase in the percentage of third-party participation in capital formation will result in an increase in the WACC. In other words, from the percentage of y” forward, when taking on debt the company will increase its weighted cost of capital, as it will not be able to obtain financing at rates like the previous ones. Therefore, it is clear that leverage is no longer effective when a marginal increase in total debt will increase the cost of debt.
Furthermore, it is necessary to be aware, no matter how obvious it may seem, that even with the same cost of capital, a conservative financing policy (x’,y’) will always be more suitable than a critical financing policy (x’’’, y’’’), precisely because of payment of interest on debts.
We saw that Wendy’s increased the percentage of third-party capital participation in its equity structure by approximately 5% since 2019, resulting in a decrease in its total debt cost by approximately 0.5%. We came to the conclusion that, in addition to marginal debt causing positive effects on the company’s cost of capital, Wendy’s has not yet reached the optimal capital structure according to the orthodox Solomon/Durand theory.
If, on the one hand, companies that take on debt beyond their capacity suffer from increases in the cost of capital, companies that do not take on debt also maintain high capital costs, as is clear in the case of x’,y’. This is the case, for example, of the last company we track quarterly results, Chuy’s (CHUY).
As the cost of equity capital reflects the return expectations necessary to attract investment, considering the opportunity costs of other investment options available in the market, companies must demonstrate consistent returns to justify reducing the cost of equity capital over the period. time. And this explains why companies that present mediocre returns and that still refuse to take on debt can greatly increase their weighted cost of capital.
Therefore, under the orthodox approach, those responsible for financing policy should ask themselves: “How long will my company be able to increase debt and still reduce my cost of capital? Furthermore, how long will I be able to maintain payment sustainability interest on these debts?” Combined with these issues, it is clear that the capital raised must be satisfactorily invested by the company in assets that generate returns consistently higher than the cost of debt.
The Modigliani-Miller (M&M) theory, published in 1958, opposed Durand and Solomon’s approach by arguing that there is no relationship between the financial structure and the cost of capital. According to this theory, the average cost of capital is constant, regardless of the level of debt. Therefore, unlike the “orthodox” approach, according to M&M theory there is no optimal capital structure.
With the cost of capital constant, the cost of equity would be equal to the cost of capital plus a rate that reflects the risk of the level of debt, but which does not affect the WACC. I will graphically represent the situation below:
Modigliani-Miller model (Author)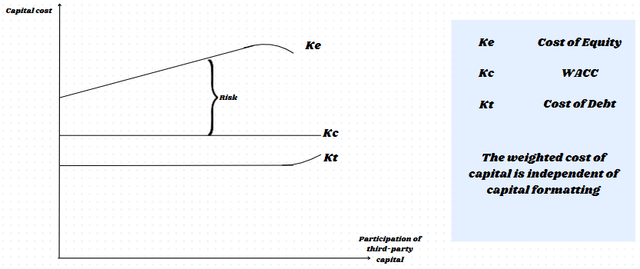
You may be wondering: “if the capital structure and the level of debt affect the cost of equity, why does it start to fall when the company reaches very high debt levels?”. The answer is that, according to the M&M theory, investors would tend to be interested in this company’s shares since the return on invested capital would be substantial (take into account that at these levels the company in question is highly leveraged).
We have to take into account that the M&M theory assumes that all variables are constant, efficient and perfect, and as we know, this is not the case in real life and the capital market. Therefore, despite recognizing the importance of the M&M theory, I rely on orthodox theory to give my opinions in this and all my analyses. I just thought it would be interesting to mention this aspect for those who didn’t know it.
Now let’s talk about a very important subject that serves as a “point of convergence” between most restaurant chains, whether QSR, fast casual or casual dining. I’m talking about the non-existence of the figure of net working capital and the consequent immobilization of current resources by most companies in this industry.
The study of fixed assets seeks to understand how a company uses its resources (current and non-current) in formatting its investments. The act of immobilizing different types of resources (the purchase of fixed assets from current or non-current resources) shapes the way a company deals with its assets when seeking to optimize its cash flow. But why the word “immobilization”? Effectively, when a company uses resources (current or non-current) to purchase fixed assets, due to their very nature, unlike more liquid assets, which may be liquidated in a few days or a few months, the capital invested in fixed assets, in theory, it should remain immobilized for a period of more than one year. Therefore, it is clear that the discussion about the type of resources used in immobilization is of great importance for companies, as they may or may not be required in the short term.
I explained this situation in greater detail in my Portillo’s (PTLO) review (which you can find here). But, basically, restaurant chains, due to their short operating cycle and negative cash cycle, are able to use commercial credit to immobilize current resources. That is, they are able to immobilize resources that are required in the short term.
Normally, when we talk about corporate finance (as well as the issue of capital structure), there are two major theories that deal with the immobilization and what type of capital can be immobilized or not. According to orthodox theory, the procedure was quite clear: “don’t buy short-term fixed assets.” In other words, as the fixed asset has a certain useful life, financing it in the long term gives the opportunity to cover outflows, mainly interest payments based on the inflows provided by it.
On the other hand, against the grain of orthodox analysis, at the height of the 1970s, dynamic analysis was developed. Unlike orthodox analysis, dynamic analysis integrates cycle analysis as a way of understanding how the cash cycle is impacting the company’s cash flow. To carry it out, it is necessary to understand that there are two types of current accounts: Cyclical and Static. Cyclicals vary according to the pace of business and have a direct relationship with the company’s operations, whereas Erratic ones do not have a direct relationship with operations and can fluctuate for various reasons.
By comparing Cyclical Assets with Cyclical Liabilities, we can see whether the company is maximizing the potential of its cash cycles. I’ll explain better. When a company has a negative Cash Cycle, it means that it receives money before paying its suppliers. Now, if Account Payables is a Cyclical Liabilities account and, when we increase the payment period we are using commercial credit to enhance our cash cycle, a greater amount of Cyclical Liabilities also indicates that the company is being effective in both its credit policies and inventory turnover (keeping your Cyclical Assets reduced), while increasing your payment terms (increasing your Cyclical Liabilities).
I know it seems counterintuitive, but only with a negative cash cycle and efficiency in managing its cyclical accounts can a company be able to immobilize current resources without problems. BJ’s (BJRI), Texas Roadhouse, Portillo’s, EL Pollo Loco (LOCO), and the vast majority of large chains do not have the figure of net working capital, and therefore, immobilize current resources. All of these have negative (or very short) cash cycles, allowing this immobilization. Below, I will attach a table that deals with the main differences between orthodox analysis and dynamic analysis:
Author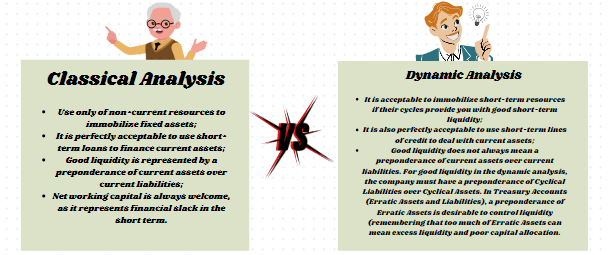
Therefore, we can infer that if a company does not have non-current resources (equity and long-term debt) for immobilization, according to the dynamic analysis, if the company has a negative cash cycle, it will be possible to immobilize current resources, in the form commercial credit and other short-term resources. Both theories converge regarding the use of short-term credit lines to finance working capital.
Without further theories, let’s get to practice. Does Wendy’s have net working capital? See the table below:
Author
Note that Wendy’s has net working capital. As shown in the graph, fixed assets largely cover their own capital (which, as we have seen, is very small compared to third-party capital in Wendy’s capital format), but due to the amount of non-current resources, most of it is covered by long-term liabilities.
This means that Wendy’s immobilization is based within the parameters of orthodox structural analysis theory. And this is the opposite of what we saw in other companies in the industry, with the exception of Chuy’s, which also has net working capital, but in the case of the latter, the presence of net working capital is due to a solid equity base on the balance sheet. Basically, the situation at Wendy’s is as follows:
Wendy’s only tied up non-current resources; and Since the company has net working capital, it has a large amount of non-current capital in the form of current assets.
Remember that I named the three possible immobilization models as: Conservative (immobilized only equity and has a part of it in the form of own working capital), Orthodox (immobilized all equity and a part of long-term liabilities, still has net working capital, that is, non-current resources that have not been immobilized) and Dynamic (it has immobilized all its non-current resources and a part of its current resources, its current assets are completely financed by short-term resources).
As a rule, only companies that have opted for the “Dynamic” type of fixed assets must maintain negative cash cycles. For the other two immobilization models, it is always desirable to maintain a reduced operating cycle and a negative cash cycle, but there is not the same urgency as in the aforementioned model.
Below I will graphically represent, based on the intrinsic characteristics of Wendy’s, the “Orthodox” immobilization model:
Author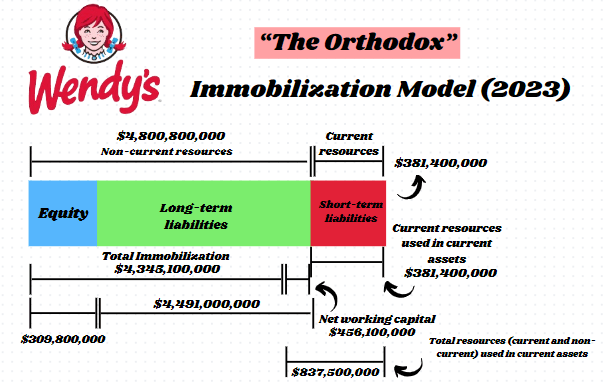
But why doesn’t Wendy’s opt for the Dynamic immobilization model? If from this model it is possible to maximize the use of capital, increasing the amount of fixed assets, and at the same time maximizing the efficiency of this same capital (since the company uses commercial credit to its advantage and, consequently, the cash cycle, working this amount within the receipts/payments gaps, and thus minimizing its cost with interest and conventional loans), why doesn’t Wendy’s opt for it?
The answer lies in your cycles. Let’s take a look at them now:
Author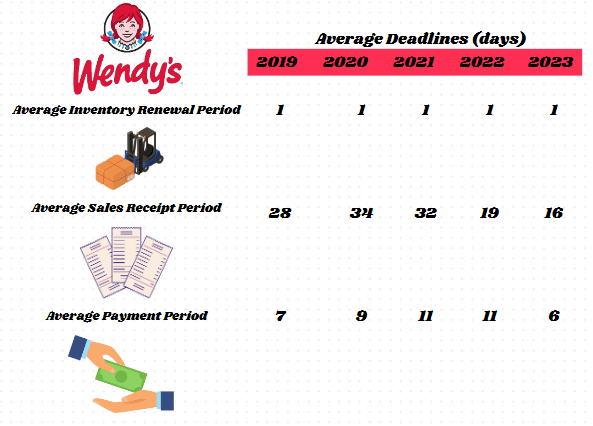
Author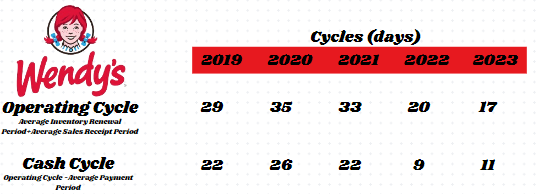
It is quite evident when we analyze Wendy’s cycles that the company does not have a negative cash cycle, and it is precisely for this reason that the company does not use the dynamic immobilization model. The erratic and long operating cycle, despite not being influenced by the inventory renewal period (which indicates optimal inventory management), is completely impacted by the extremely high average sales receipt period.
In practice, Wendy’s pays its suppliers before actually receiving payment for their sales, this indicates that Wendy’s is not able to use commercial credit to its advantage and optimize its cash flow. This explains why the company needs to maintain liquidity from non-current resources in its current assets, as it does not have renewal from a good old negative cash cycle.
Author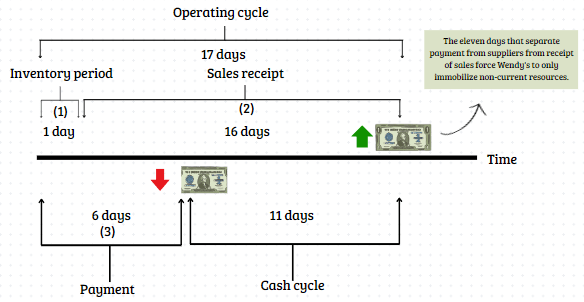
But how can Wendy’s reduce its average sales receipt time? Before entering this area, it is important to emphasize that the side effects resulting from a long payment period would be compensated through a proportionally long average payment period, at least regarding the issue of immobilization of current resources. Therefore, the first and most obvious solution is for Wendy’s to reduce its cash cycle by increasing payment terms.
In addition to the classic credit policy optimization model proposed by Weston-Brigham, the “Five C’s Model” (Character, Capacity, Capital, Collateral and Conditions), there are some more pragmatic ones that I would recommend for Wendy’s. Initially, it would be ideal to review the credit policies and terms that the company practices, in order to balance them with its payment policy. After reviewing the credit policy, it would be ideal to check the payment processing systems to see if there are any bottlenecks. Furthermore, a review of the accounting recording and reconciliation systems would be essential to increasingly eliminate the possibility of delays.
As I think we have exhausted any and all discussions about Wendy’s capital structure, below I will attach the result of the Dynamic Analysis under the Fleuriet Model methodology. As we have already analyzed the company’s cycles, we already knew the result in advance: cyclical assets exceed cyclical liabilities, indicating that the company does not efficiently use commercial credit to reap the benefits of the gap observed in the cash cycle.
Author
Operability
Before we talk about performance, we have to make some considerations about where Wendy’s revenue comes in. Basically, the company has three segments: Wendy’s US, Wendy’s International and Global Real Estate & Development.
Wendy’s US encompasses the chain’s own restaurant operations and Wendy’s franchises in the United States. By the beginning of 2023, the company had more than 6030 restaurants across the country, being the second largest QSR company in the hamburger sandwich segment in the country. Wendy’s is present in 51 American states, in approximately 2,820 cities. Therefore, revenues from Wendy’s US include both sales in restaurants operated by the company directly and royalties from franchises. Another source of revenue, typical of QSRs that largely use the franchise model for their expansion, are advertising fees from franchisees. If you read my analysis of El Pollo Loco, you know that this source of income, although less substantial, should not be neglected.
Wendy’s International, like Wendy’s US, also obtains revenue from the same sources, the only difference is that only restaurants outside the United States are included here. It is important to remember that Wendy’s operates directly and through franchises in 32 foreign countries, with approximately 1210 restaurants located around the world.
Global Real Estate & Development is responsible for managing owned and rented properties from third parties, which are subleased to the company’s franchisees. Additionally, it participates in a real estate joint venture called TimWen. In addition to these activities, the segment operates to provide services to franchisees.
Of the 7,240 Wendy’s restaurants around the world (here I’m talking about Wendy’s US + Wendy’s International), approximately 6,825 restaurants are franchised, and only 415 are operated directly by Wendy’s. Therefore, we can already imagine that the majority of the company’s revenue comes from royalties. But let’s analyze this composition sectorally. I compiled some data in the following image:
Units overview (Author)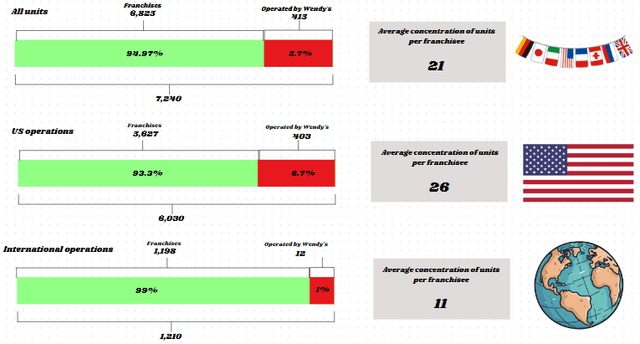
Now that we’ve dissected where Wendy’s revenue comes from, let’s take a look at its year-by-year evolution:
Wendy’s revenue (Author)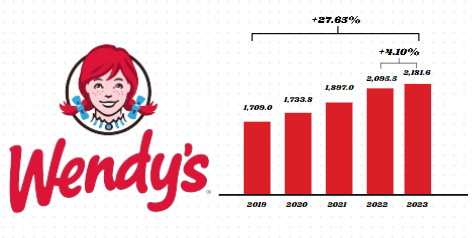
Note that on an annual basis, Wendy’s was successful in increasing its revenue by approximately 4.1% compared to fiscal year 2022. This growth was mainly driven by an increase in SSS in all of the company’s two operating segments. The global segment (Wendy’s US + Wendy’s International) saw SSS growth of 4.3%, Wendy’s US of 3.7% and Wendy’s International of 8.1%.
Wendy’s also saw growth in sales on digital channels of approximately 2.2% in 2023 compared to 2022, totaling approximately 13.2% of total sales (this is equivalent to approximately $122,773,200).
It is important to emphasize that an increase in off-premise sales in a QSR restaurant chain does not have the same side effects that this increase represents in restaurants in the casual dining segment. I will explain better. In addition to the entire QSR infrastructure already being prepared for large volumes of off-premise sales, including simpler preparations, specific packaging and specialized staff, the value proposition of this type of restaurant is not affected by this type of sales.
This is because customers looking for a QSR are looking for different types of benefits that are not impacted by the off-premise sales channel, such as agility and convenience. Another very important factor is maintaining turnover within the restaurant. Because on-premise capacity is limited to the number of tables, an increase in off-premise sales means that Wendy’s is able to maintain high turnover within the restaurant, even if on-premise capacity is limited to the number of tables available.
Let’s take a look at the composition of annual revenue over the last three years:
Composition of revenue (Author)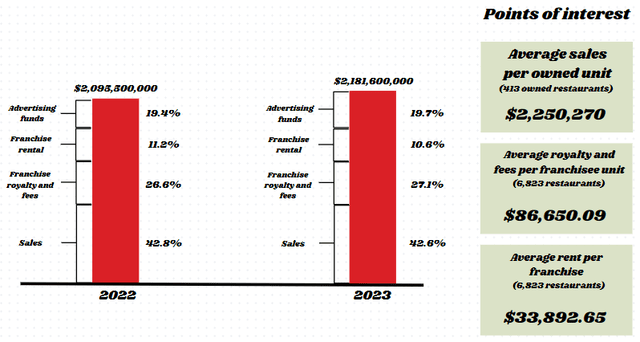
Note that, despite representing a little less than 6% of all Wendy’s units around the world, the 413 company-owned units generate approximately 42.6% of all its revenue. Despite the greater importance, the composition of this group in relation to total revenue decreased slightly. This is due more to the accelerated increase in royalty revenue from franchises than to a weakness in sales at units operated by the company.
Let’s look at the numbers: sales of restaurants operated by Wendy’s within the United States grew 2.6% in 2023, while revenue from the entire franchise system operated in the US grew 5.25%. International franchise system sales increased by 11.65% last year. Note that, despite the slow growth in units operated by Wendy’s, the average revenue of these units centrally operated by the company is an average of $2,250,270, while the average of franchises (Wendy’s US + Wendy’s International) is $1,817,983. In other words, when we take into account Raymond Vernon’s theory on the life cycle of products, we come to the conclusion that Wendy’s refrains from having units called “cash cows”, which by nature have slower growth, but a substantially high cash flow. And this is what we see when we compare the revenue from these precious assets with the revenue from franchised units and the flow of royalties from them in relation to their importance in total revenue.
While the company gains space in the national and international market with less profitable units but with accelerated growth, it maintains strong revenue from mature, slow-growing assets. And, despite the slow growth of mature units, average revenue per unit has been growing in the last three years in all segments.
Moving on to short-term trends, the table below shows Wendy’s revenue in recent quarters:
Revenue quarterly (Author)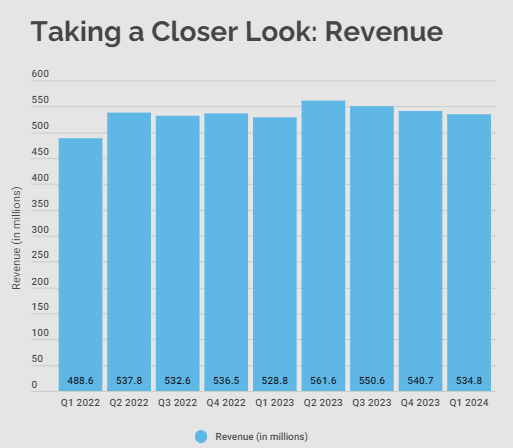
Note that even with Wendy’s reporting revenue around $5.6 million lower than expected in Q1 2024 and 1.09% below the immediately previous quarter, revenue performance for the first quarter of 2024 surpassed Q1 2023 by 1.13% and Q1 2022 by 9.45%. Still in Q1 2024, the SSS of the global operation (Wendy’s US+Wendy’s International) grew 0.9%. It’s not an impressive number, but when we put it in perspective that on a two-year basis, this metric grew by almost 9%, it makes things a little clearer. In the Wendy’s International segment, the company reported a 3.2% increase in SSS (an impressive 17.1% on a two-year basis). In operations within the United States, we saw slower growth in SSS compared to last year, around 0.6%. So even though comparable sales didn’t grow as much during the quarter, we didn’t see a reduction in this metric like we saw with many industry players. Of course, due to the situation and leverage of operations, Wendy’s is less affected by problems such as storms in the South of the United States, for example. But this growth, even if slow, is already something to give some value to.
Although customer traffic showed a drop when compared to the previous quarter, the company reported that in operations in the United States, Q1 2024 surpassed the last two quarters in terms of traffic. This can be explained by both increased sales for pickup (supported by the company’s increased presence in advertising) and the reacceleration of the day park, with daytime Cinnabon Pull-Apart and breakfast burrito options.
Now let’s talk about operating costs and expenses. Wendy’s recognizes as its costs: the cost of sales, franchise support costs, franchise rental expenses and advertising fund expenses. Initially, we will focus on the cost of sales, as this is the most important source of operating costs for any restaurant chain.
The image below shows the amount of revenue that is consumed by cost of sales over the last three years:
Sales and operating costs in our own units (Author)
In fiscal 2023, we saw an accommodation in the sales costs of Wendy’s own restaurants, with gross margin improving 80 basis points. This accommodation in costs on a relative basis was mainly due to a larger check per customer in 2023 compared to 2022. With the decrease in traffic, we did not see an escalation in food and packaging costs, which grew approximately 1.53%. Another very important operational cost when we talk about QSR is labor costs. In all our previous analyses, we saw inflationary and regulatory pressures in the labor sphere. In 2023, these costs increased by approximately 3.64% compared to the previous year. Occupancy costs drop 10 basis points in absolute terms.
After a year in 2022 where Wendy’s saw all of its group-owned restaurant operating costs rise, 2023 represented a breather for costs related to food and packaging, but labor costs are expected to continue rising. What worries me is that the salary, after all, is just the “tip of the iceberg”, as there are regulatory mechanisms that render useless any attempt to cut costs other than dismissing the employee. Digitalization and the increase in off-premise sales can alleviate this, but only the increase in the dissonance between this cost center and revenue could be enough to alleviate the negative impacts of pressure on labor costs.
As I said previously, in addition to these operating costs that are related to the operations of our own restaurants, there are still other costs that concern the rest of Wendy’s revenue.
See below how these costs are integrated into total revenue:
Total revenue breakdown (Author)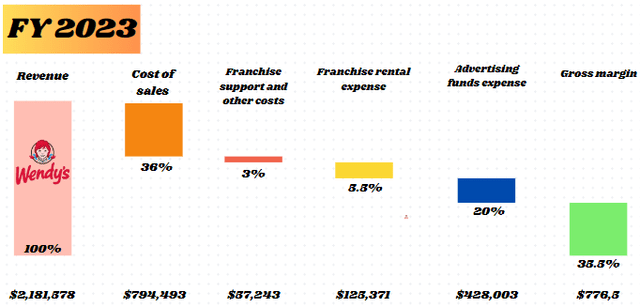
Let’s see what the gross margin evolution has been over the years:
Author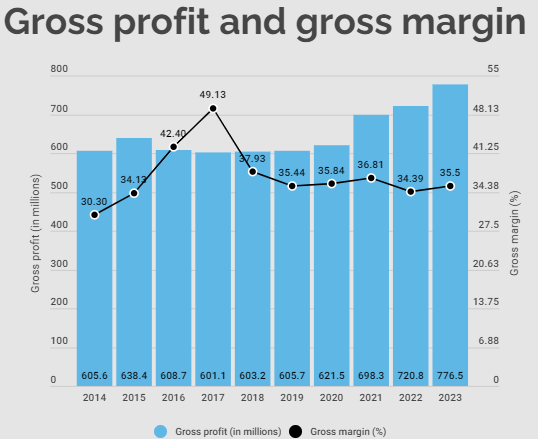
Note that its gross margin has remained stable at around 35% over the last ten years on an annual basis. This means that the company is successfully controlling its costs and expenses, both in relation to its own operations and expenses related to franchises.
In the last quarter, the company reported that the margin of its own restaurants remains at 15.3%, which is 0.7% higher than the average margin of its own restaurants in 2023 and around 1.5% higher than in 2022. So, I see it as just a question of time for its gross margin to grow to the levels we saw in 2018 by the end of fiscal 2024, as revenue from company-owned operations accounts for nearly half of all Wendy’s revenue sources.
Changing the subject, all the cores that make up SG&A expenses are reduced in 2023 compared to 2022. In the following graph, I dissect SG&A expenses based on their most important cores:
Breakdown of SG&A expenses (Author)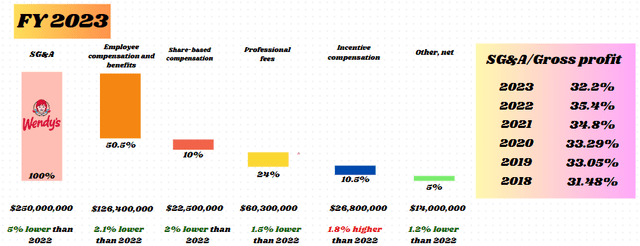
Note that in fiscal year 2023, SG&A expenses presented the best numbers since fiscal year 2018. This result shows that the developments arising from the implementation of an ERP system in 2022, culminating in a decrease in remunerations and fees in the administrative sector, in addition to a decrease in share-based remuneration. Despite reductions in other areas, the incentives were greater due to better operational performance in 2023. Therefore, I do not see any threat coming from some kind of de-anchoring of SG&A spending relative to gross profit.
Since we have already thoroughly analyzed Wendy’s debt and the impact on earnings and leverage during the first section of the financial analysis, let’s go straight to the analysis of net profit and net margin:
Author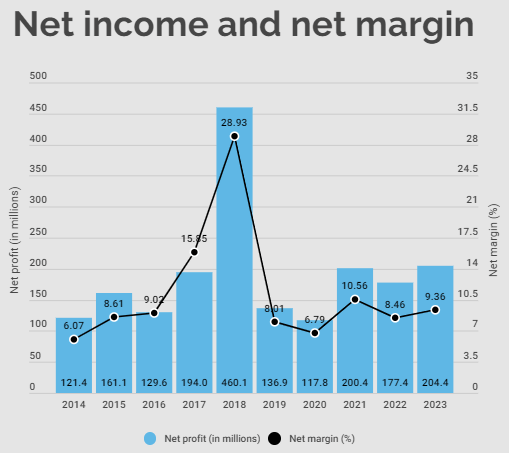
Net income and net margin quarterly (Author)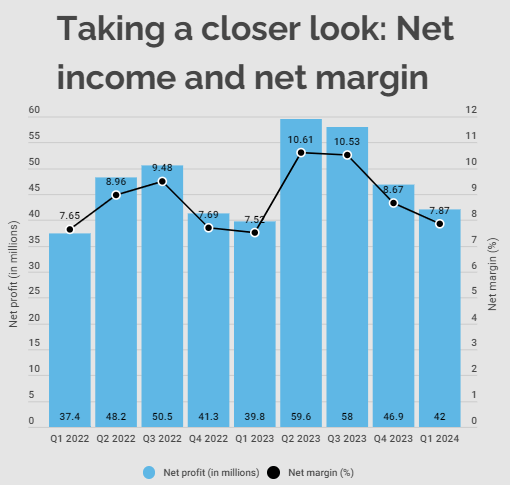
The net margin in fiscal year 2023 was above both the average and the median of the last five years, largely due to the developments that we have already commented on previously. Quarterly, the company showed an improvement of 0.35% compared to the same period in fiscal year 2022 and 0.22% higher than in 2021. The first quarters have been weaker periods for Wendy’s after the pandemic. Below I compiled some historical data regarding the worst quarters for Wendy’s since 2012, and it was found that historically the third and first quarters are periods of lethargy for the company.
Author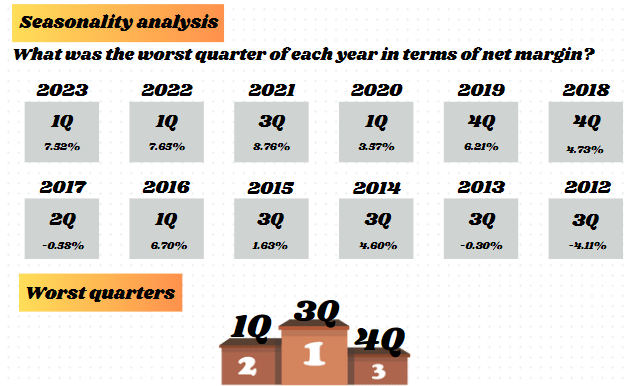
Profitability
Given the developments at Wendy’s historically and in the last quarter by our analysis so far, I believe the time has come to check profitability. I will apply a series of metrics that will help us determine whether the company is generating an adequate rate of return in every sense, but mainly for the shareholder. Let’s start with the CROIC (Cash Return on Invested Capital) analysis:
Author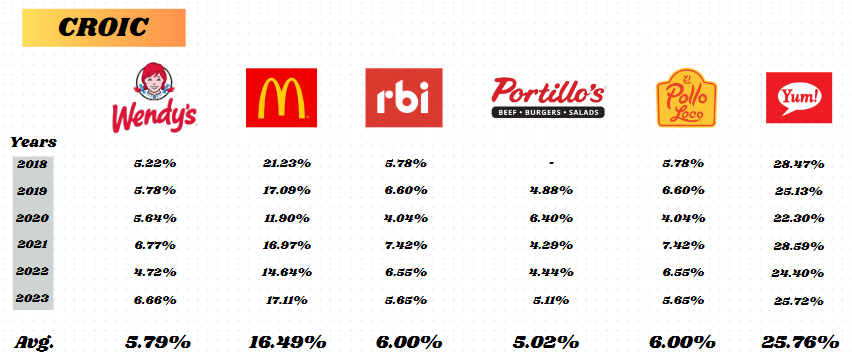
Note that Wendy’s CROIC indicates that the company is not very good at generating cash flow from total invested capital. This difference becomes even more notable when compared to the QSR industry. Here it is evident that Wendy’s is unable to maintain asset turnover in line with the segment’s standard. With a multiple of 0.41, Wendy’s is 58% below the industry median. Mind you, I’m not saying that Wendy’s profit margin is comparatively weak, but rather its ability to generate revenue from its total assets. Therefore, I am not making a finding about operability, but rather about the dissonance between the book value of its total assets and the revenues arising from these assets.
As CROIC measures the ability to generate operating cash flow from a company’s total investments through its assets, a higher asset value would require a higher return in the form of operating cash flow. And I’m not talking here about the quality of Wendy’s operating cash flow, which, by the way, is very healthy (around 60% of its operating flow comes from its net profit, demonstrating an abstention from non-monetary items compared to something that really generates substantiality), but rather an inability to generate revenue from the invested capital and, consequently, with a revenue incompatible with the invested capital, even a substantially greater margin on the part of Wendy’s would not make that much of a difference.
Author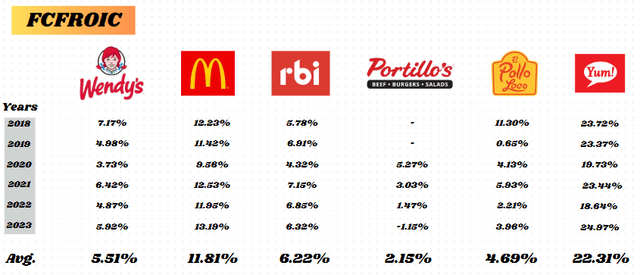
Note that Wendy’s also does not generate a return on free cash flow that makes it stand out in the top quartile of the industry. Every year, Wendy’s spends about 20% to 35% of its operating cash flow on purchasing capital goods. This amount appears to be in line with the other companies we are comparing. Understanding the dynamics of FCFROIC, we know that mature companies have a higher generation of FCFROIC than expanding companies and, even though it is a consolidated company, Wendy’s generates a poor FCFROIC compared to mature companies.
Author
From a managerial point of view (since we are evaluating the creation of value based on total investment and not just shareholder capital), through EVA analysis, which measures the value added to economic activity based on the concept of opportunity cost (Here I used the average risk-free rate for each year as opportunity risk, since I do not have enough data to measure the average weighted cost of capital, dynamically for each period, but statically).
Lawrence J. Gitman explains that EVA “can be thought of as the rate of return required by market investors to attract necessary financing at a reasonable price.” In other words, if the company does not generate a sufficient return on its investments that does not constantly exceed the risk-free rate, creditors may demand a higher rate of return on their capital, materializing the risk involved in the operation. And, as we’ve already seen that Wendy’s is quite dependent on third-party capital, this could be a problem in the long term. The good news is that since 2014, the only year in which Wendy’s did not generate a return above the risk-free rate was 2023. But this was not due to a significant decrease in net profit, but rather an escalation in monetary policy contractionist. In the year 2024, I have my doubts whether Wendy’s will be able to show substantial added profitability.
Author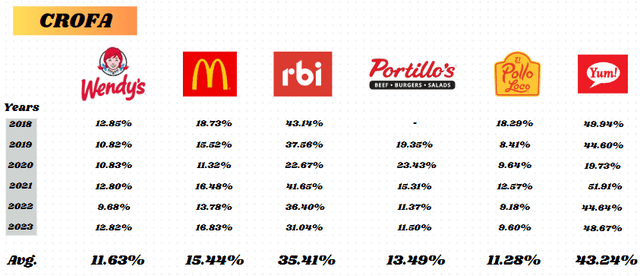
Since we are measuring responsiveness of asset investments, CROFA indicates that the operating cash flow generation from Wendy’s marginal assets is generating a lower return than the industry. But what will be the impact of interest payments on debt in relation to this metric? I will now use operating profit instead of operating cash flow to isolate non-operating expenses from my analysis. Remembering, when we are seeking to understand the responsiveness of investments at an operational level, the ideal would be to understand how each component of a company’s variables affect the evaluation of the return on any investment.
Author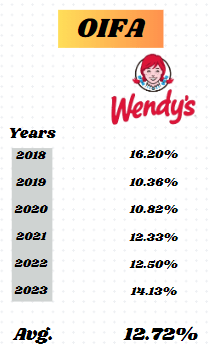
Even when we put aside the variable of interest paid, we still do not observe any type of comparative advantage in the form of superior profitability from the investment.
Valuation
Initially, I will measure my target price for Wendy’s based on some quantitative valuation models. First, I would like to make some reservations about my assumptions for the DCF model. For the discount rate, I used the company’s WACC, which is approximately 6.79%.
For the growth rate, I considered a few things. The first is that as the company has a low CROIC, we cannot consider very strong cash inflows in relation to the segment, and this can be corroborated by the FCFROIC. Therefore, for its free cash flow to grow, Wendy’s would need to reduce its investment activities (since the marginal return on investment is already quite ‘flat’) or control its financing activities. As we saw that the company depends on net working capital for its cash flow to function properly, we can expect debt payments to remain the same.
Therefore, I do not expect Wendy’s free cash flow to show substantial growth over the next few years in line with its projected EBIT growth (3.83%). Below is the model and target price:
Author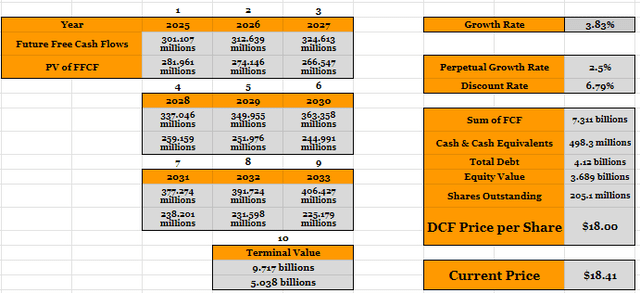
Using other quantitative models such as Benjamin Graham’s and Peter Lynch’s we have the following results:
Author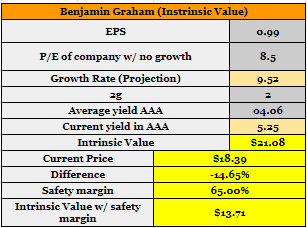
Author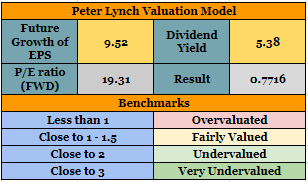
Note that although Wendy’s intrinsic value is slightly above the price at which it is trading today, we cannot buy it with a margin of safety that is satisfactory for value investors.
Conclusion
Based on the developments noted in the article, I would consider “Hold” for Wendy’s. Structurally, I can see some problems in the management of the cash cycle and the operational cycle, not allowing Wendy’s to maintain an optimal efficiency of the invested capital, having to use non-current resources for immobilization and, consequently, having to bear financial expenses more voluminous. However, even with limited operational efficiency, I did not see any type of economic and financial risk from the company’s leverage.
With a satisfactory gross margin, although still facing pressure from labor costs and SG&A expenses decreasing, I believe there is a small room for improvement in the net margin in the short term. Despite this, I still see anomie when we consider profitability compared to the sector.
Is there room for the “70/30 Expansion Program”? In my opinion, yes, but I’m not sure about the profitability of the assets and how long it will take for these assets to mature until they generate a satisfactory cash flow, both for Wendy’s and for the franchisees. Regarding investment in digital channels, I consider it to be very positive and will be the path to greater global appeal.
Despite these advances, I still consider Wendy’s as a company that lacks catalysts for its growth with other competitors that are more profitable and have greater appeal. However, I don’t see structural risks here, even with such a large debt and the problem with cycles.

