What is a High Wave Candlestick Pattern? Trading Strategies and More

High Wave Candlestick Pattern: In the area of technical analysis in financial markets, chart patterns play an important role in identifying potential trading opportunities. One of the patterns that traders frequently encounter is the high wave pattern. In this article, we will explain what the high wave candlestick pattern is, its characteristics, what it means, and how you can trade using this pattern.
high wave candlestick pattern
high wave candlestick pattern It is a neutral candlestick pattern with a small body and large upper and lower wicks. Here the body of the candle can be red or green. This pattern indicates that there was movement in both directions in the price of the security, but the session ended without buyers or sellers gaining significant control.
This pattern can indicate a potential trend reversal after a significant uptrend or downtrend and can also be used as a continuation pattern.

Characteristics of High Wave Candlestick Patterns
The following points provide an analysis of high wave patterns and explain what they imply while occurring in a security.
- Small physical body: In a high wave pattern, the actual body of the candle is usually small, indicating that there is little difference between the open and close prices during the trading period. Here the color of the candlestick pattern can be green or red.
- Long top and bottom shadows: Another important characteristic of a high wave pattern is the presence of long upper and lower wicks. A long lower wick means that sellers failed to push the price lower, while a long upper wick means that buyers failed to push the price higher during the trading session.
- indecision: High wave patterns reflect indecision, with neither buyers nor sellers able to establish control over the security. This indecisiveness often occurs after a large sustained period of price movement and signals a potential price reversal or continuation of the security.
Importance of High Wave Candlestick Patterns
- Reversal potential: High wave patterns often occur at major support or resistance levels, indicating a possible reversal in the general trend. When a pattern forms after a prolonged uptrend or downtrend, it means that market sentiment has changed and a reversal is imminent.
- Continued signal: In some cases, high wave patterns can also act as continuation signals, especially in strongly trending markets. When a pattern forms in the context of a dominant trend, it means the market is taking a moment to catch its breath before resuming its upward or downward movement.
Also read…
High Wave Candlestick Pattern – Trading Strategy
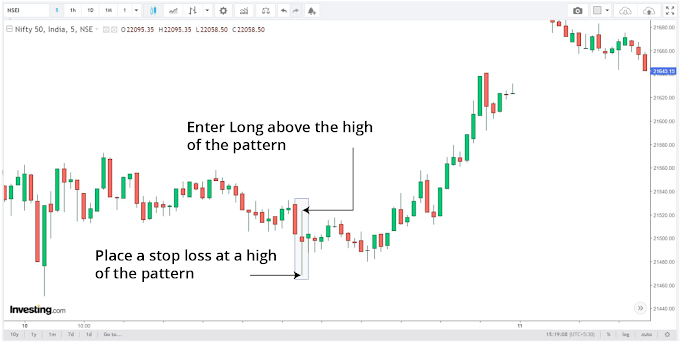
Long position using high wave candlestick pattern
If this pattern appears during a downtrend, look for further confirmation of a bullish reversal in the security because the high wave pattern indicates indecision between buyers and sellers. Additional confirmation could be an additional green candle to validate the entry after the high wave pattern. . Additionally, the best scenario for this pattern to occur is close to the support level.
entry: If, after a high wave pattern, the price starts trading above the high point of the validation candlestick, you enter a buy position on the security.
Stop Loss: The stop loss for this trade should be set near the high of the candlestick pattern.
Profit Target: The profit target for this trade can be based on risk to reward or immediate resistance level. You can also track your stop loss and ride the trend until your stop loss occurs.
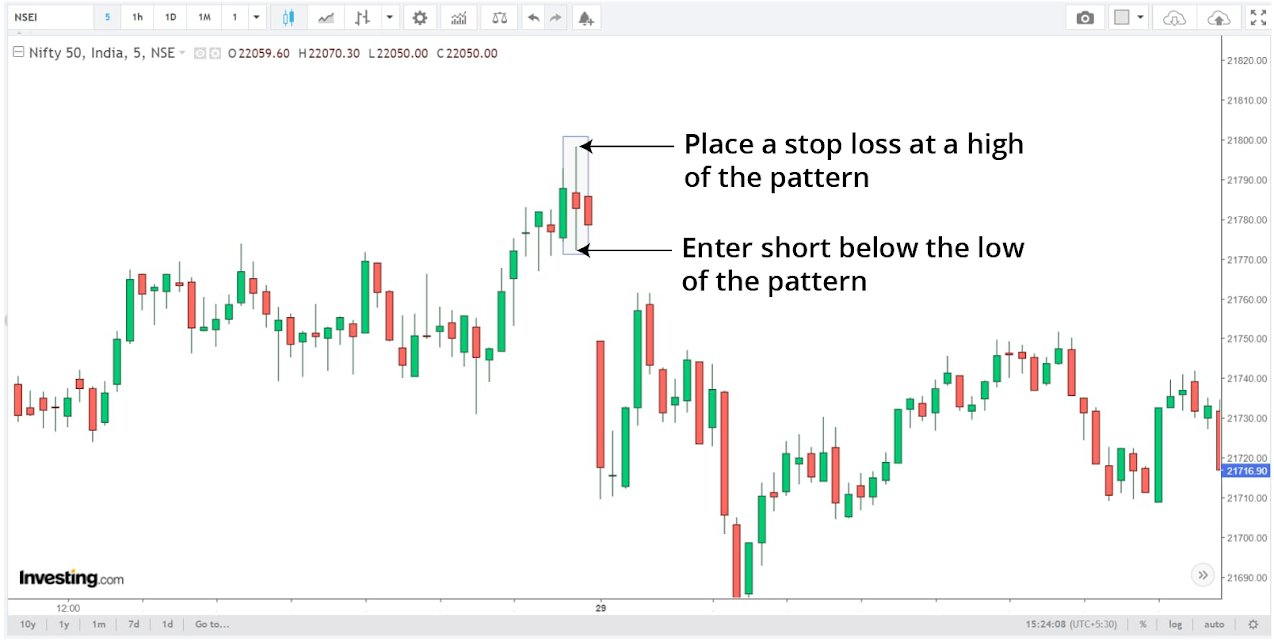
Short position using high wave candlestick pattern
If this pattern appears during an uptrend, look for further confirmation of a bearish reversal in the security as the high wave pattern indicates indecision between buyers and sellers.
This could be an additional red candle after the high wave pattern to confirm your entry. Additionally, the best scenario for this pattern to occur is close to a resistance level.
- entry: If, after a high wave pattern, the price starts trading below the low of the validation candlestick, you enter a sell position on the security.
- Stop Loss: The stop loss for this trade should be placed near the low of the candlestick pattern.
- Profit Target: The profit target for this trade can be based on risk to reward or level of immediate support. You can also follow a stop loss and ride the downtrend until your stop loss is hit.
conclusion
The high wave candlestick pattern is a versatile candlestick pattern that can provide valuable insight into market sentiment and potential price movements. Traders who understand the nature and importance of these patterns can use them to strengthen their trading strategies and make more informed decisions in the financial markets.
However, like any other technical analysis tool, high wave candlestick patterns are not perfect and should be used in conjunction with other indicators and analysis techniques for optimal results.
written by aaron
by utilizing stock screener, stock heatmap, Backtesting Portfolioand stock comparison The tools on the Trade Brains portal give investors access to comprehensive tools to identify the best stocks, stock market newsBe aware and invest well.

Start your stock market journey now!
Want to learn stock market trading and investing? Check out exclusive stock market courses from FinGrad, a learning initiative from Trade Brains. You can sign up for free courses and webinars from FinGrad and start your trading career today. Sign up now!!


