What is a Stochastic Oscillator? – Analysis and Forecast – February 13, 2024

What is a Stochastic Oscillator?
A Stochastic Oscillator is an indicator that compares the most recent closing price of a security to its highest and lowest prices over a specific period of time. It provides a reading that moves (oscillates) between 0 and 100 to indicate the security’s momentum.
A stochastic reading is basically the trading range of a security over a specific period of time, expressed as a percentage. (The default setting for the Stochastic Oscillator is 14 time periods (hourly, daily, etc.).) 0 represents the lowest point of the trading range. A reading of 100 represents the highest point during the specified period.
Stochastic Oscillator Formula
The formula for calculating the Stochastic Oscillator is:
%k = (Close price – Lowest price)/(Highest price – Lowest price) x 100
%D = 3-day SMA of %K
where:
- C is the final closing price.
- The trough is the lowest point of the period.
- The high is the highest price for that period.
oscillator history
Dr. George Lane developed the Stochastic Oscillator in the late 1950s for use in technical analysis of securities. Lane, a financial analyst, was one of the first researchers to publish research papers on the use of probability theory. He believed that this indicator could be used profitably in conjunction with Fibonacci retracement cycles or Elliott Wave theory.
Lane pointed out that the stochastic oscillator represents the momentum of price changes in securities. It is not a trend indicator for price like a moving average indicator for example. An oscillator compares the position of a security’s closing prices relative to the high and low prices (maximum and minimum) of its price range during a specific period. In addition to measuring the strength of price movements, oscillators can also be used to predict market reversal turning points.
Use of Stochastic Oscillator
Following are the main uses of stochastic oscillators:
Identify overbought and oversold levels
A stochastic reading above 80 indicates overbought levels. A reading below 20 indicates the market is oversold. A sell signal occurs when the oscillator reading goes above the 80 level and then returns to below 80. Conversely, if the oscillator moves below 20 and then returns to above 20, it is a buy signal. Overbought and oversold levels are when the security’s price is near the top or bottom, respectively, of its trading range for a specific period of time.
quarter
A divergence occurs when a security’s price hits a new high or low that is not reflected in the Stochastic Oscillator. For example, the price moves to a new high, but the oscillator does not move to a new high accordingly. This is an example of a bearish divergence, which can signal an imminent market reversal from an uptrend to a downtrend. The failure of the oscillator to reach new highs following price action indicates that the momentum of the uptrend is starting to wane.
Similarly, a bullish divergence occurs when the market price makes a new low, but the oscillator does not follow suit and moves to a new low. A bullish divergence indicates that the market is likely to turn upward in the future.
It is important to note that the Stochastic Oscillator may send divergent signals some time before the direction of price movement changes. For example, if an oscillator signals a bearish divergence, the price may continue to rise for several trading sessions before turning to the downside. This is why Lane recommends waiting until there is some confirmation of a market reversal before entering a trading position. Trading should not be based solely on divergence.
crossover
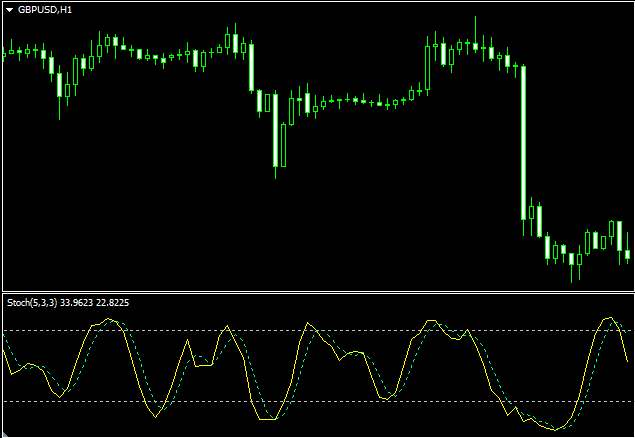
Crossover refers to the point where the fast and slow probability lines intersect. The fast stochastic line is the 0%K line, and the slow stochastic line is the %D line. If the %K line intersects and rises above the %D line, this is a bullish scenario. Conversely, a %K line crossing above and below the %D stochastic line provides a bearish sell signal.
Limitations of the Stochastic Oscillator
The main disadvantage of oscillators is their tendency to produce false signals. This is especially common in turbulent and volatile trading situations. This is why the importance of checking the trading signals of the Stochastic Oscillator along with those of other technical indicators is emphasized.
Traders should always keep in mind that oscillators are primarily designed to measure the strength or weakness of market price movements, not the trend or direction.
Some traders aim to reduce the Stochastic Oscillator’s tendency to generate false trading signals by using more extreme readings of the oscillator to indicate overbought/oversold conditions in the market. Instead of using readings above 80 as a borderline, only readings above 85 are interpreted as indicating overbought conditions. On the bearish side, only readings below 15 are interpreted as indicating oversold conditions.
Adjusting to 85/15 reduces the number of false signals, but may also cause traders to miss some trading opportunities. For example, during an uptrend the oscillator reaches a high reading of 82 and then when the price turns bearish, the oscillator is above the required overbought indicator level of 85.
If you don’t like the standards stochastic oscillatorYou can try: Advanced stochastic scaler:
A final word on oscillators
The Stochastic Oscillator is a popular and widely used momentum indicator. Traders often use oscillator divergence signals to identify possible market reversal points. However, oscillators tend to produce false signals. Therefore, it is best used in conjunction with other technical indicators rather than as a standalone source of trading signals.


