What is OrderBook and how to use it? – Analysis and Forecast – July 31, 2024

Definition of order book and position book
an order sheet It is a basic component of financial trading that lists buy and sell orders for a particular asset. It organizes these orders by price level to show the supply and demand dynamics of the market. In the context of forex trading, the order book includes pending or limit orders such as buy stop, buy limit, sell stop, sell limit, and stop loss and take profit for a trader’s position.. This structured overview provides traders with insight into where market participants are looking to execute trades.
Position BookUnlike the order book, it records open positions held by traders. It includes both buy and sell positions and reflects current trading activity in the market. The position book visualizes open trades, allowing traders to identify prevailing trends and situational sentiment based on the distribution of these active positions at different price levels.
You can download and purchase this great tool here: Ziwox Live OrderBook
Why are trades important?
The order book is very important to traders as it provides real-time insight into market sentiment and movements. Analyzing the order book allows traders to detect both support and resistance levels, which can have a significant impact on their trading strategy.
Additionally, the order book acts as a leading indicator, providing early signals of potential price movements, allowing traders to make informed entry and exit decisions.
Position books are equally important, as they provide a comprehensive view of a trader’s current market positions. By studying these open trades, traders can gauge overall market sentiment and predict future price movements based on active positions. This information helps traders manage risk effectively while adjusting their strategies to suit existing market dynamics.
Advantages of OrderBook and PositionBook
The advantage of the order book is improved market transparency, as it displays order quantities and prices. This transparency allows traders to understand prevailing supply and demand dynamics, which helps them make trading decisions. Additionally, the order book allows traders to react quickly to changing market conditions.Optimize and manage your trading activities. their optimal location Cut your losses and realize your profits.
And speaking of position books, they offer a significant advantage by showing active trading positions that reflect the real-time sentiment of market participants. This insight allows traders to identify trading trends and make informed decisions about their strategies. In addition, position books help manage risk by clearly showing the positions currently held, which helps traders gauge potential market movements and analyze future movements by checking the size of their profit and loss positions. Amazing.
Traders can anticipate upward or downward pressure by analyzing the accumulation within the order book and position book. For example, a significant cluster of stop loss orders often indicates a potential price target, while a concentration of limit orders near the current market price indicates support or resistance levels. Position books also provide a glimpse into potential directional pressure by revealing clusters of open buy or sell positions that could influence future price movements..
To summarize, here it is:
- Market Psychology: Is the Market in the Hands of Buyers or Sellers?
- Find probabilistic support and resistance levels (supply and demand)
- Find out the trader’s stop loss and take profit levels. This will help you know where and how the trader can stop hunting!
- determined The number of traders and positions with profits or losses to predict the next market movement.
Let’s take a closer look.
How to read the order form
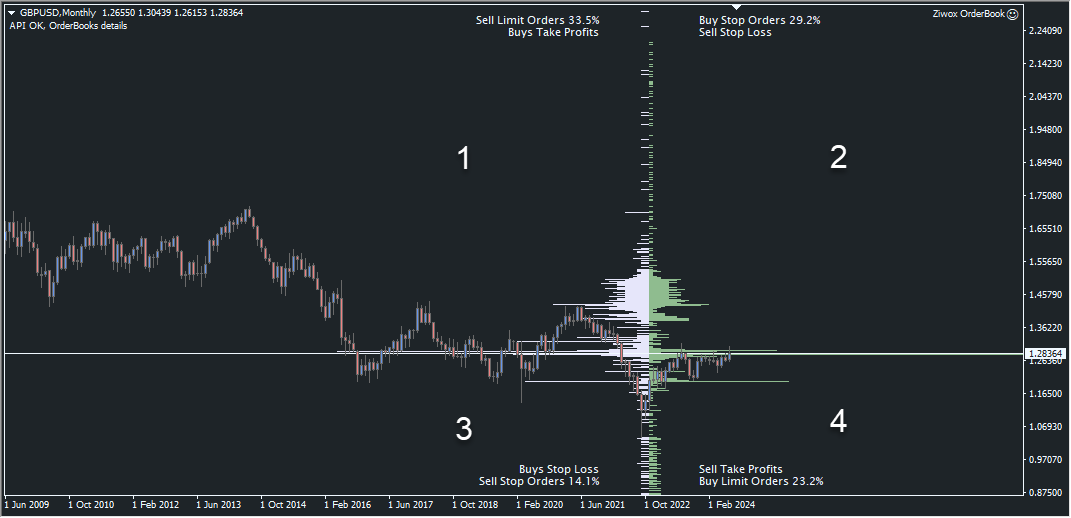
Image 1, GBPUSD an order sheet
See Figure 1
The order book, market limit orders, are divided into two sides and displayed on the left. Histogram (white bar) Reflect Sales order. Right (green) is a buy limit order. Traders can take advantage of the dual histogram representation. Traders can see areas where there is significant compression of orders, indicating potential support or resistance levels. The relationship between the two histograms provides a comprehensive picture of market dynamics and general market trends.
So we separate the histograms of these two sides with more details.
- Area 1, Sell limit orders and take profit orders including buy positions.
- Area 2, Buy stop loss order including sell stop loss
- Zone 3, Sales Stop Orders including purchases location Cut your losses.
- Zone 4, including buy limit orders and sell position profit taking orders.
If you look deeper, you can find levels that are important to traders. Peaks are composed of more volume and orders, while valleys have fewer orders set by traders. Longer levels have more orders.
In particular, all peaks correspond to price peaks on the chart. You have to search and find clues like a detective!
Please look at Figure 1 and focus on it. 1.16555 This is the price zone. A huge number of orders were placed at this level. Is it interesting that this number is exactly at the level where there was a very strong shadow on February 1st?
Is it interesting that this huge volume of buy limit orders is at exactly the same level as on February 1st? If you look at the big picture, shadow Were you pulled out by strong demand?
This huge number of orders could be our support and resistance levels, which are liquid and act like a magnet for price.
The nice thing about this part is that you can see where many other people’s stop losses are, and this point will help you know when and at what price to stop hunting 🙂
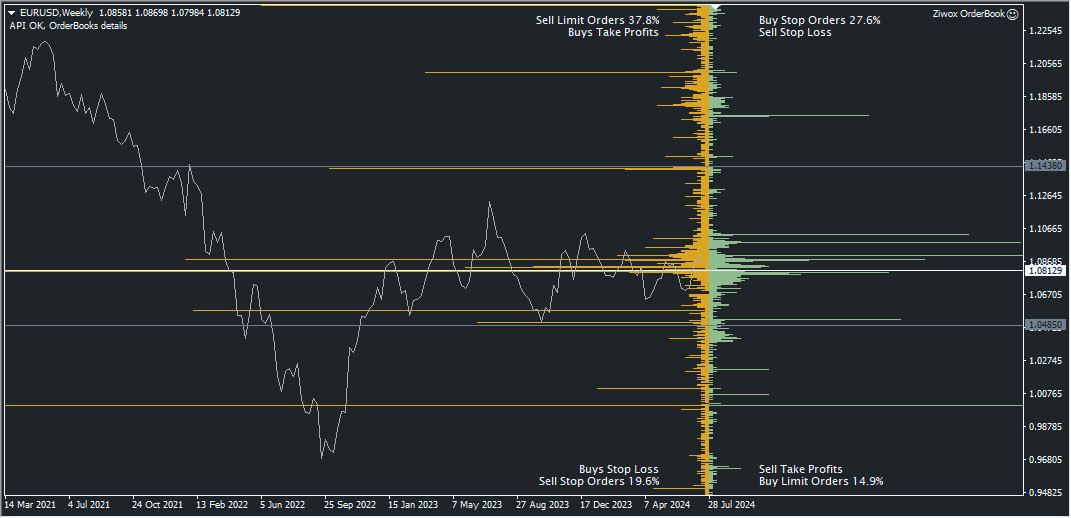
Image 2, EUYRUSD order book
Let me explain with more examples. Look at image 2. Buy orders are accumulated from 1.08129 to 1.0485 level, and these buy orders are stopped at 1.0485 area. It matches beautifully with the price upper and lower limits on the chart. Or find the price level 1.14380. If you are familiar with ICT trading method, you will find a downtrend, base, and downtrend at that level. There is exactly the same as a huge sell limit order.
Now let’s take a closer look at PositionBook.
How to read PositionBook
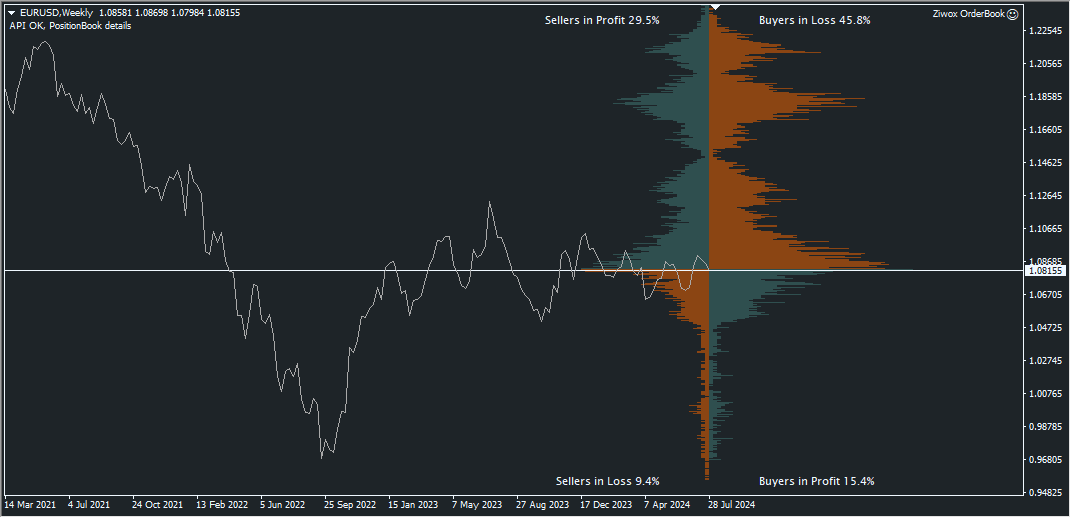
Image 3, EURUSD Position Book
In PositionBook, you don’t just see the number of positions. What does it mean when there are many buyers below the current market price? It shows you how many buyers are profitable and all the long positions above the market price are at a loss. How does this help us? Do you think all these losses will be closed soon? Or on the contrary, if there are many short positions that are profitable. The short positions are closed at a profit and when the short positions are closed, the price goes up as the new long positions. Do you get the point? Is that right?
The PositionBook histogram has four areas based on left (sell) and right (buy) positions, and contains positions above or below the current market price.
- Top left area, profitable sellers
- Top right area, buyer who has suffered a loss
- Bottom left area, seller who has suffered a loss
- At the very bottom Right area, buyer benefits
How to use and trade?
Market sentiment
To derive market sentiment from the order book, traders can analyze the volume of buy and sell orders. An increase in the volume of buy orders generally indicates bullish sentiment, while an increase in the volume of sell orders indicates bearish sentiment. Additionally, by reviewing key clusters of pending limit orders, traders can determine important support and resistance levels, which indicate points in the market where prices may stabilize or reverse.
Finding Support and Resistance Levels

Image, AUDUSD order book, support and resistance levels
Support and resistance levels can be identified using the volume of pending orders within the order book. For example, a large number of buy limit orders at a certain price point may indicate strong support, suggesting that the price is unlikely to fall below that level. Conversely, a large number of sell limit orders may indicate resistance, suggesting that the price may have difficulty rising above that point. These levels help traders determine where to enter or exit a trade based on the expected price movement.
Finding the optimal level for stop loss and take profit
When setting stop loss and take profit levels, traders should use their order book insights. It is recommended to place stop losses beyond significant support or resistance levels to avoid being triggered prematurely during a potential stop loss hunt. In addition, analyzing order flow can identify areas where numerous stop losses are concentrated, and setting levels at a reasonable distance from these targets can prevent traders from being hunted. By adopting a sound strategy based on historical order book data, traders can manage their risk more effectively by improving the efficiency of their stop loss and take profit levels.
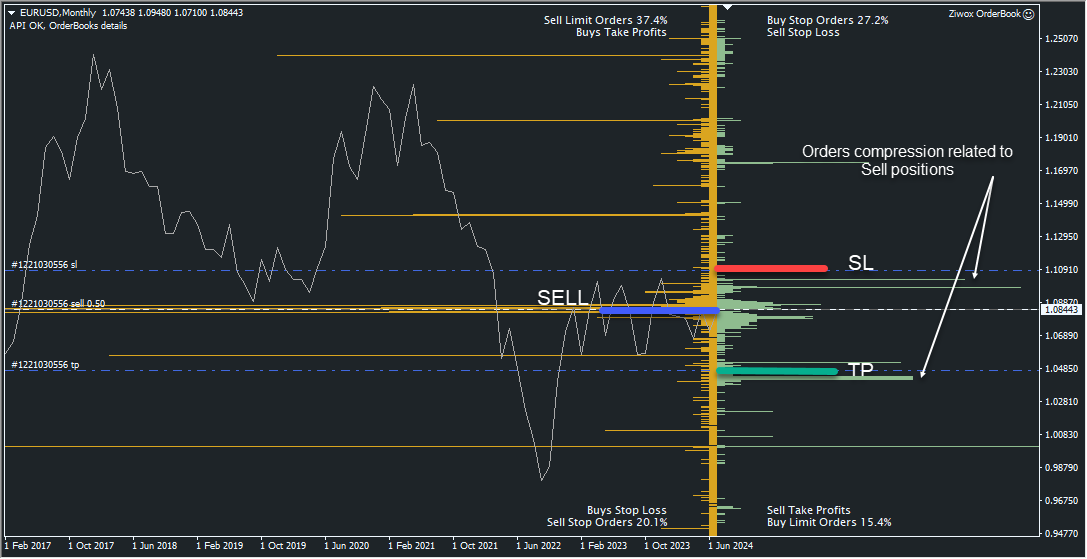
To understand better, imagine opening a buy position, placing a stop loss and taking profit. There are hundreds or thousands of traders like you. Positions, stop loss and take profit are displayed in the order book as shown in the image below.
There is a significant buy limit there, which is a major market support. It is a price magnet, and the reason is liquidity. Always make sure your SL is below this level.

Get the signal with loss Victory Transactions are cumulative
Losing trade: Analyzing situations where losing trades are concentrated in a suitable position book can suggest areas where prices may rise again after those positions are closed.
You can see an overview of open trades in the position book. Positions are loss and positions are profit. Usually, traders wait for unprofitable positions and try to close profitable trades sooner than losses. Profitable trades are closed about twice as fast as losing trades, and stop losses are usually placed at twice the take profit price. The point is this:
- As loss sellers accumulate, sell positions are closed out with buy positions, causing the price to rise.
- accumulation When a buyer loses, the price falls because the buy position is closed by the sell position.
In the order form
- When a stop loss occurs in the sell histogram (the order book on the left), it indicates that buyers are being pushed out of the market.
- The display of TakeProfit in the upper left corner of the OrderBook indicates that the buyer has been pushed out of the market due to TakeProfit.
- Conversely, a stop loss occurring in the buying histogram area indicates that sellers are out of the market.
Even if there are limit and stop orders in the order book, they do not guarantee execution when the price reaches that level. These orders may be moved or canceled.
Winning Deal: Conversely, if there are a significant number of profitable trades, a sharp close may indicate a potential market reversal as prices may move in the opposite direction.
As mentioned earlier, profitable trades are closed much earlier than losing trades. Therefore, a profitable long position is: They are temporary, close soon, and sometimes have skyrocketing prices. It’s about turning a profitable trade into a losing trade.
If you’re smart, you’ll always get these counter trends.
- close Victory Long position, market down
- close Victory Selling positions encourages market uptrend
Would you like to try this tool?


