Will the Bulls make a comeback?

Ethereum price began a downward correction at the $3,885 resistance zone. ETH is now back below $3,800 and may continue to fall towards $3,720.
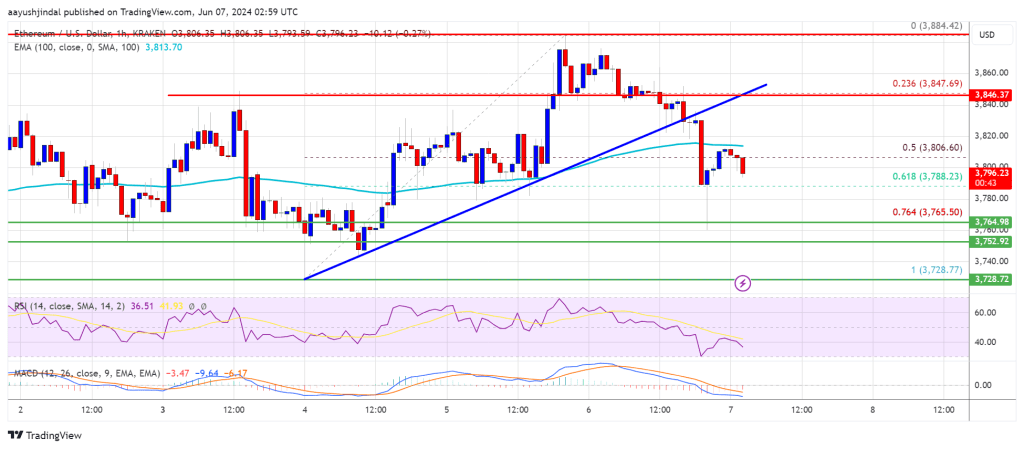
- Ethereum began a downward trend after failing to clear resistance at $3,880.
- The price is trading below $3,840 and the 100-hour simple moving average.
- On the hourly chart of ETH/USD (data feed via Kraken), a break has occurred below a key bullish trendline with support around $3,830.
- As long as the pair fails to close below the $3,720 support, the pair could start a new uptrend.
Ethereum price falls again
Ethereum price rose above the $3,840 resistance zone. However, ETH struggled to break out of the $3,885 level and began a Bitcoin-like downward correction.
It fell below the $3,840 support level. Additionally, a break occurred below a key bullish trendline supporting around $3,830 on the hourly chart of ETH/USD. The pair fell below the 50% Fib retracement level of the bullish wave from the $3,730 swing low to the $3,885 high.
Ethereum is currently trading below $3,840 and the 100-hour simple moving average. However, bulls remain active near the 61.8% Fib retracement level of the bullish wave from the $3,730 swing low to the $3,885 high.
If there is another increase, ETH may face resistance near the $3,810 level. The first major resistance is near the $3,840 level. An upside reversal above the $3,840 resistance could push the price higher. The next major resistance level is $3,920, above which the price may gain traction and advance towards the $4,000 level.
If bulls push Ethereum above the $4,000 level, the price could move higher and test the $4,080 resistance. Further gains could lead Ether towards the $4,200 resistance zone.
Will there be more losses in ETH?
If Ethereum fails to clear the $3,840 resistance, it may continue to fall. Initial support on the downside is near $3,765. The next major support level is near $3,750.
The main support level is $3,720. A clear break below the $3,720 support could push the price towards $3,650. More losses could push the price towards the $3,550 level in the near term.
technical indicators
Hourly MACD – ETH/USD MACD is gaining momentum in bearish territory.
RSI per hour – The RSI for ETH/USD is now below the 50 area.
Key Support Level – $3,765
Key Resistance Level – $3,840


