Will USO Soar to $83? Here are the Key Levels to Watch! | Don’t Ignore This Chart!

key
Takeaway
- WTI crude oil prices are expected to rise due to fundamental, technical and seasonal factors.
- Seasonality and other indicators suggest swing trading opportunities exist in the United States Oil Fund (USO).
- Supply and geopolitical factors can rapidly change market and trade conditions.

Oil prices rise after EIA reports surprise inventory shortfall. Adding fuel to the fire? Tensions in the Middle East.
WTI crude oil has been trading volatile since March 2023. Macroeconomic and geopolitical factors influencing prices are mixed at best. Given the current inventory decline, seasonal factors, and ongoing geopolitical uncertainty, could there be an upside opportunity?
Let’s look at the United States Oil Fund ETF (USO) as a proxy for WTI crude oil. How has its seasonal performance been over the past five years? Compared to the S&P 500?
USO: 5-Year Seasonal Performance vs. S&P 500
In terms of seasonality, September is USO’s star month. While it doesn’t have the highest close rate (50%), it shines in terms of relative average returns, boasting a solid 5.5%.
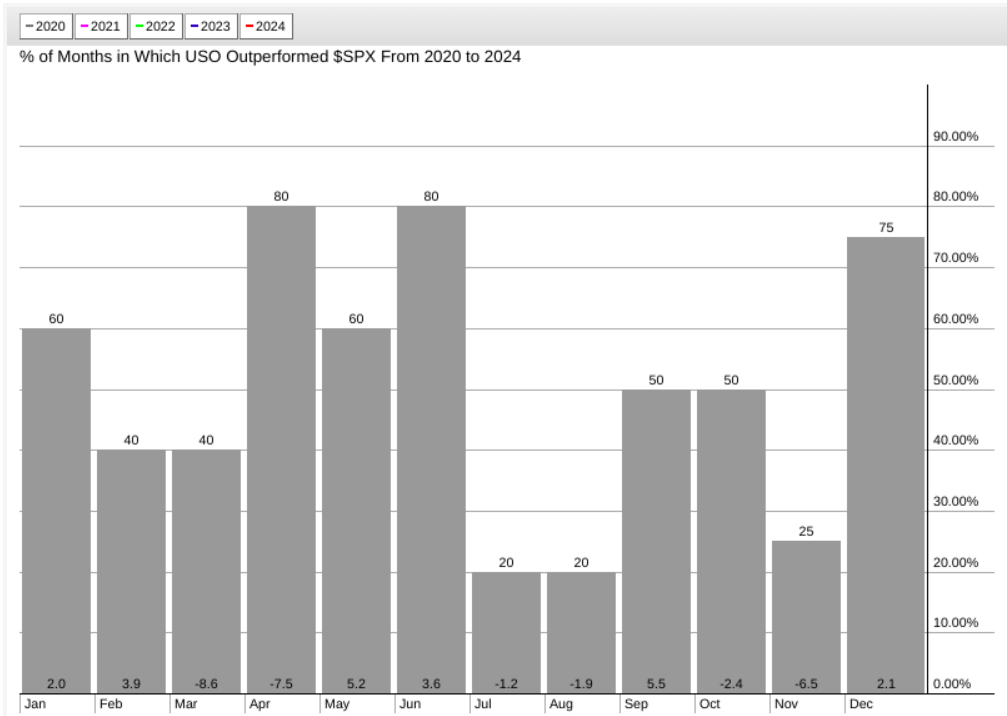
Table 1. Seasonal chart of the USO fund versus the S&P 500. Note the difference between the high closing price (numbers above the bars) and the average relative return (numbers below each bar). Chart source: StockCharts.com. For educational purposes only.
There are many other factors that affect the price of crude oil, so you can’t use this as a crystal ball to predict USO’s movements, but it does provide some context. The real question is: Is the USO gearing up for another climb this September, and if so, how high will it go?
Let’s switch to the weekly chart. Here’s a macro perspective on USO’s price action:
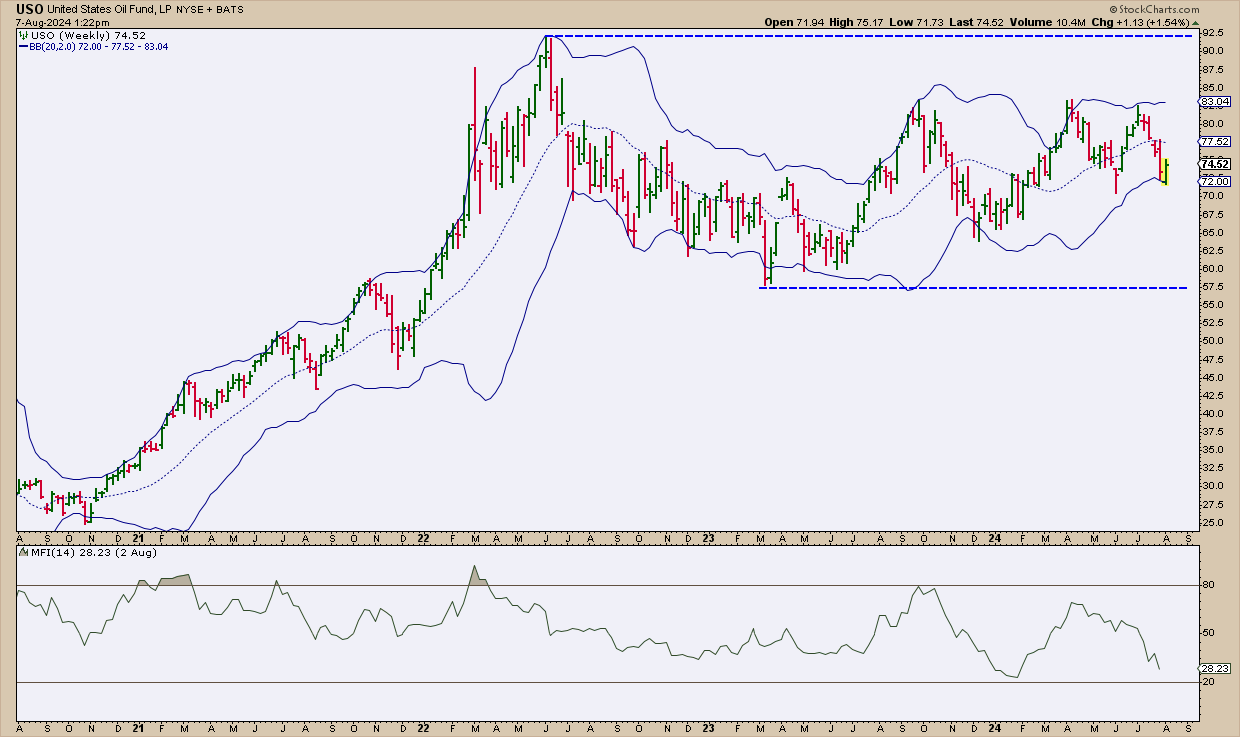
Chart 2. Weekly chart of the United States Oil Fund (USO). Looking at the long-term chart of USO, the price action appears relatively flat and volatile.
Volume Weighted Money Flow Index (MFI) This suggests that USO is at the lower end of its cyclical range. Bollinger Bands® This indicator also supports this concept, but on a smaller time scale.

Note that the range is narrowing slightly and the MFI and Bollinger Bands suggest a possible upside for USO, i.e. a reversion to the mean or a reversion to the upper band. Historical resistance suggests a possible move to the $83 range, which is a tough resistance level to break (it has been tested and failed three times in the past year). The upside is also consistent with the seasonality theory discussed above.
Watch the swing points at $92.50 and $57.50 (blue dotted line). The range is wide, but if the price breaks out of the current $70-83 zone, we can expect strong support and resistance at the upper and lower levels. Also, below $70, there is another support level at $65, which indicates the next swing point, the low of November-December 2023.
If you are only interested in taking advantage of potential uptrends in swing trading, you should take a closer look at price action on the daily charts. Perspective (see chart below).

Chart 3. Daily chart of US Oil Fund ETF prices. There are clear support and resistance levels that are important to watch for swing trades.
Looking at the daily chart, we can see that the buying pressure has been positive, although not as strong, over the past few weeks as USO has fallen. The magenta squares on Chaikin Money Flow (CMF) Highlighting this rather bullish divergence. Does this signal accumulation during the USO price decline?
Probabilistic vibrator USO is entering oversold territory, suggesting a potential upside. September seasonality, inventory reduction, and geopolitical factors all point to short-term strength. If you want to trade this cyclical range, you would probably enter the market now with a tight stop around $70. The upside target would be between $81 and $83.
Despite the uncertainty in this market, if you entered a long position at $74, you would potentially lose $4 for a profit of $9. Your reward to risk ratio would be 2.25:1. Still, move cautiously. If USO continues to rise, see if the trade is still worth it based on your trading objectives and risk tolerance.
The final bell
Oil prices are rising amidst ongoing tensions in the Middle East and a surprising inventory shortage. USO, a proxy for WTI crude, has shown favorable seasonality in September with an average relative return of 5.5%, but it is not a perfect predictor. Technical indicators suggest a possible move to $83. If you are looking to swing trade, proceed with caution. Respect the targets and stop levels outlined above. Good luck!
disclaimer: This blog is intended for educational purposes only and should not be construed as financial advice. Ideas and strategies should not be used without first evaluating your personal and financial situation or consulting a financial professional.

Karl Montevirgen is a professional freelance writer specializing in finance, cryptocurrency markets, content strategy, and art. Karl works with a number of organizations in the stock, futures, physical metals, and blockchain industries. He holds FINRA Series 3 and Series 34 licenses in addition to a dual MFA in critical studies/writing and music composition from the California Institute of the Arts. Learn more


