ZonePro Supply Demand Pro User Manual and Trading Tips! – Trading Strategy – January 27, 2024

ZonePro Supply Demand Indicator User Guide
Multi-timeframe zone warning
New, Existing, Nested, Tested, Area + Trend panels
How to use the Supply Demand Indicator: The indicator shows supply and demand areas (order blocks) where buyers and sellers are willing to take action. The following areas can help you improve your trading:
- Get the best entry point
- Where to Place Your Stop Loss
- Where to put profit taking
supply area : In this area, the sellers are stronger and more numerous than the buyers, so a price zone is created and once the price reaches it again, the price is likely to bounce from that zone. We’ll explain the new and tested areas in more detail below!

demand area: In this area, buyers are stronger and more numerous than sellers, so a price zone is created and once the price reaches it again, the price is likely to bounce from that zone.

In this area, the sellers are stronger and more numerous than the buyers, so a price zone is created and once the price reaches ag, there is a high probability that the price will bounce from that zone.In this area, sellers are stronger and outnumbered than buyers, so a price zone is created and once the price reaches it again, the price is likely to bounce from that zone.
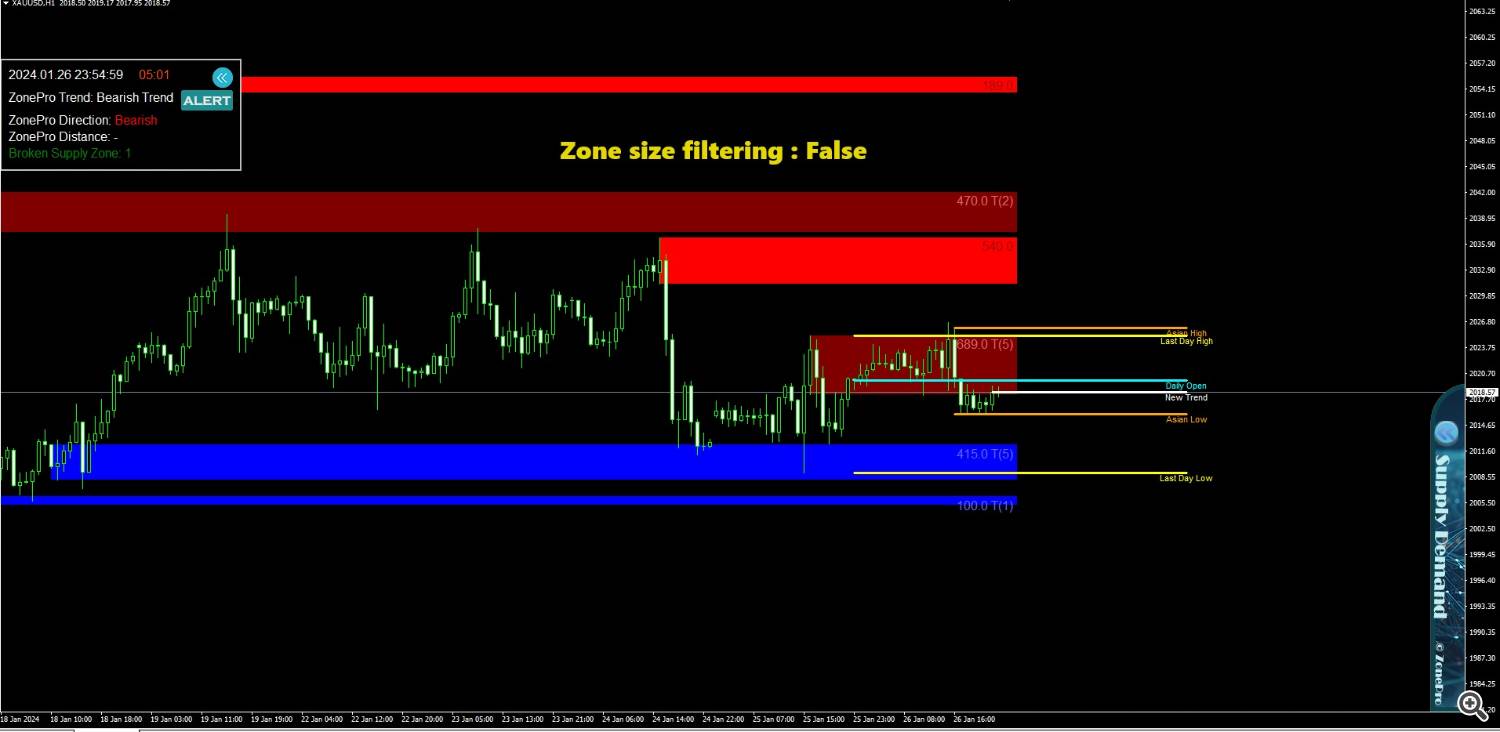
Trends panel: Displays date and time (server), candle time, short-term direction, distance from trend line in pips and supply break zones.

- If the trend line is bullish and the price is above the trend line, the color of the text will be green.
- If the trend line is bearish and the price is below the trend line, the text color will be red.
- If the price goes against the trend line, the text color will be yellow! Watch out for the mix of trends!

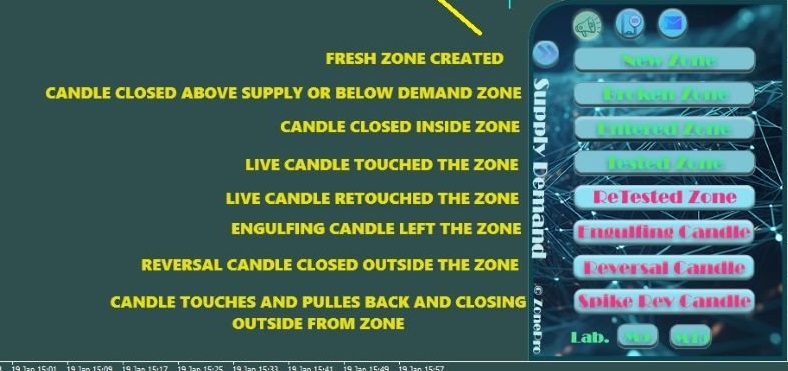
Warning panel: You can set up pop-up notifications, push notifications, and email notifications. You can set up different zone price action alerts.
- Fresh zone, broken zone, touch zone, test zone, retest zone, engulfing candle, reversal candle, spike reversal candle
Zonepro Supply Demand Settings
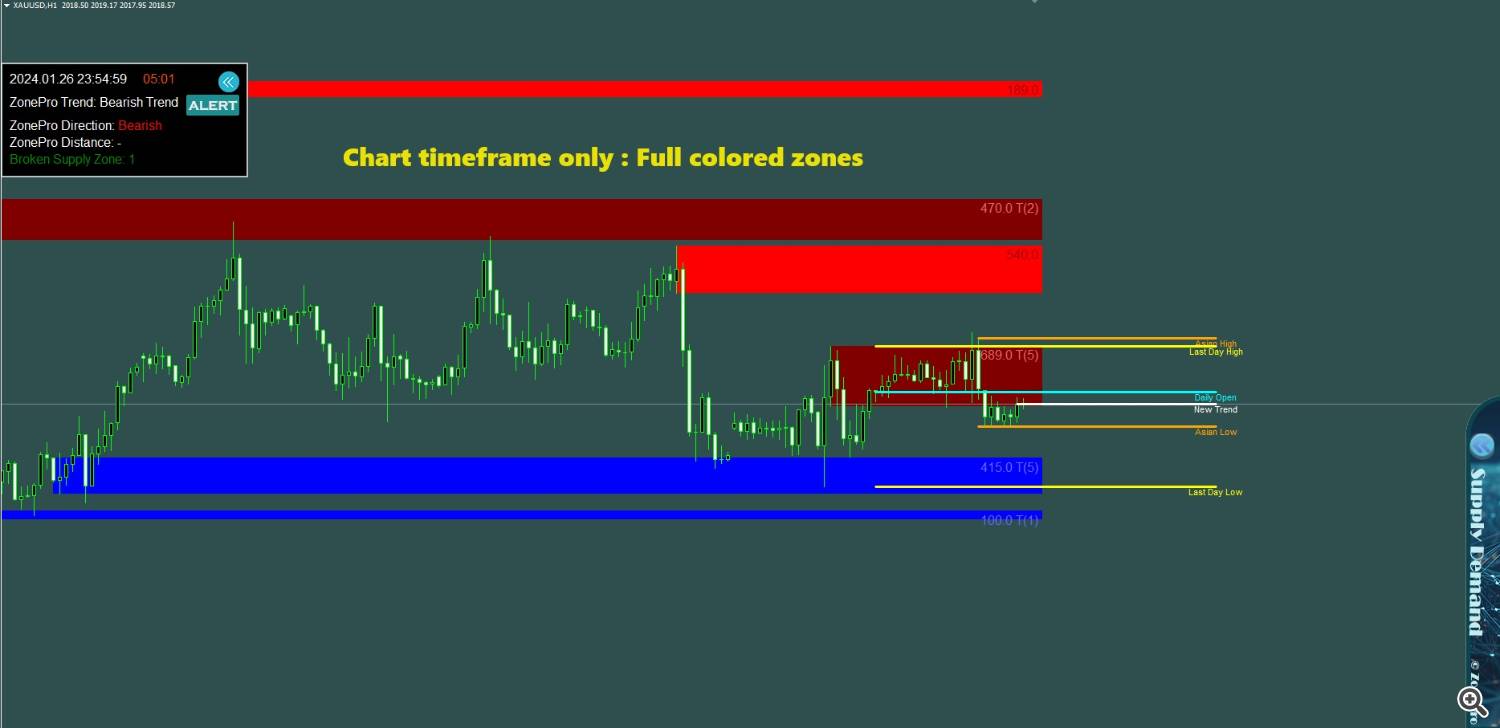
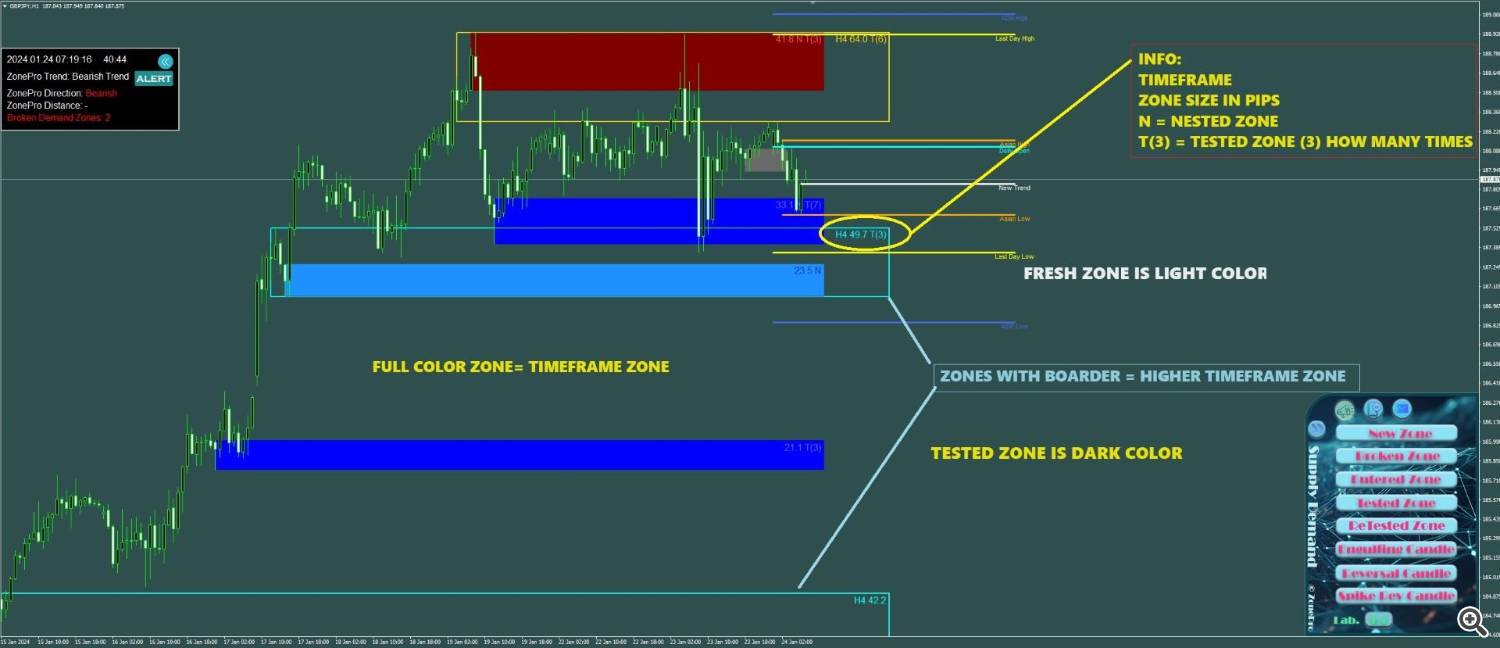
- period to use : Set the number of higher time period areas you want to see on the chart. Chart periods are displayed in full color, with higher periods marked as borders!
setting

Zone:Time zone only
Include higher time periods: When you set a higher time period, you’ll see overlapping areas – the areas inside the higher time period areas!
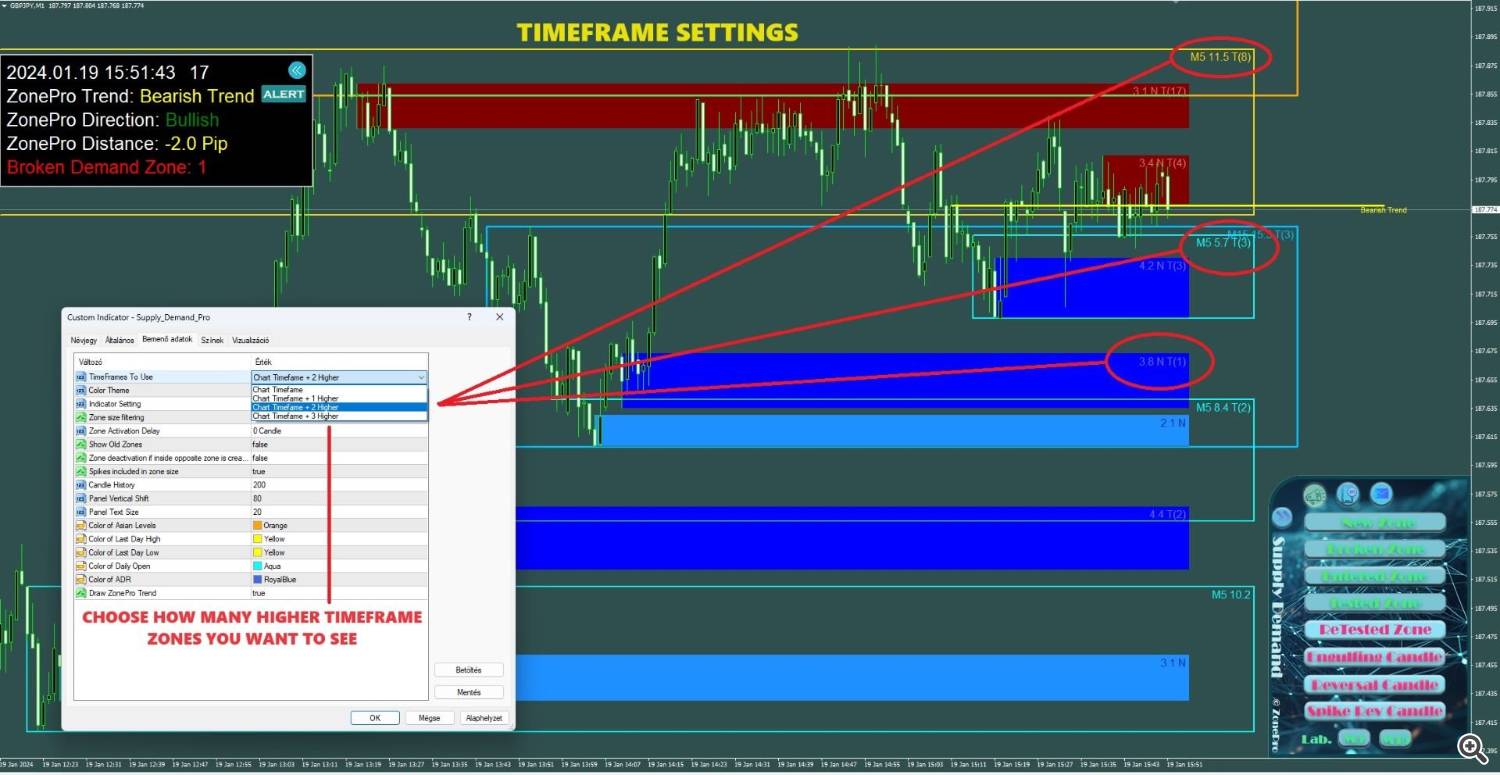
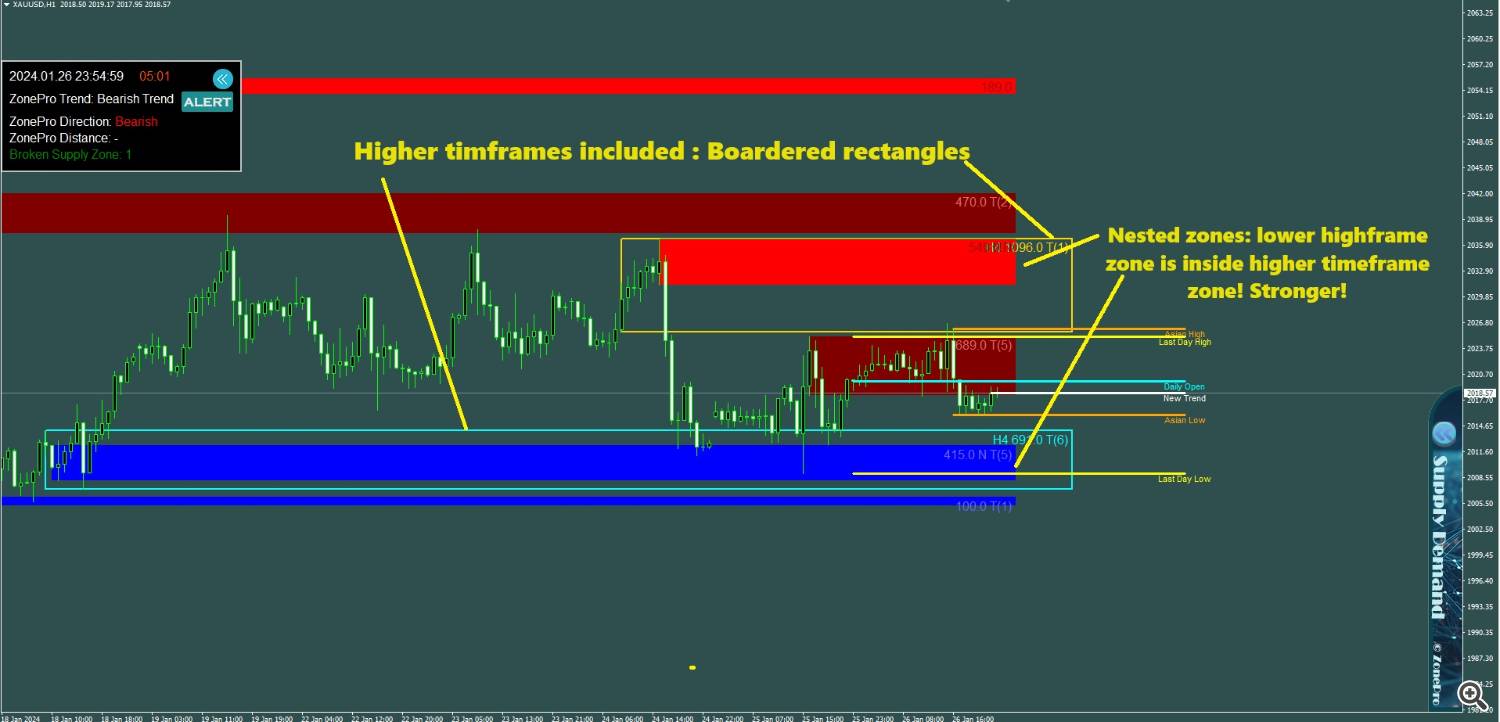
Zone information: Period, Zone size (pips), N= Overlapping zone, T= Tested zone and (3) Number means number of times the zone was tested!
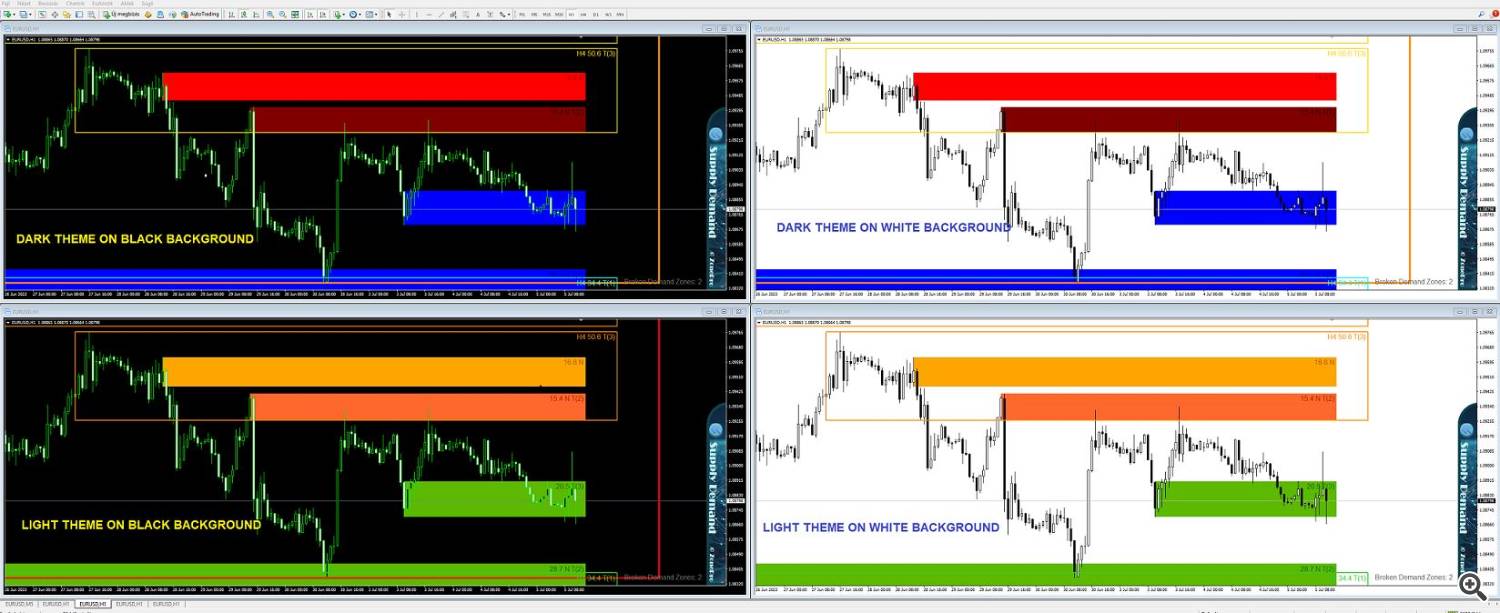
- Color Theme: Set it dark or light.

Other settings:
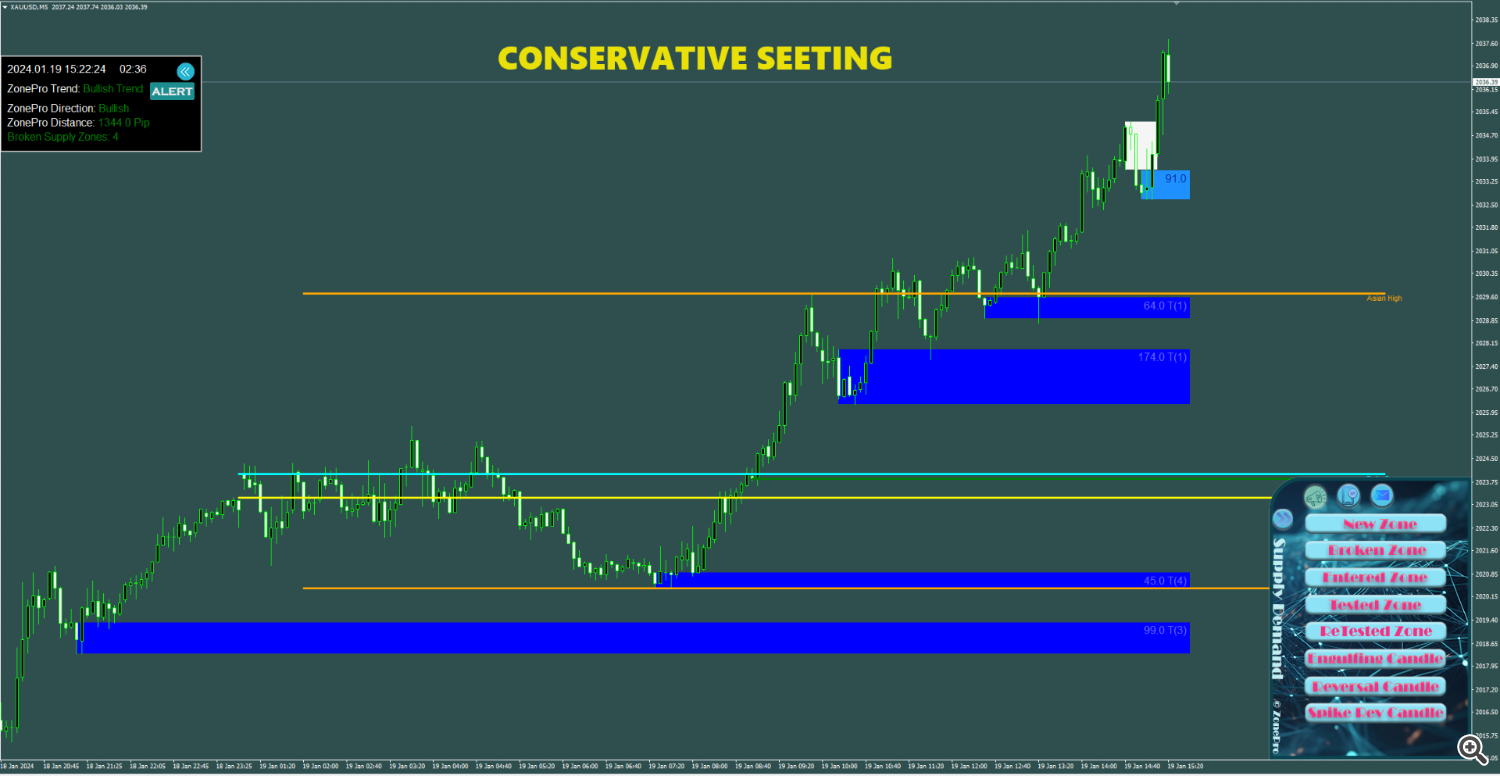
- Indicator settings: Set sensitivity to Normal or Conservative. If you use sensitivity you will receive all areas. If you choose Normal or Conservative, you’ll get fewer zones because they require a larger movement before creating a zone.

Sensitive :
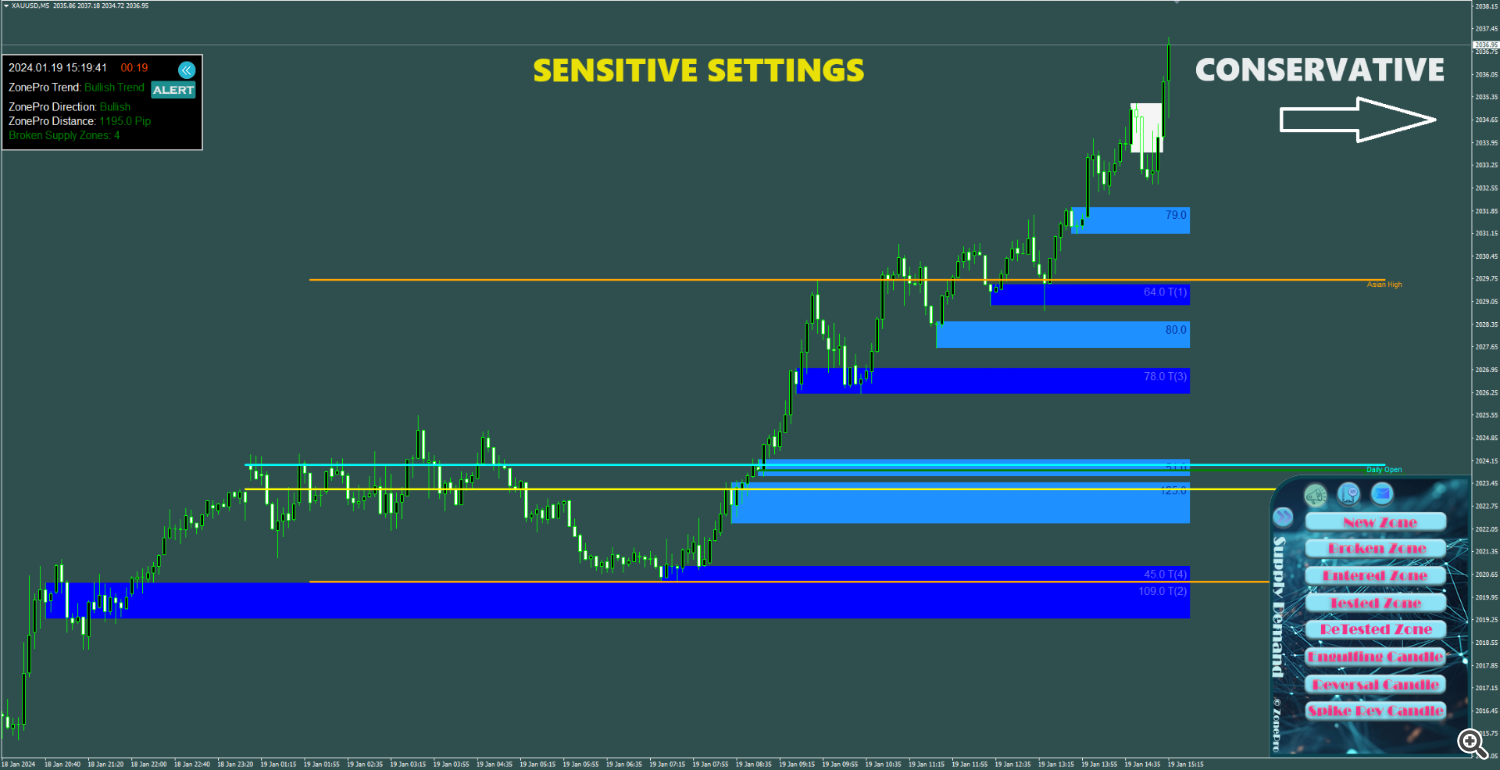
conservative:
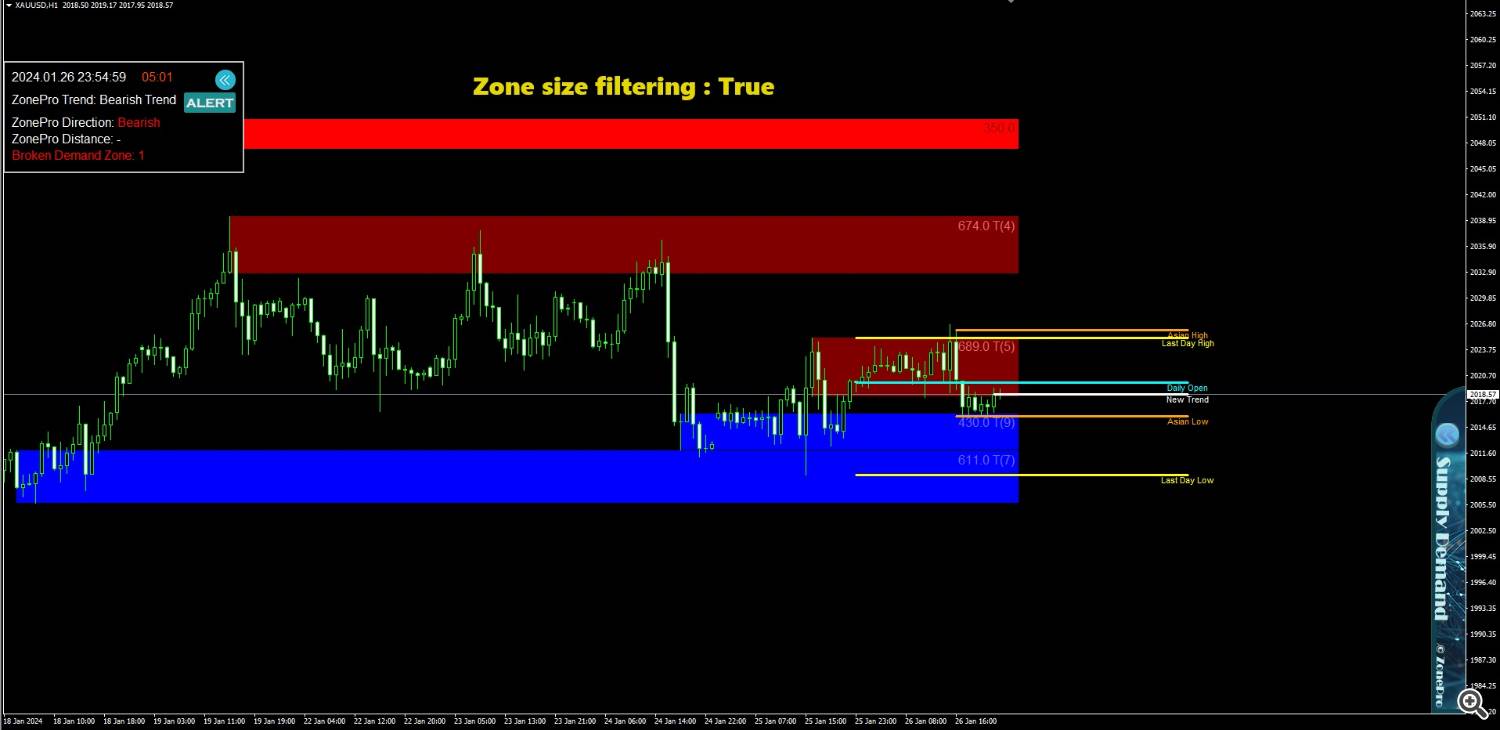
- Filter area size: If set to true, the area will be filtered based on the previous candle size.
lie :
truth:
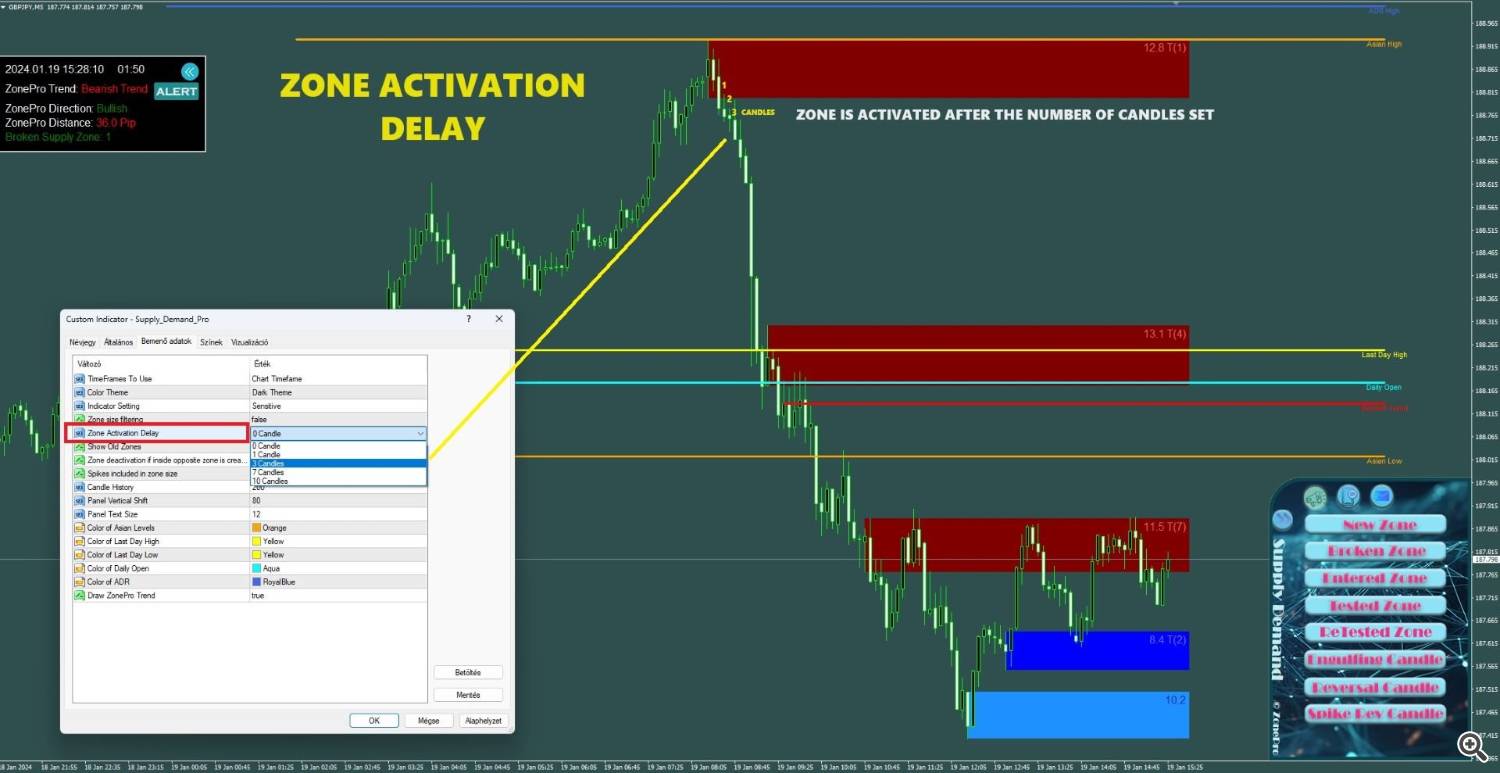
- Zone Activation Delay: Sets the number of candles to wait for an area to pass before being created/activated. Can be set to 0,1,3,7,10. Setting it higher allows price to move further out of the zone before it is drawn. If an area is broken before the candle sets, that area will not be visible!
- Show previous area: Broken areas are indicated on the chart. It could act as a rebound point from the past! Broken areas also allow you to see strong trends clearly, allowing you to see trend changes as well.
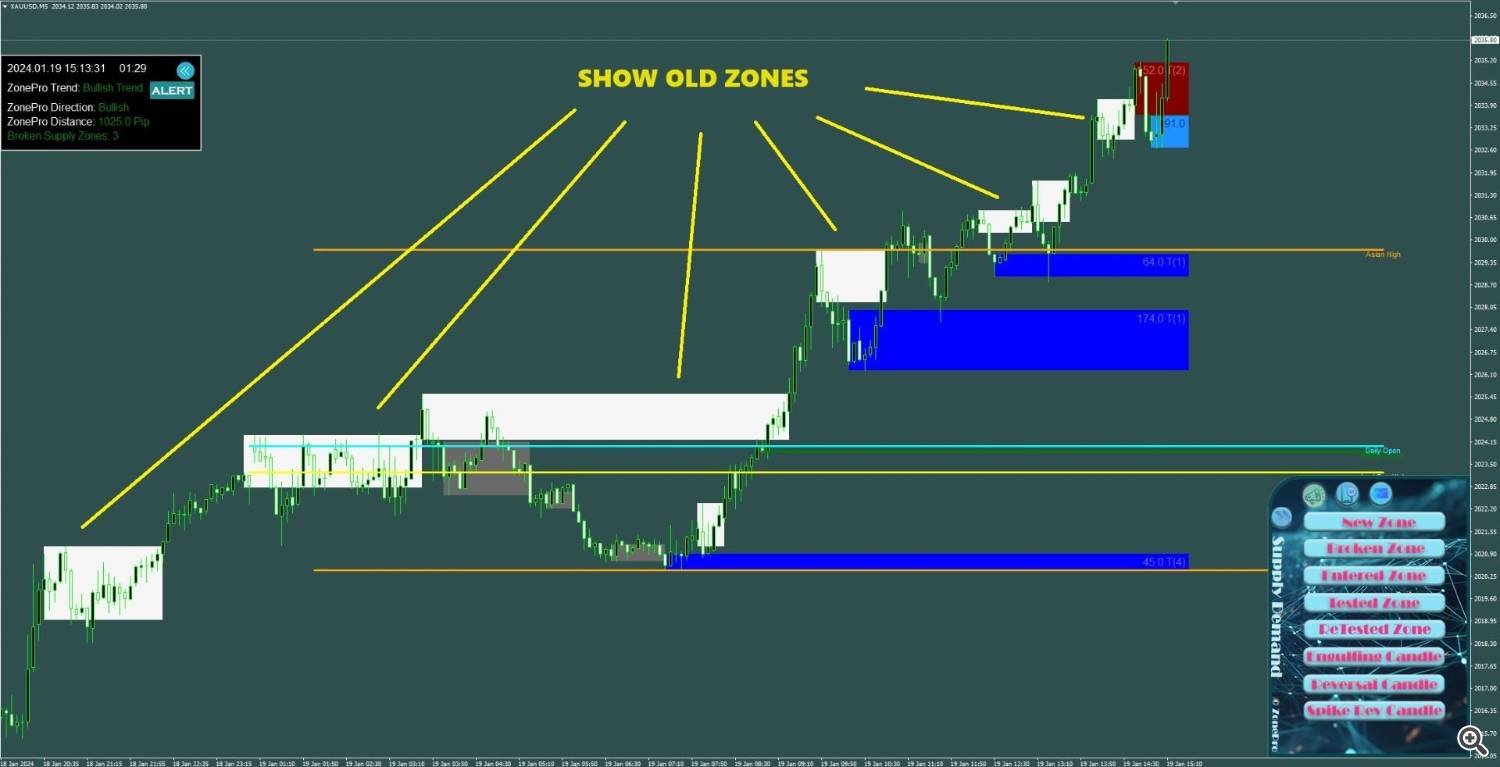
SShow previous area
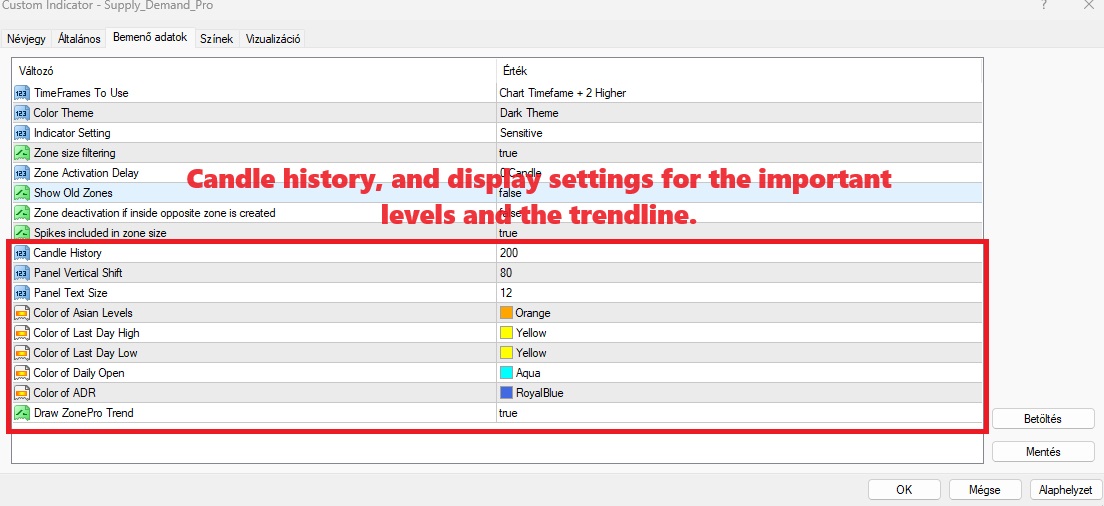
- Indicator settings for candle history and important levels and trend lines.
Now learn some trading tips!
I have some recommendations for how to use Zone, but you have to find your own style!
Let’s proceed according to the warning panel in the chart!
Warning panel:

- How to trade new zones:
a., When the candle is closed close to the area and the trend is equal to the area, the area is created ( Supply = Weak Demand = strong) You can enter a trade by placing a stop loss above/below the area (+ spread for wiggle room) and take profit to the next area or important level or depending on your risk and risk reward settings. Always make sure you have enough space. For price fluctuations!
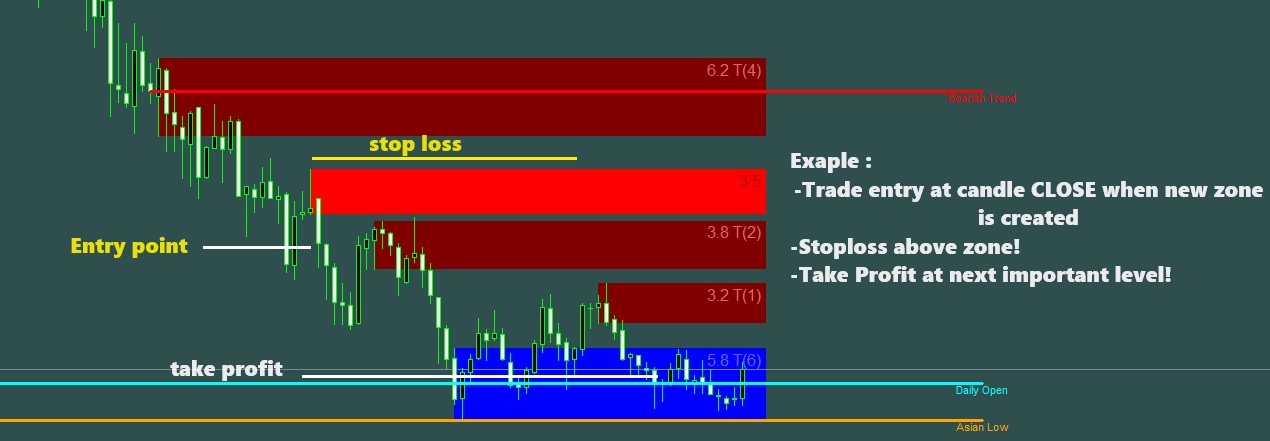
b. Place a limit order at the beginning of the zone using the same stop loss and take profit settings as above!

- How to trade broken areas:
- The same rules apply as for new areas. Use broken areas for stop loss!
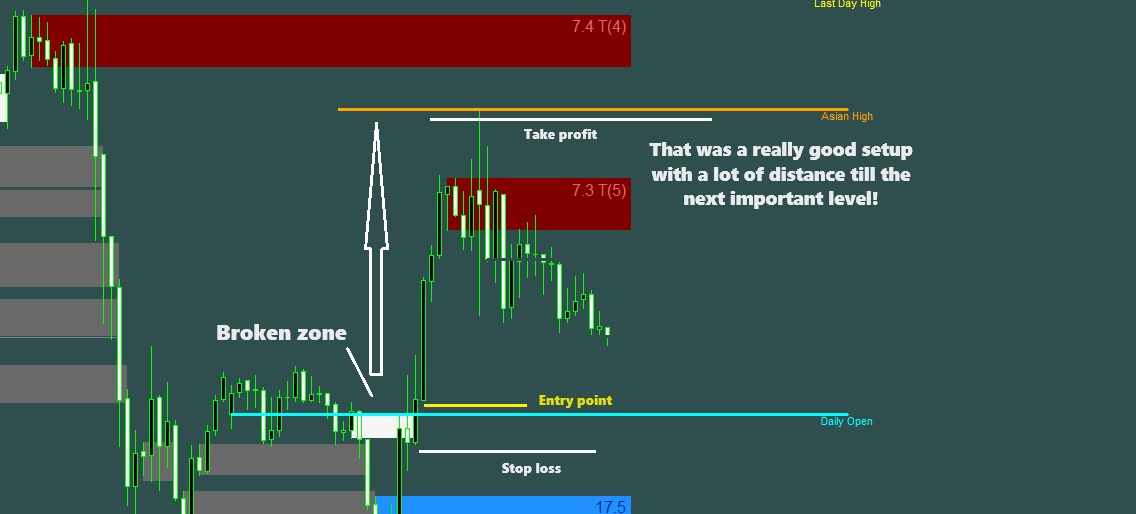
- How to trade entered areas:
a., you can initiate a trade with a market order (place the trade immediately) and set a stop loss above the supply or below the demand zone. You need to do this in the direction of the trend (check the trend panel and see if there is already a broken area in that direction, or at least after a market consolidation (lateral sector). This can give you a stop loss very close and the price may already be at the edge of the area. Since you are in an area closer to , you get higher profits!
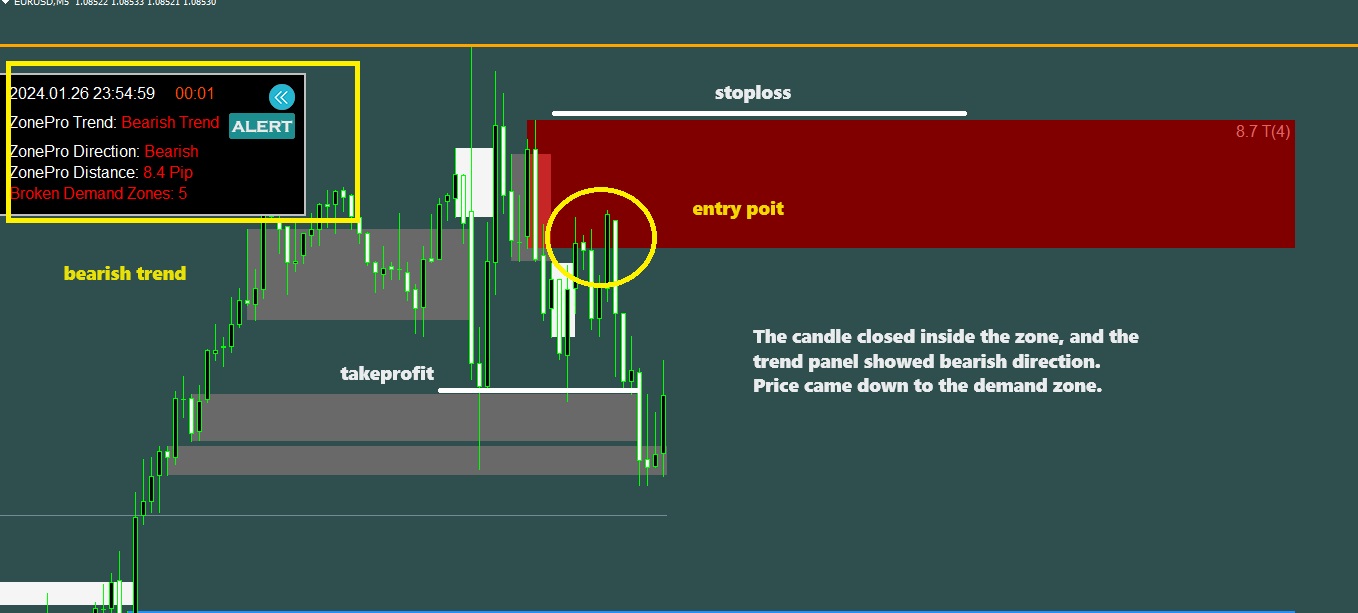
b. Depending on your market analysis and trends panel, you can place limit orders on either side of the zone. (Stoploss is always at the opposite end of the zone + wiggle room)! For experienced traders only.
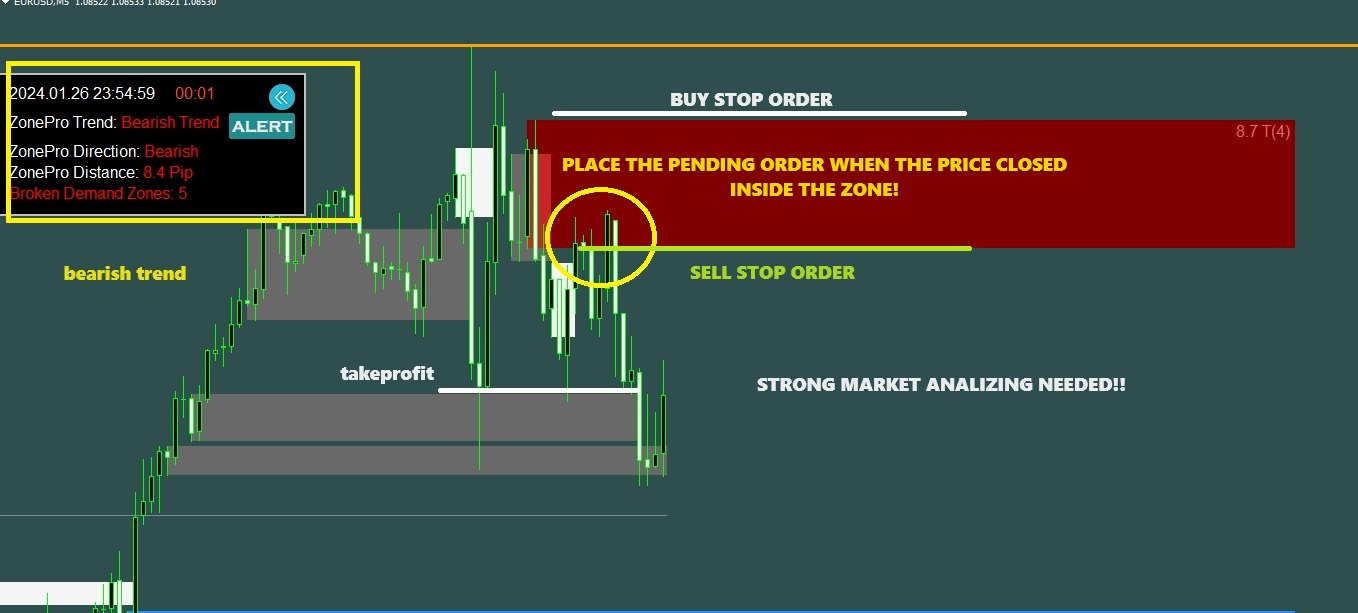
- The following two options are live candle alerts: Tested Zone and Retested Zone Alerts:
- teaPredicted Zone: Receive an alert the first time the price touches that zone! There is a very good chance that you will step out of that area and create a great trading opportunity! Only engage in trades if you can catch them near or inside the zone! Of course, trading begins when you place a limit order in the Fresh Zone described above!
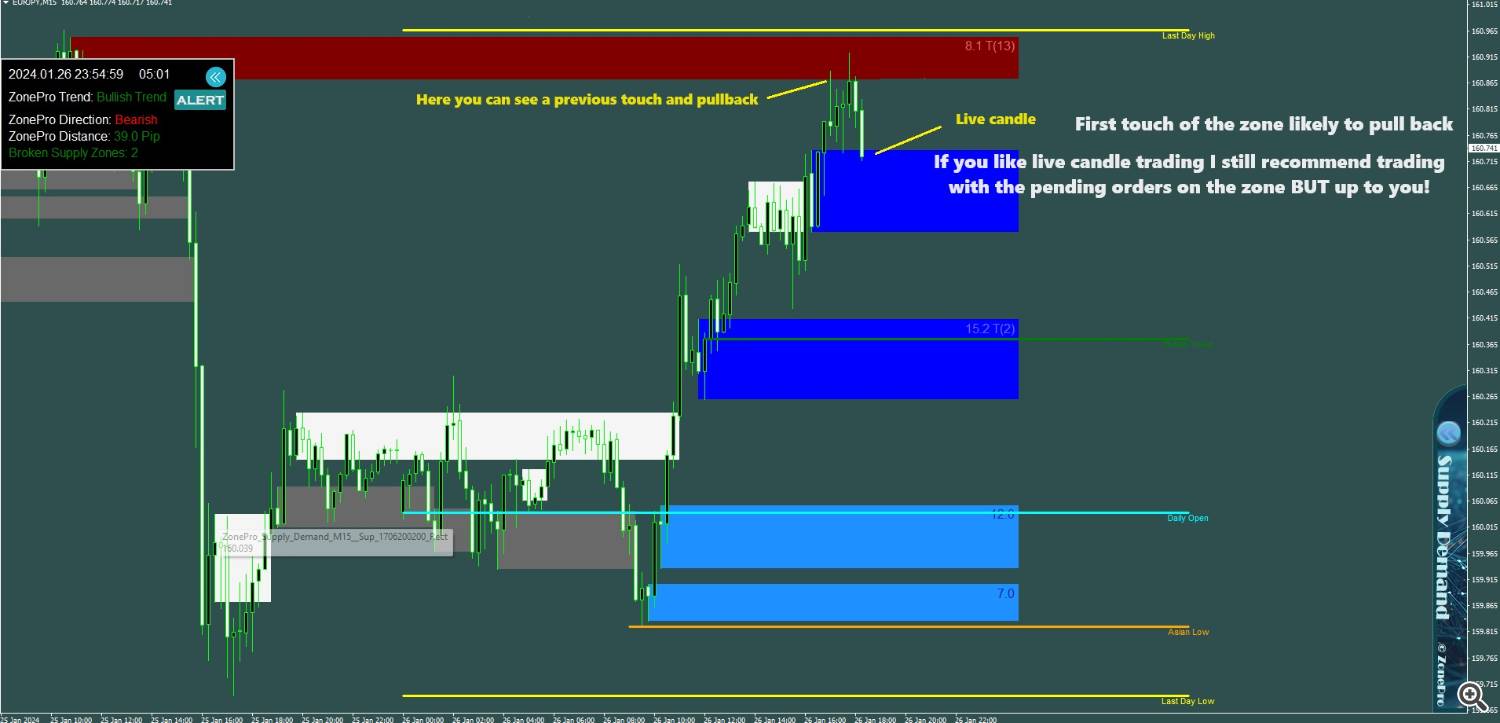
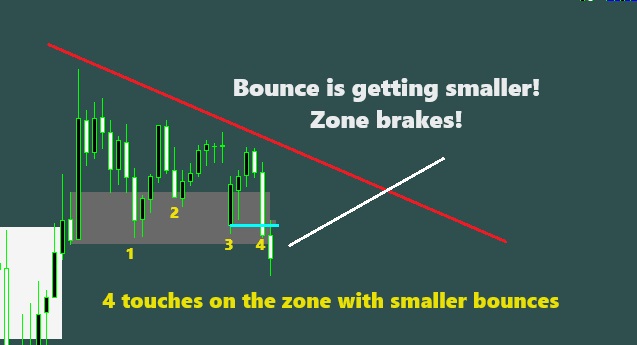
- Retested Zone: Receive an alert when the price touches that zone a second or more time! Traders say that the more you touch the zone, the stronger you become. truth. —– As the recoil in an area becomes less and less, the more likely it is that the area will break!
- The next three options are reverse candle formations that touch/enter/open inside the zone but close in the opposite direction outside the zone!
- Engulfing candle: The strongest candle of the three! A candle that gains strength from an area and closes below/above the previous candle! As with all trading, it gets stronger if you trade in the direction of the trend (my favorite pattern).
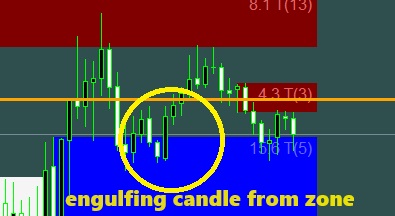
- Reversal candle: Same as above, but the candle does not close below/above the previous candle.
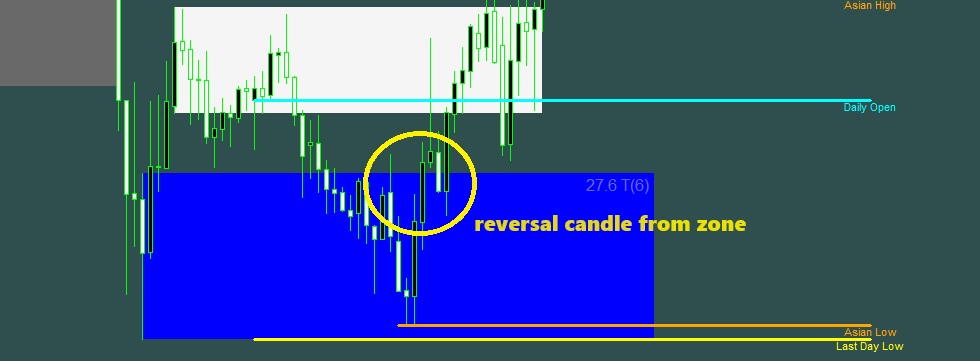
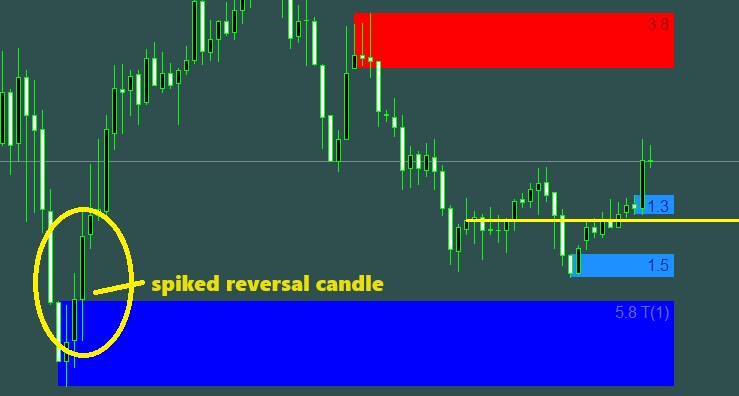
- Spike Rev candle: A candle that touches the zone and then pulls back (leaving a spike) to form a reversal candle.
Thank you for purchasing my product and reading the manual! If you have any questions please contact me!
For every trade, it is always best to check the trade using at least 1 other indicator. I use the MACD CROSS scanner, a robust moving average convergence divergence algorithm that comes with a false cross filter.
You can find my products here.
https://www.mql5.com/en/users/gabedk/seller
