Introduction to Trend Strength Indicator – Trading Strategy – May 18, 2024

Reveal trend strength:
Forex Trader’s Toolkit
attractiveness forex trading It’s about taking advantage of trends. But not all trends are created equal. A strong, sustained trend offers much more profit potential than a slow, meandering trend. This is where trend strength indicators come into play. It is a powerful tool that helps you measure the momentum of price movements and identify the most promising trading opportunities.
these technical analysis tools It acts as a compass and helps gauge the strength of price movements. Let’s take a look at some popular trend strength indicators and how they can power your trading decisions.

1. Moving Average Convergence Divergence (MACD):
MACD is a multifaceted indicator that provides insight into trend direction and strength. It consists of two moving averages (MA): the fast moving average (EMA) and the slow moving average (EMA). The MACD line, the distance between these lines, reflects trend momentum. As the distance widens, it indicates a strong trend, and as the distance narrows, it indicates a weakening trend. Additionally, a divergence between the MACD line and the signal line (another EMA) can provide an early signal of a potential trend reversal.
2. Average Directional Index (ADX):
Unlike MACD, ADX ignores direction and focuses only on trend strength. It consists of three lines: the ADX line, +DI (positive direction indicator), and -DI (negative direction indicator). An ADX line rising above a certain threshold (usually 25) indicates a strong trend, regardless of whether it is rising or falling. Meanwhile, the +DI and -DI lines indicate the strength of the uptrend and downtrend respectively, helping to identify which side is dominating the trend.
3. Relative Strength Index (RSI):
Although not exclusive RSI, a trend strength indicator, can provide valuable clues. An oscillator that primarily measures price momentum, RSI has a range from 0 to 100. Anything above 70 indicates overbought conditions and potentially a weakening upward trend. Conversely, anything below 30 suggests oversold conditions and could be a sign that the downtrend is likely to reverse. By identifying these potential turning points, you can prepare for the continuation of a trend or predict a potential reversal.
4. Bollinger Bands:
Bollinger Bands® are volatility indicators that can also provide insight into trend strength. This band expands and contracts depending on price volatility. In strong trends, price movement tends to be limited within the bands and with limited forays outside the bands. Conversely, during periods of weakening trends, price action may break out of the bands more frequently, suggesting increased volatility and a potential trend change.
5. Price action:
Don’t underestimate the power of pure price fluctuations! Observing higher highs and higher lows in an uptrend or lower lows and lower highs in a downtrend are simple yet effective measures. Trend strength. Sharp price movements and continued breakaways from existing support/resistance levels further solidify a strong trend.
6. Mixed trend method:
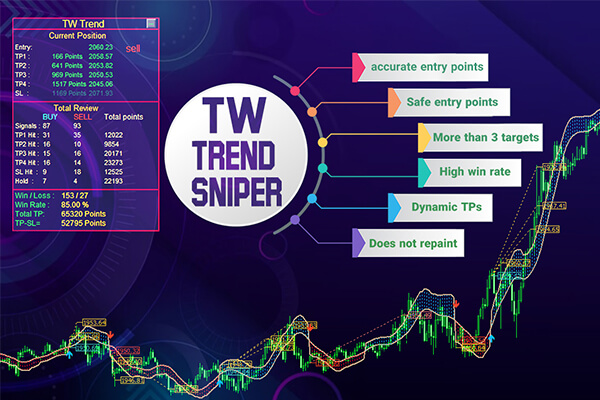
introduction “TW Trend Sniper” indicator is a powerful indicator used to identify key trends using “Trade Wizards” proprietary indicator formulas with price action, currency trading session detection, Fibonacci and detection functions and artificial intelligence. High-accuracy noise removal method.

remember:
No single indicator is a perfect way to measure trend strength. The best approach is to use a combination of indicators along with price action analysis to get a more holistic understanding of the market. Here are some additional tips:
- Consider the time period. Trend strength indicators can be applied to different time periods (short-term, long-term). Choose the period that suits your situation Trading Strategy.
- Don’t rely solely on indicators. Always consider Fundamental Analysis and Economic News Events To get the complete picture.
- Backtest your strategy. Before deploying these indicators with real capital, test historical data to see how they have performed.
By incorporating trend strength indicators into your analysis With our Forex trading toolbox, you will be better equipped to identify strong trends, improve your entry and exit timing, and ultimately maximize your profit potential.
happy trading
May the pips be in your favor!


