The Secret of Bollinger Bands! – Analysis and Forecast – April 17, 2024

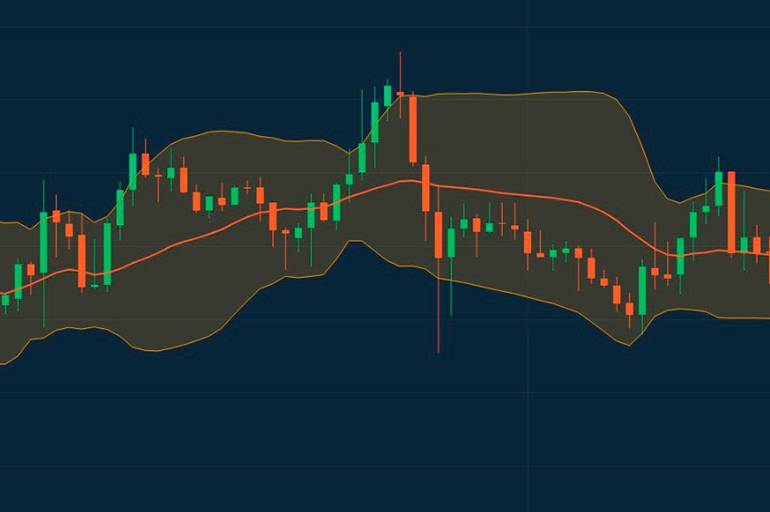
Bollinger Bands are a volatility indicator used by traders to identify areas of support and resistance and areas where an asset’s volatility may increase or decrease. Bollinger Bands are calculated as three lines drawn on a price chart.
The first is the simple moving average (SMA) of the price of an asset over a specific period of time (usually 20 days). The upper band is the SMA times 2 plus 2 standard deviations, and the lower band is the SMA minus 2 times 2 standard deviations.
Here’s the exact way to calculate the various Bollinger Bands:
- Upper band = 20-day SMA + (20-day standard deviation x 2)
- Lower band = 20-day SMA – (20-day standard deviation x 2)
- SMA is calculated by adding up the closing prices for a specific period and dividing that figure by the total number of periods.
Used by many traders Bollinger Band To indicate areas of market volatility, we assume that the further a band deviates from its SMA, the more volatile the underlying market becomes. In contrast, if the bands are narrow, many traders take them to show that the underlying market price is stable.
When the band widens, traders call it a Bollinger bounce and believe it signals an imminent retracement. A narrowing band is known as a Bollinger squeeze and is used to indicate an upcoming breakout of the underlying asset.
Bollinger Bands are a lagging indicator, which some see as a disadvantage. This means that we try to identify trends rather than predict future market movements. Indicators that attempt to predict future market movements are known as leading indicators and include: Relative Strength Index (RSI) Or a stochastic oscillator.
However, while lagging indicators such as Bollinger Bands can help you identify trends before entering a position, they are most effective when used in conjunction with other technical indicators. This means that traders can miss the start of a trend but still profit after using a lagging indicator or a collection of lagging indicators to confirm the trend.
If you don’t like the standards Bollinger BandYou can try: monopoly bollinger.
monopoly bollinger For MetaTrader 4: https://www.mql5.com/en/market/product/24336
monopoly bollinger For MetaTrader 5: https://www.mql5.com/en/market/product/25318


